| Param | Original file | Final file |
|---|---|---|
| Filename | modeM0/AS1A12_052T04_9000005388_38596cztM0_level2.fits | modeM0/AS1A12_052T04_9000005388_38596cztM0_level2_quad_clean.evt |
| Size (bytes) | 390,297,600 | 95,005,440 |
| Size | 372.2 MB | 90.6 MB |
| Events in quadrant A | 2,952,667 | 655,909 |
| Events in quadrant B | 4,257,485 | 616,638 |
| Events in quadrant C | 2,847,650 | 629,681 |
| Events in quadrant D | 3,949,432 | 578,402 |
| Mode M0 | |||
|---|---|---|---|
| Quadrant | BADHDUFLAG | Total packets | Discarded packets |
| A | 0 | 12177 | 3 |
| B | 0 | 16399 | 2 |
| C | 0 | 12104 | 2 |
| D | 0 | 15530 | 2 |
| Mode SS | |||
|---|---|---|---|
| Quadrant | BADHDUFLAG | Total packets | Discarded packets |
| A | 0 | 116 | 0 |
| B | 0 | 116 | 0 |
| C | 0 | 116 | 0 |
| D | 0 | 116 | 0 |
| Mode M9 | |||
|---|---|---|---|
| Quadrant | BADHDUFLAG | Total packets | Discarded packets |
| A | 0 | 15 | 0 |
| B | 0 | 15 | 0 |
| C | 0 | 15 | 0 |
| D | 0 | 16 | 0 |
| Quadrant | Total seconds | Saturated seconds | Saturation percentage |
|---|---|---|---|
| A | 5660 | 13 | 0.229682% |
| B | 5660 | 509 | 8.992933% |
| C | 5660 | 32 | 0.565371% |
| D | 5660 | 164 | 2.897527% |
Noise dominated data is calculated using 1-second bins in cleaned event files. If a bin has >2000 counts, and if more than 50% of those come from <1% of pixels, then it is considered to be noise-dominated and hence unusable.
| Quadrant | # 1 sec bins | Bins with >0 counts | Bins with >2000 counts | High rate bins dominated by noise | Noise dominated (total time) | Noise dominated (detector-on time) | Marked lightcurve |
|---|---|---|---|---|---|---|---|
| A | 7213 | 5661 | 5 | 5 | 0.07% | 0.09% | 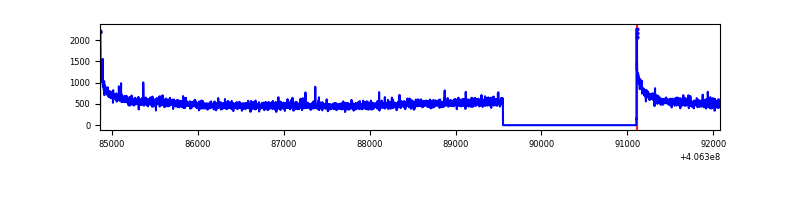 |
| B | 7213 | 5661 | 414 | 414 | 5.74% | 7.31% | 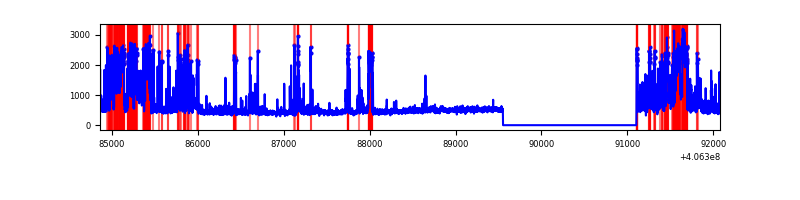 |
| C | 7213 | 5661 | 26 | 26 | 0.36% | 0.46% | 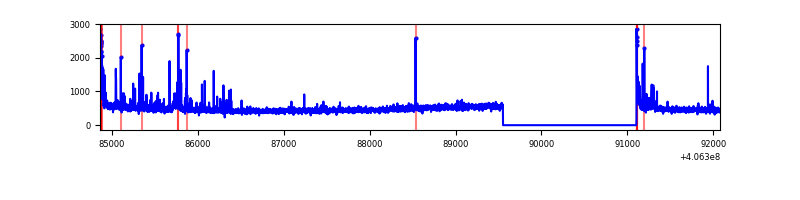 |
| D | 7213 | 5661 | 153 | 153 | 2.12% | 2.70% | 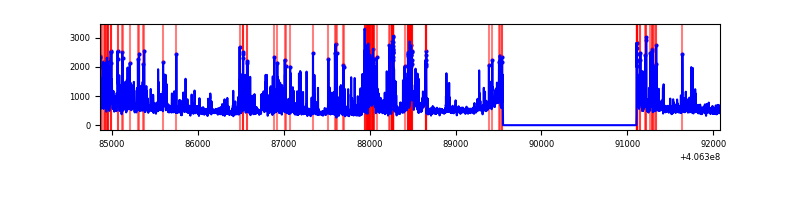 |
Top three noisy pixels from each quadrant. If the there are fewer than three noisy pixels in the level2.evt file, extra rows are filled as -1
| Pixel properties | Quadrant properties | ||||||
|---|---|---|---|---|---|---|---|
| Quadrant | DetID | PixID | Counts | Sigma | Mean | Median | Sigma |
| A | 10 | 83 | 463435 | 3616.14 | 634 | 621 | 128.0 |
| A | 13 | 6 | 14534 | 108.71 | 634 | 621 | 128.0 |
| A | 13 | 248 | 13341 | 99.39 | 634 | 621 | 128.0 |
| B | 5 | 184 | 1165003 | 10003.76 | 606 | 590 | 116.4 |
| B | 5 | 172 | 205325 | 1758.93 | 606 | 590 | 116.4 |
| B | 15 | 32 | 128114 | 1095.59 | 606 | 590 | 116.4 |
| C | 15 | 214 | 233583 | 1644.41 | 607 | 610 | 141.7 |
| C | 14 | 254 | 103305 | 724.86 | 607 | 610 | 141.7 |
| C | 0 | 10 | 86357 | 605.23 | 607 | 610 | 141.7 |
| D | 1 | 47 | 639051 | 4302.38 | 604 | 586 | 148.4 |
| D | 12 | 235 | 227847 | 1531.43 | 604 | 586 | 148.4 |
| D | 2 | 249 | 206732 | 1389.14 | 604 | 586 | 148.4 |
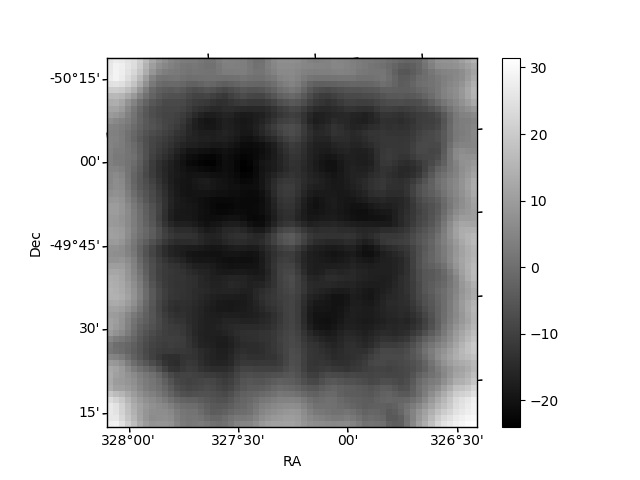
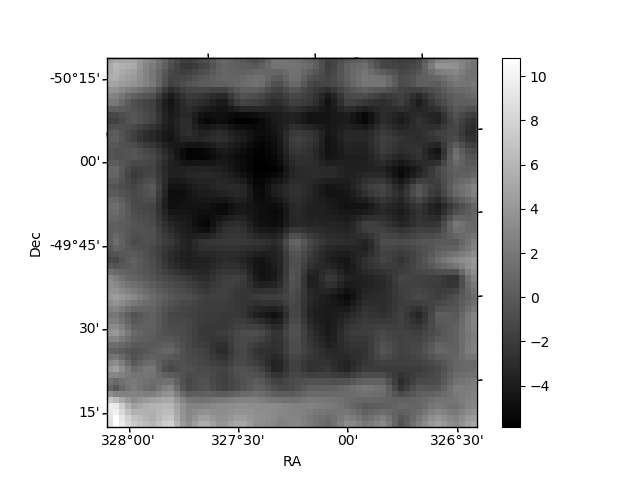
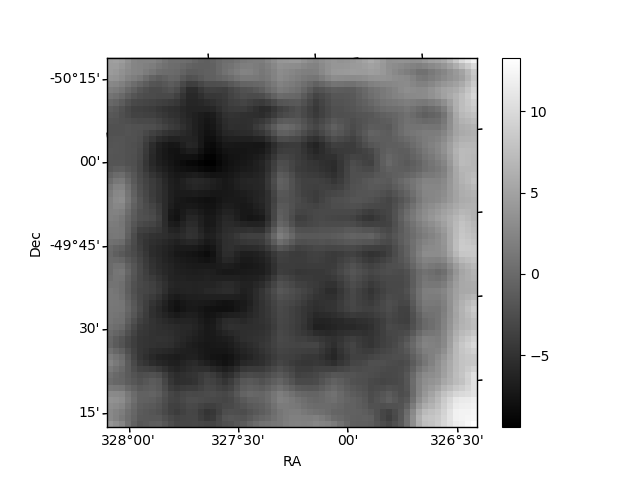
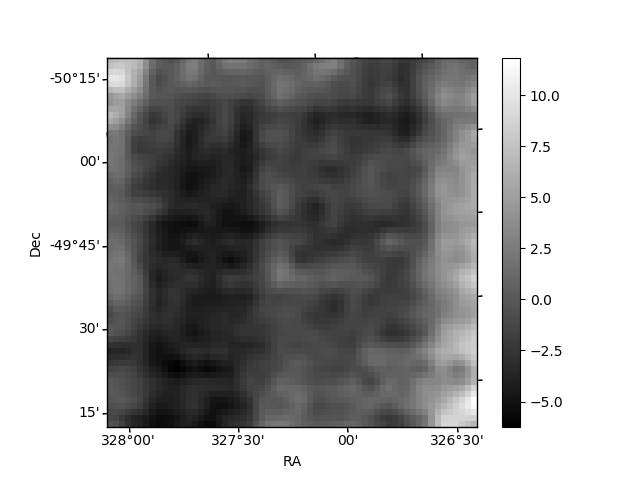
Histogram calculated using DETX and DETY for each event in the final _common_clean file
| Quadrant A | 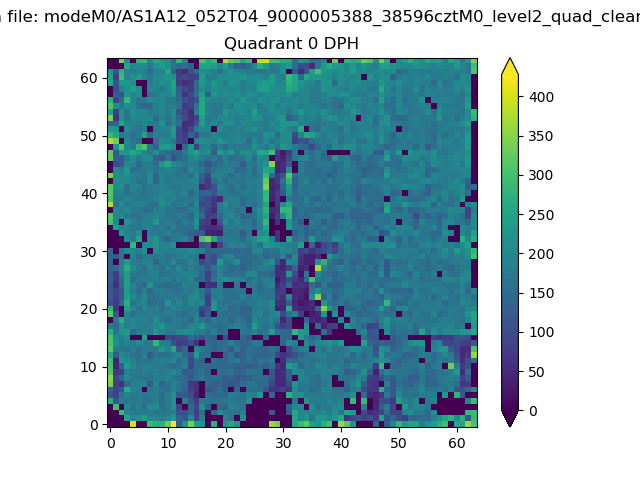 |
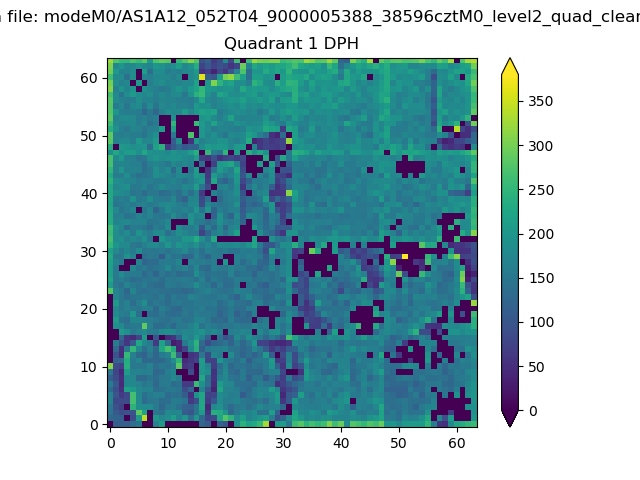 |
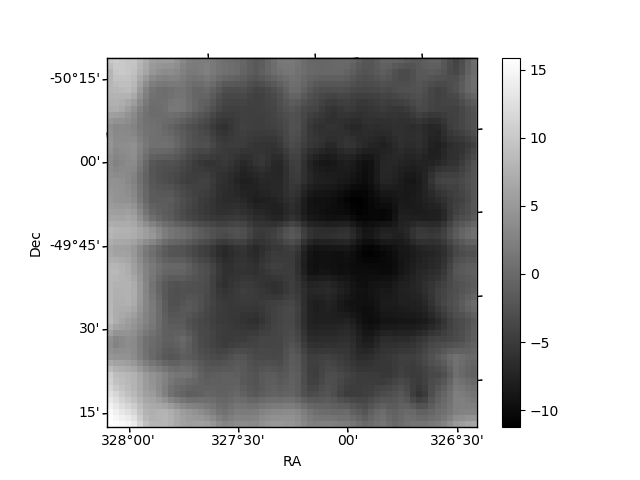
Quadrant B |
|---|---|---|---|
| Quadrant D | 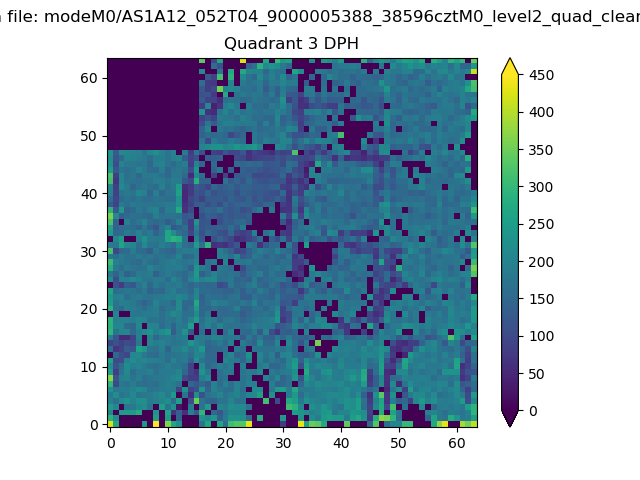 |
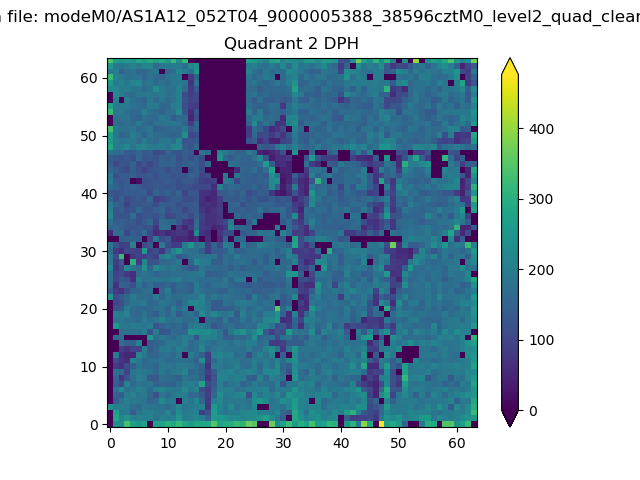 |
Quadrant C |
| Plot type | Count rate plots | Images |
|---|---|---|
| Comparison with Poisson distribution Blue bars denote a histogram of data divided into 1 sec bins. Red curve is a Poisson curve with rate = median count rate of data. |
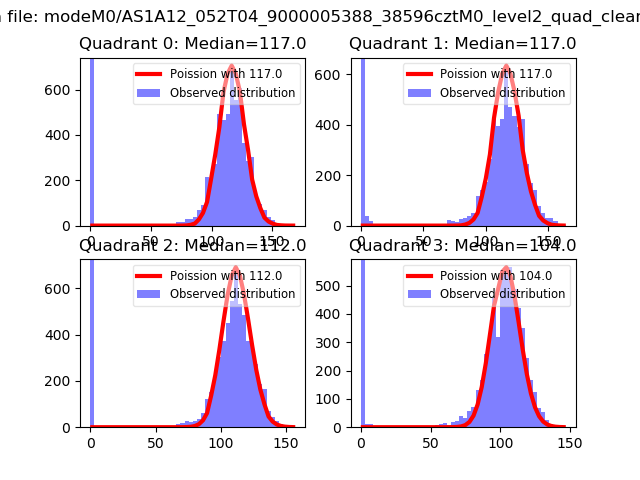 |
 |
| Quadrant-wise count rates Data is divided into 100 sec bins |
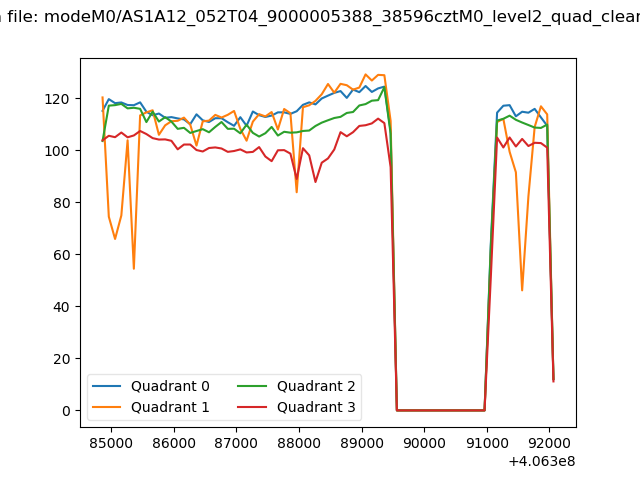 |
|
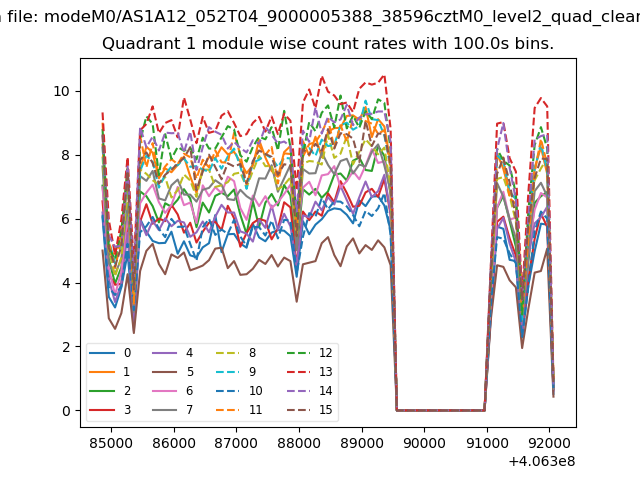
| Module-wise count rates for Quadrant A Data is divided into 100 sec bins |
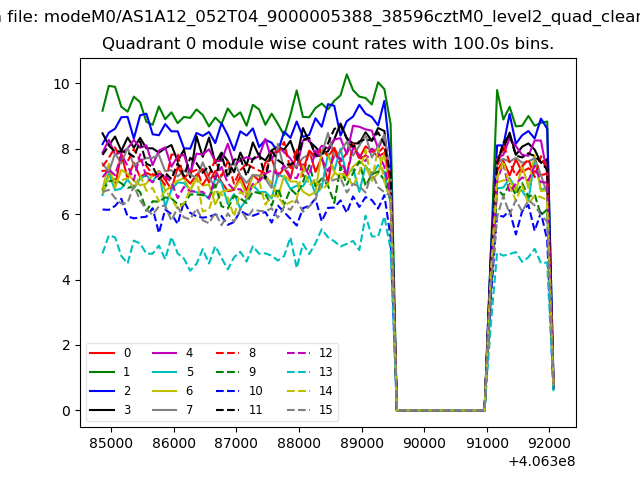 |
 |
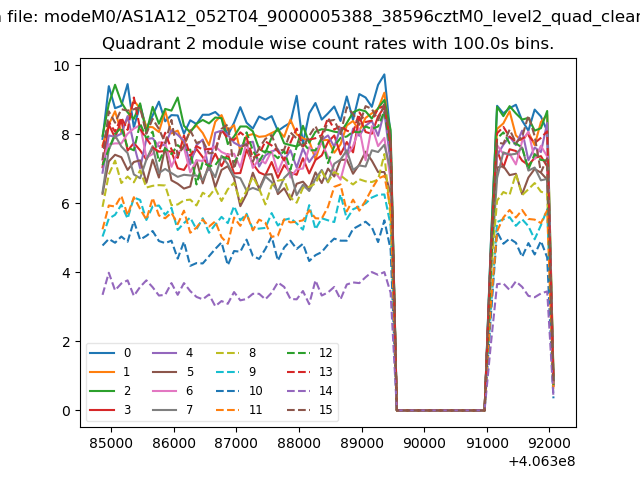
| Module-wise count rates for Quadrant B Data is divided into 100 sec bins |
 |
 |
| Module-wise count rates for Quadrant C Data is divided into 100 sec bins |
 |
 |
| Module-wise count rates for Quadrant D Data is divided into 100 sec bins |
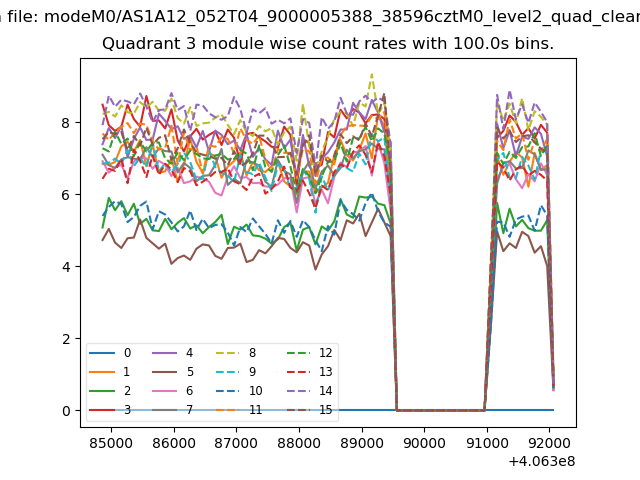 |
 |
| Parameter | Plot |
|---|---|
| CZT HV Monitor | 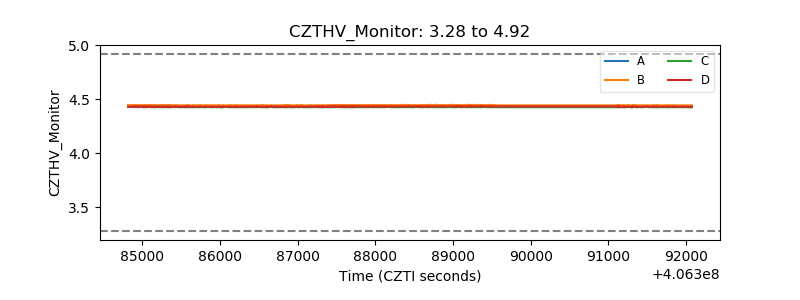 |
| D_VDD | 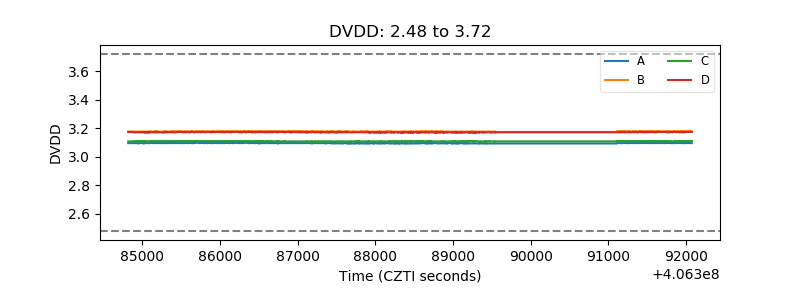 |
| Temperature 1 | 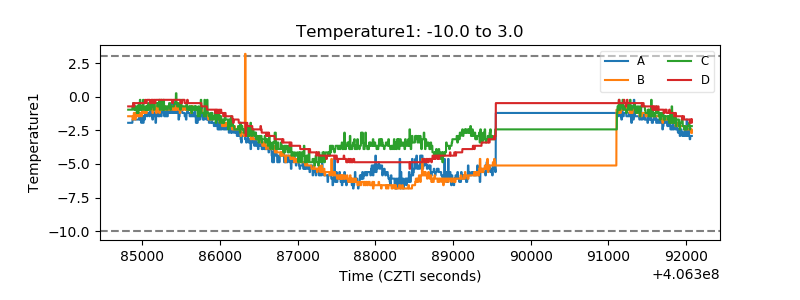 |
| Veto HV Monitor | 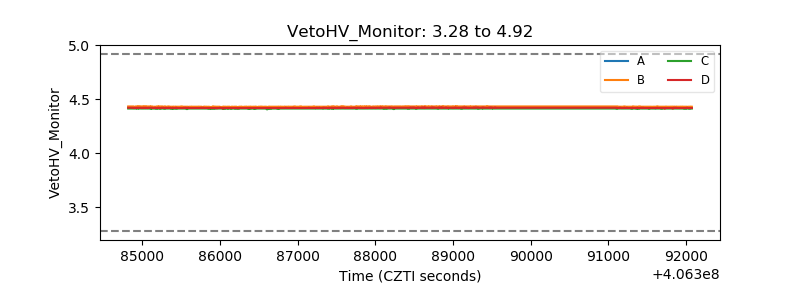 |
| Veto LLD | 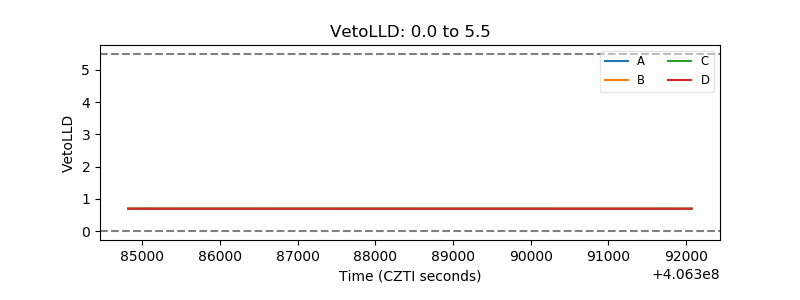 |
| Alpha Counter | 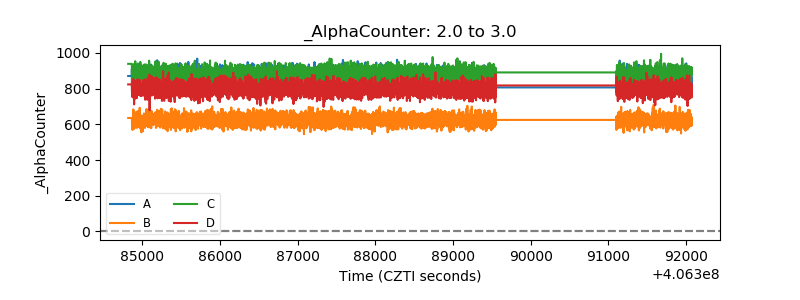 |
| _CPM_Rate | 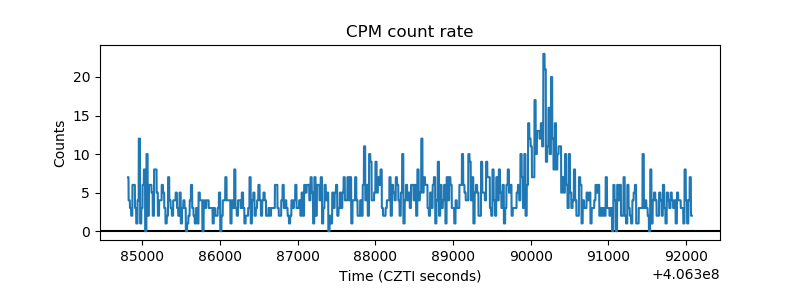 |
| CZT Counter | 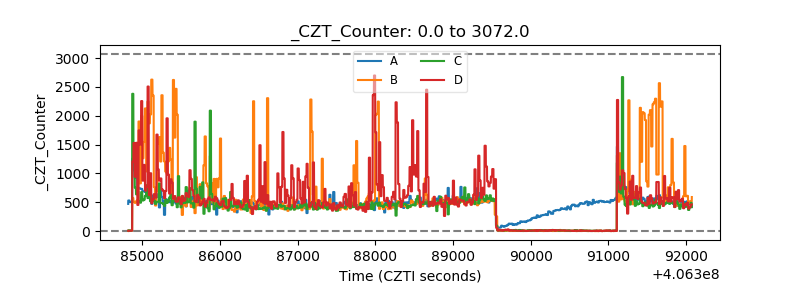 |
| +2.5 Volts monitor | 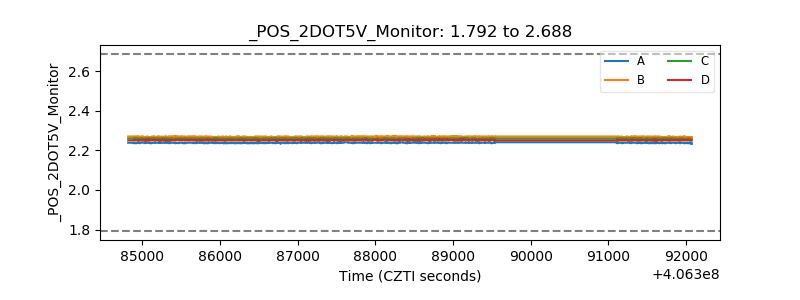 |
| +5 Volts monitor |  |
| _ROLL_ROT | 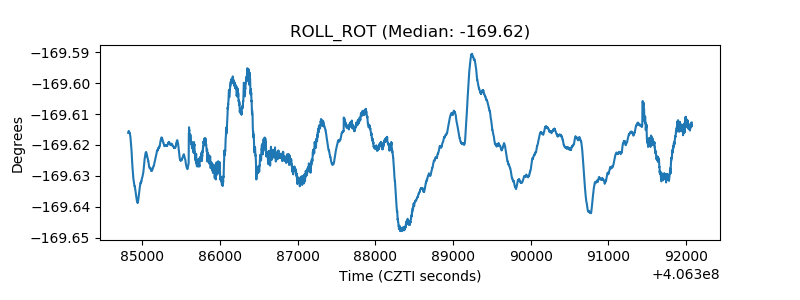 |
| _Roll_DEC | 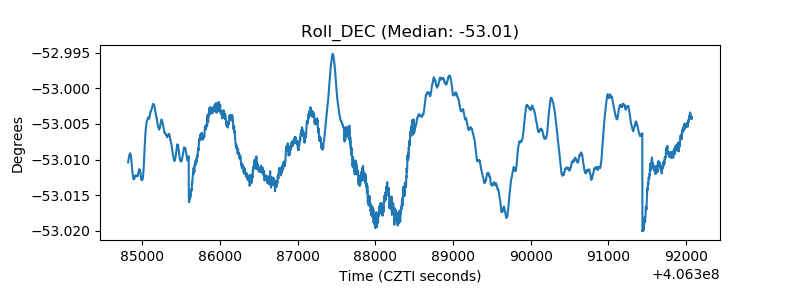 |
| _Roll_RA | 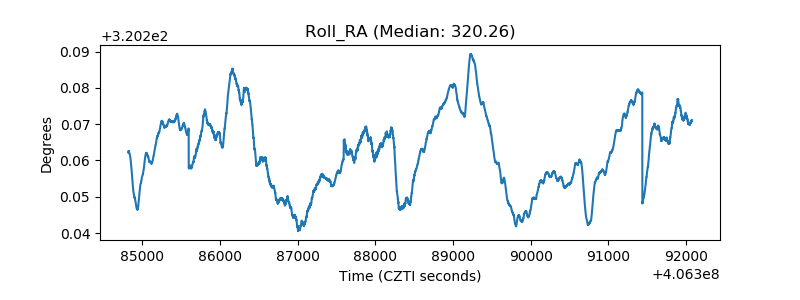 |
| Veto Counter | 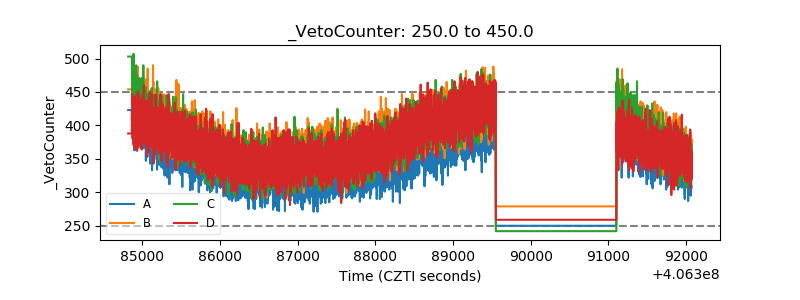 |