| Param | Original file | Final file |
|---|---|---|
| Filename | modeM0/AS1A12_052T04_9000005388_38597cztM0_level2.fits | modeM0/AS1A12_052T04_9000005388_38597cztM0_level2_quad_clean.evt |
| Size (bytes) | 399,585,600 | 95,397,120 |
| Size | 381.1 MB | 91.0 MB |
| Events in quadrant A | 3,015,837 | 657,975 |
| Events in quadrant B | 4,915,445 | 606,452 |
| Events in quadrant C | 2,848,217 | 635,116 |
| Events in quadrant D | 3,562,483 | 585,191 |
| Mode M0 | |||
|---|---|---|---|
| Quadrant | BADHDUFLAG | Total packets | Discarded packets |
| A | 0 | 12472 | 2 |
| B | 0 | 18350 | 1 |
| C | 0 | 12129 | 1 |
| D | 0 | 14457 | 1 |
| Mode SS | |||
|---|---|---|---|
| Quadrant | BADHDUFLAG | Total packets | Discarded packets |
| A | 0 | 118 | 0 |
| B | 0 | 118 | 0 |
| C | 0 | 118 | 0 |
| D | 0 | 118 | 0 |
| Mode M9 | |||
|---|---|---|---|
| Quadrant | BADHDUFLAG | Total packets | Discarded packets |
| A | 0 | 13 | 0 |
| B | 0 | 13 | 0 |
| C | 0 | 13 | 0 |
| D | 0 | 13 | 0 |
| Quadrant | Total seconds | Saturated seconds | Saturation percentage |
|---|---|---|---|
| A | 5774 | 17 | 0.294423% |
| B | 5774 | 681 | 11.794250% |
| C | 5774 | 13 | 0.225147% |
| D | 5774 | 70 | 1.212331% |
Noise dominated data is calculated using 1-second bins in cleaned event files. If a bin has >2000 counts, and if more than 50% of those come from <1% of pixels, then it is considered to be noise-dominated and hence unusable.
| Quadrant | # 1 sec bins | Bins with >0 counts | Bins with >2000 counts | High rate bins dominated by noise | Noise dominated (total time) | Noise dominated (detector-on time) | Marked lightcurve |
|---|---|---|---|---|---|---|---|
| A | 7115 | 5775 | 10 | 10 | 0.14% | 0.17% | 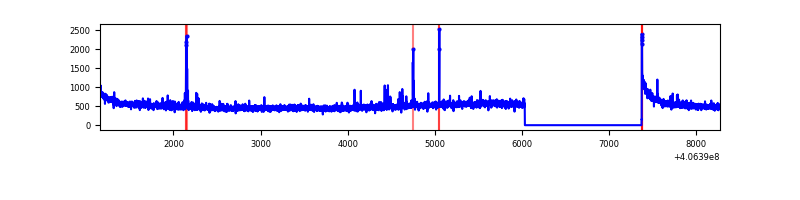 |
| B | 7115 | 5775 | 545 | 545 | 7.66% | 9.44% | 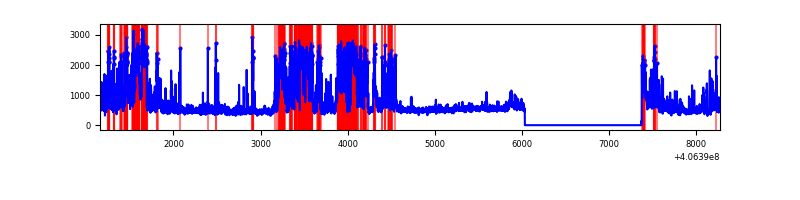 |
| C | 7115 | 5775 | 11 | 11 | 0.15% | 0.19% | 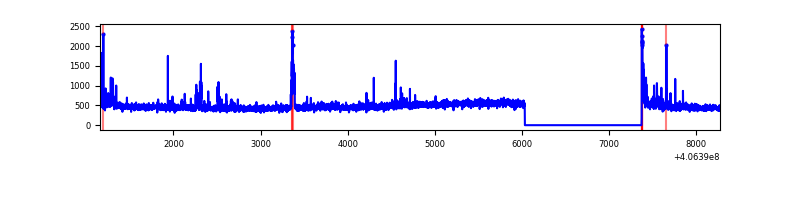 |
| D | 7115 | 5775 | 87 | 87 | 1.22% | 1.51% | 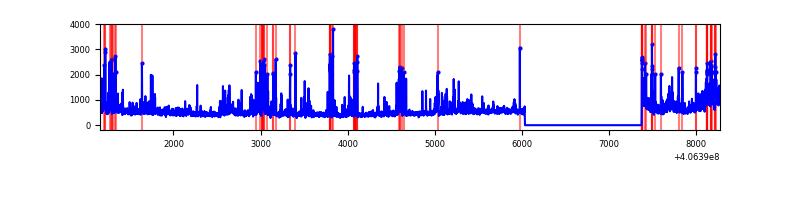 |
Top three noisy pixels from each quadrant. If the there are fewer than three noisy pixels in the level2.evt file, extra rows are filled as -1
| Pixel properties | Quadrant properties | ||||||
|---|---|---|---|---|---|---|---|
| Quadrant | DetID | PixID | Counts | Sigma | Mean | Median | Sigma |
| A | 10 | 83 | 437880 | 3333.28 | 645 | 635 | 131.2 |
| A | 13 | 248 | 37710 | 282.64 | 645 | 635 | 131.2 |
| A | 9 | 143 | 20840 | 154.03 | 645 | 635 | 131.2 |
| B | 5 | 184 | 1725078 | 14358.36 | 617 | 600 | 120.1 |
| B | 5 | 200 | 218919 | 1817.77 | 617 | 600 | 120.1 |
| B | 4 | 251 | 160127 | 1328.25 | 617 | 600 | 120.1 |
| C | 15 | 214 | 236227 | 1619.46 | 622 | 625 | 145.5 |
| C | 14 | 254 | 78393 | 534.56 | 622 | 625 | 145.5 |
| C | 15 | 159 | 52162 | 354.25 | 622 | 625 | 145.5 |
| D | 12 | 235 | 441552 | 2900.67 | 622 | 604 | 152.0 |
| D | 1 | 47 | 215476 | 1413.48 | 622 | 604 | 152.0 |
| D | 12 | 227 | 103050 | 673.92 | 622 | 604 | 152.0 |
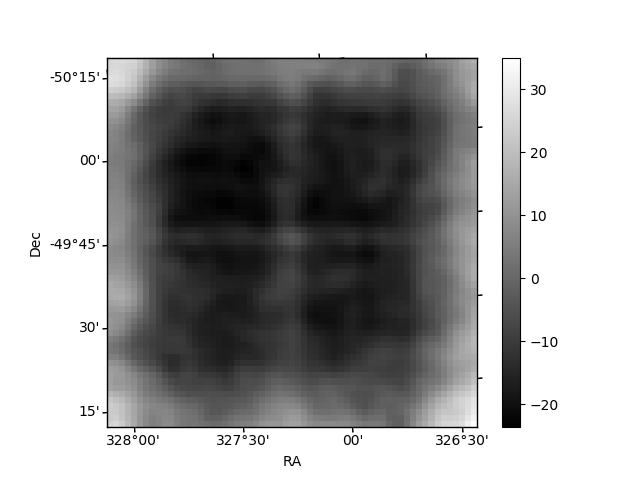
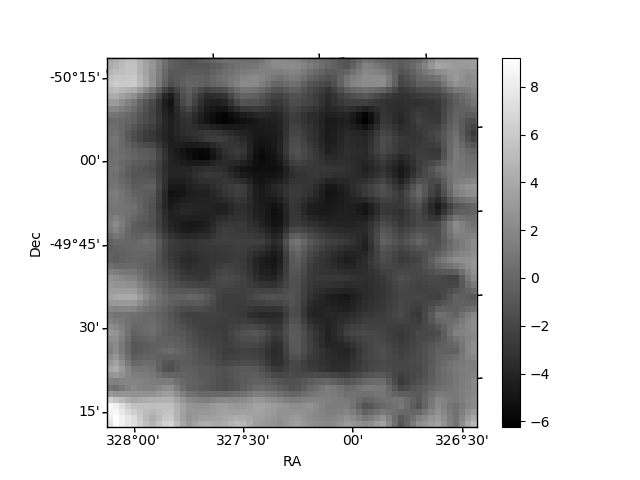
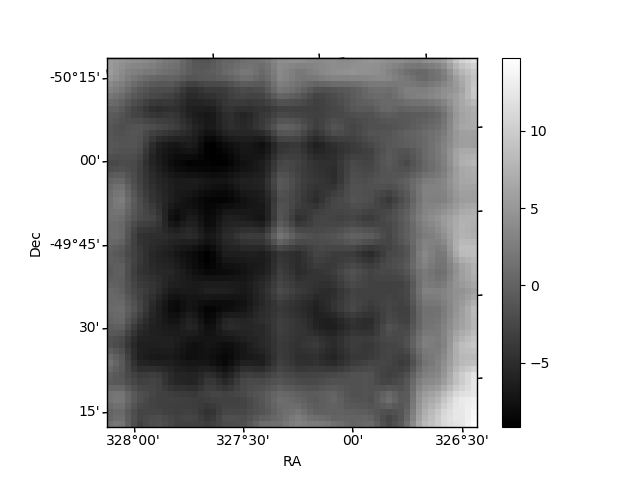
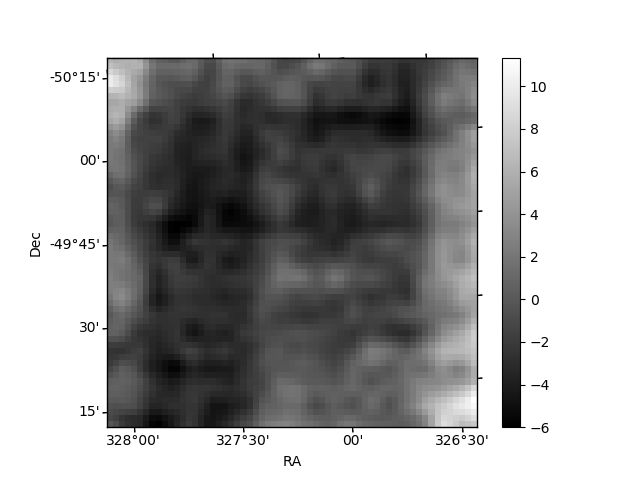
Histogram calculated using DETX and DETY for each event in the final _common_clean file
| Quadrant A | 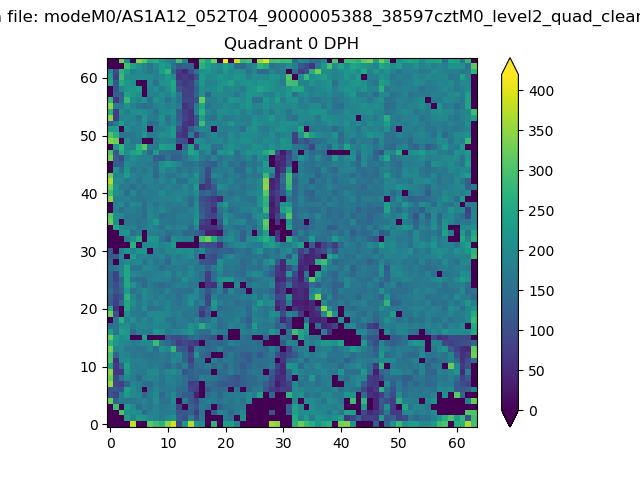 |
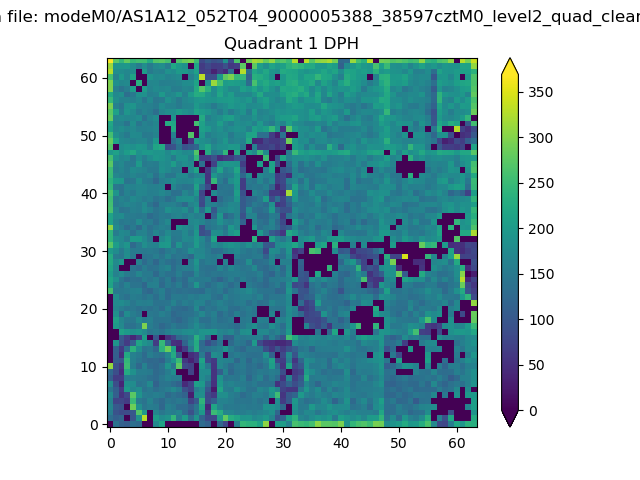 |
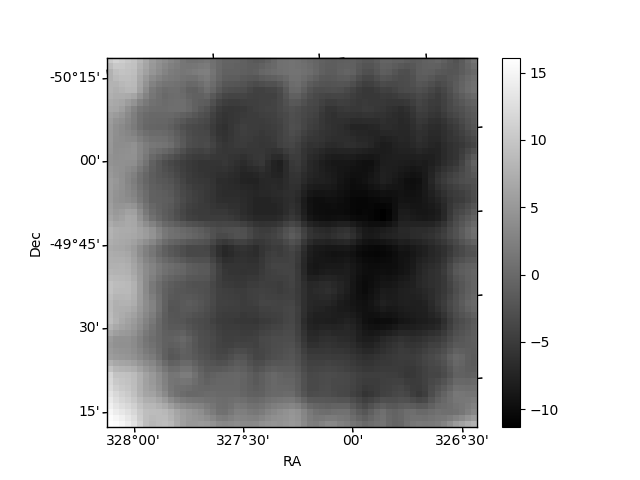
Quadrant B |
|---|---|---|---|
| Quadrant D | 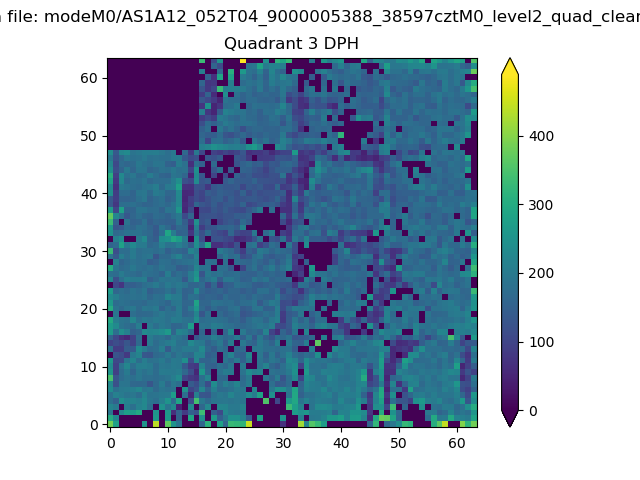 |
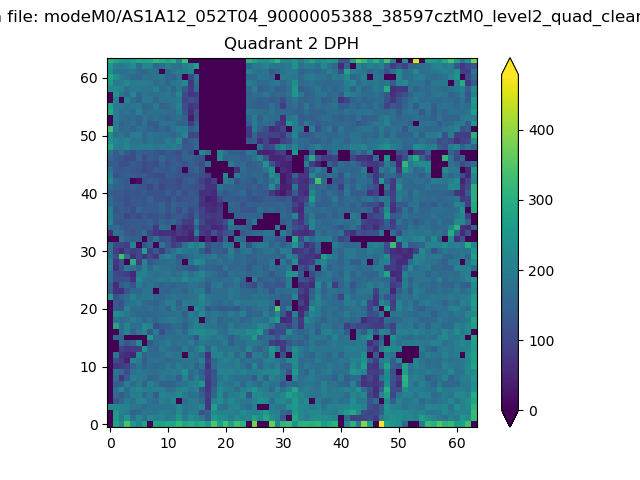 |
Quadrant C |
| Plot type | Count rate plots | Images |
|---|---|---|
| Comparison with Poisson distribution Blue bars denote a histogram of data divided into 1 sec bins. Red curve is a Poisson curve with rate = median count rate of data. |
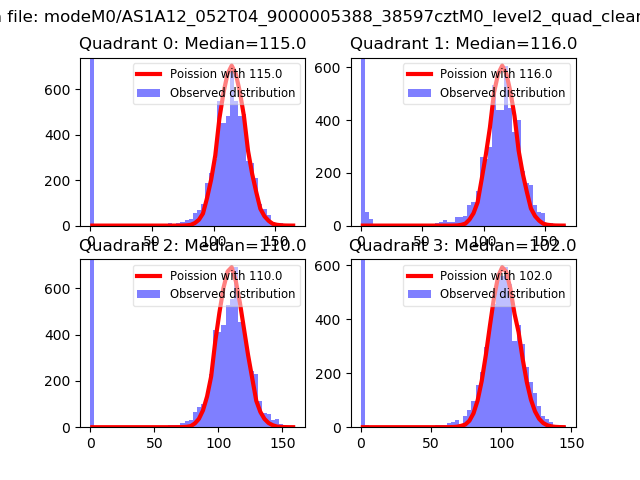 |
 |
| Quadrant-wise count rates Data is divided into 100 sec bins |
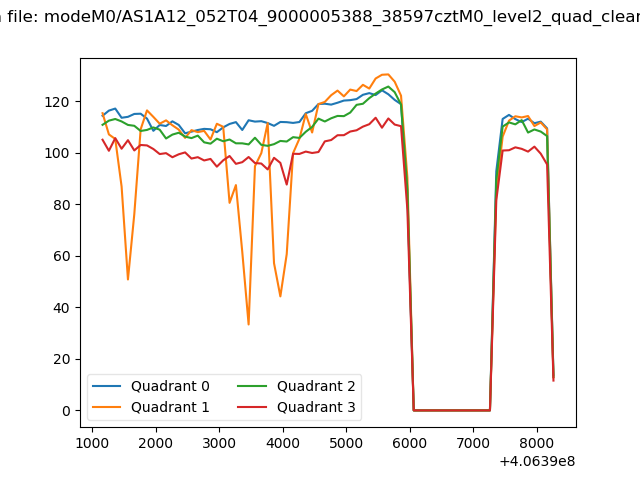 |
|
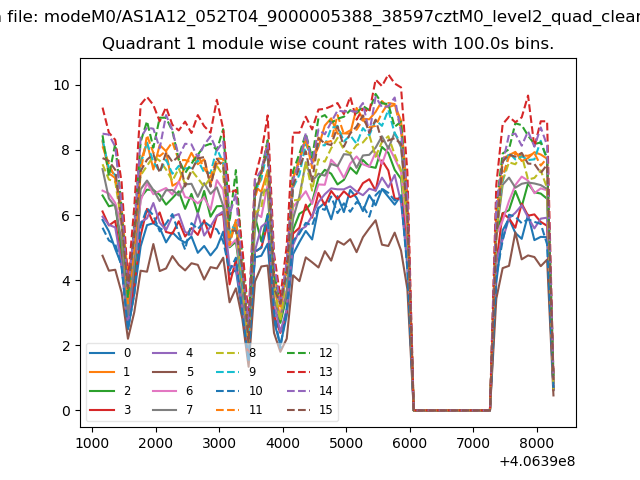
| Module-wise count rates for Quadrant A Data is divided into 100 sec bins |
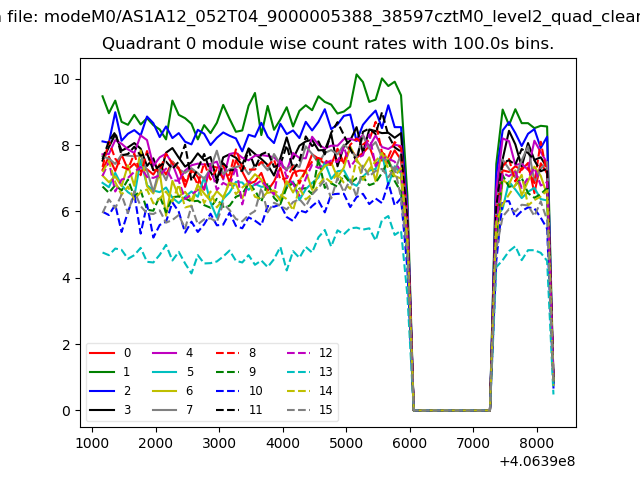 |
 |
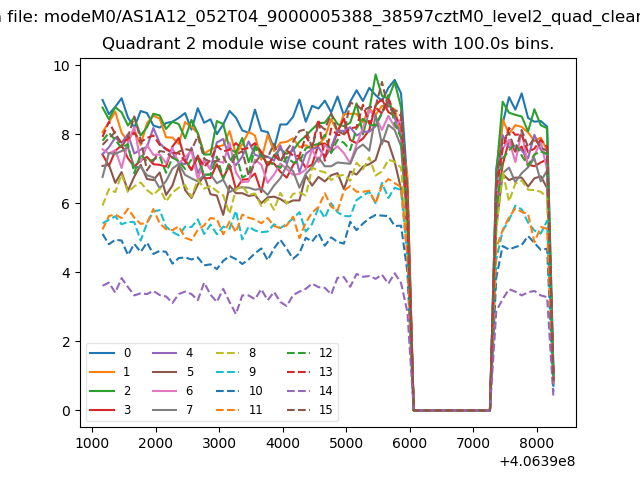
| Module-wise count rates for Quadrant B Data is divided into 100 sec bins |
 |
 |
| Module-wise count rates for Quadrant C Data is divided into 100 sec bins |
 |
 |
| Module-wise count rates for Quadrant D Data is divided into 100 sec bins |
 |
 |
| Parameter | Plot |
|---|---|
| CZT HV Monitor | 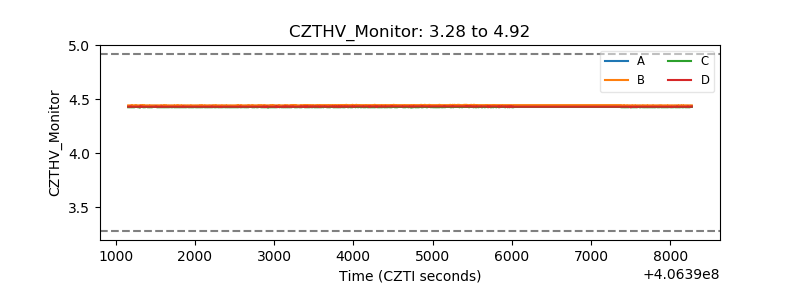 |
| D_VDD | 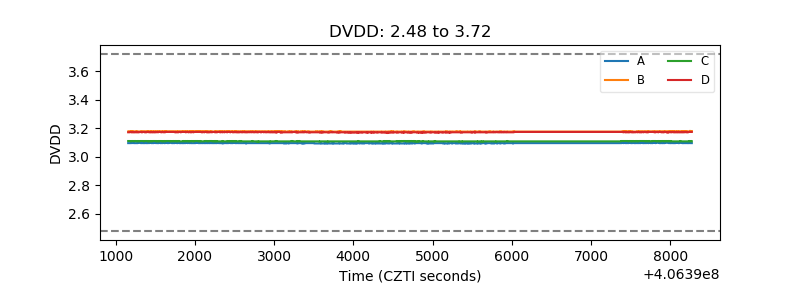 |
| Temperature 1 | 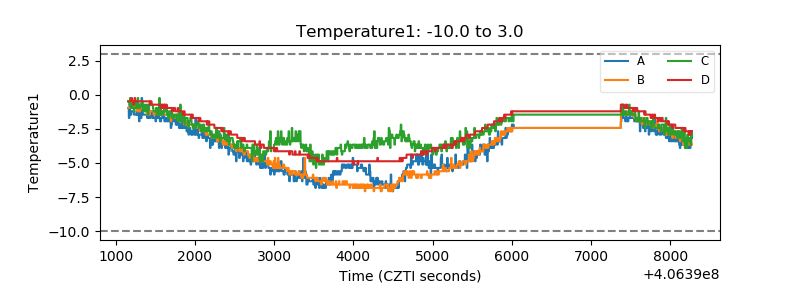 |
| Veto HV Monitor | 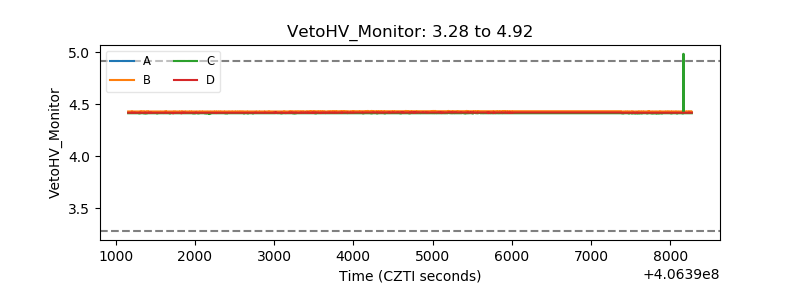 |
| Veto LLD | 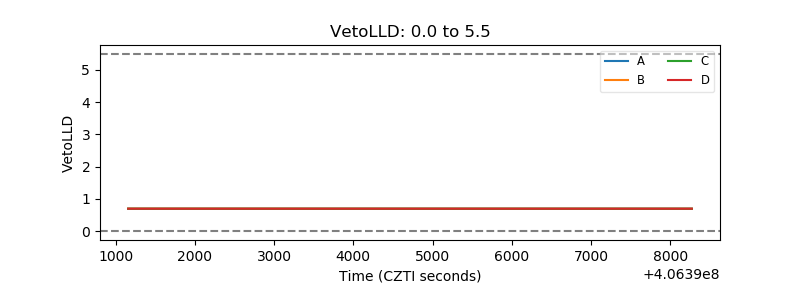 |
| Alpha Counter | 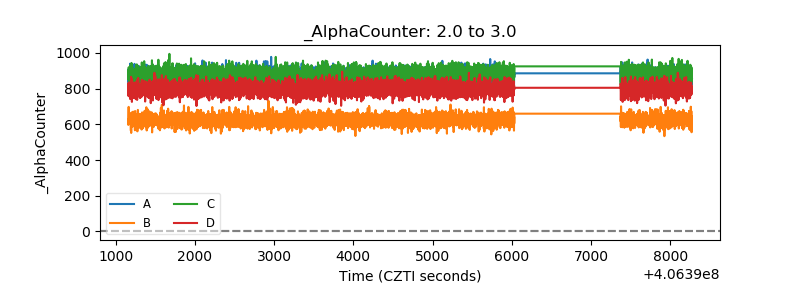 |
| _CPM_Rate | 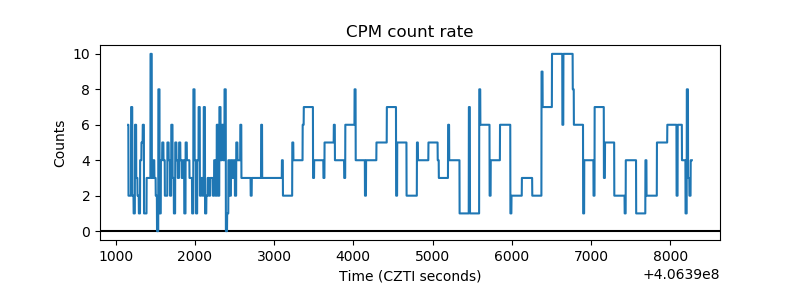 |
| CZT Counter | 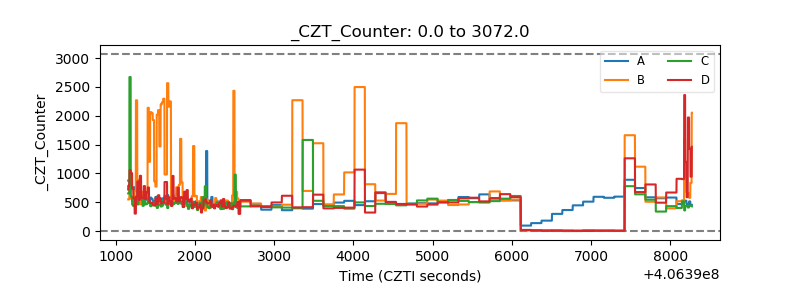 |
| +2.5 Volts monitor | 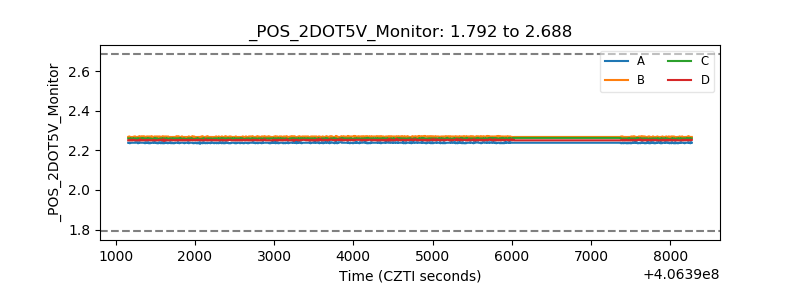 |
| +5 Volts monitor |  |
| _ROLL_ROT | 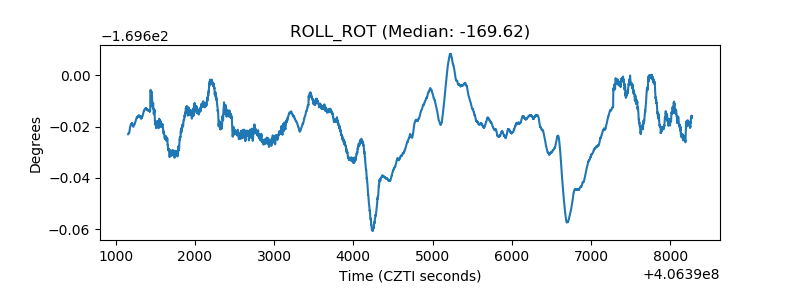 |
| _Roll_DEC | 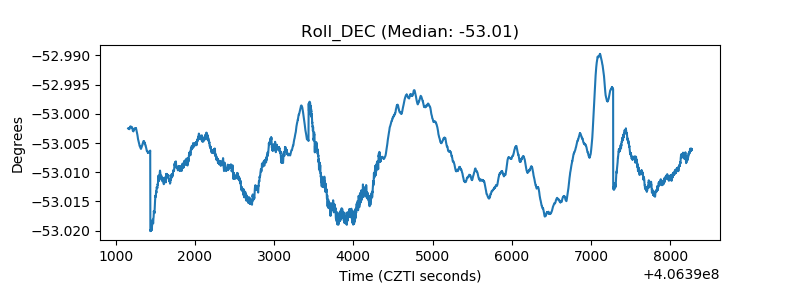 |
| _Roll_RA | 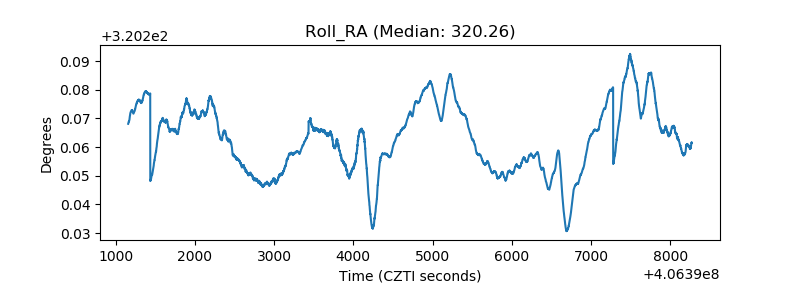 |
| Veto Counter | 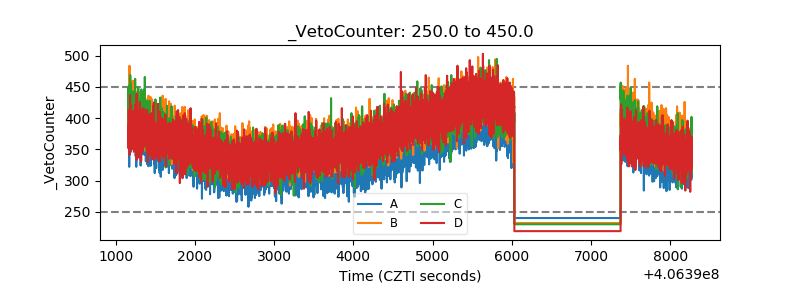 |