| Param | Original file | Final file |
|---|---|---|
| Filename | modeM0/AS1A12_052T04_9000005388_38600cztM0_level2.fits | modeM0/AS1A12_052T04_9000005388_38600cztM0_level2_quad_clean.evt |
| Size (bytes) | 406,313,280 | 81,334,080 |
| Size | 387.5 MB | 77.6 MB |
| Events in quadrant A | 2,549,527 | 556,199 |
| Events in quadrant B | 3,321,953 | 557,691 |
| Events in quadrant C | 2,431,677 | 535,655 |
| Events in quadrant D | 6,354,445 | 466,614 |
| Mode M0 | |||
|---|---|---|---|
| Quadrant | BADHDUFLAG | Total packets | Discarded packets |
| A | 0 | 10617 | 3 |
| B | 0 | 13211 | 2 |
| C | 0 | 10311 | 2 |
| D | 0 | 22327 | 2 |
| Mode SS | |||
|---|---|---|---|
| Quadrant | BADHDUFLAG | Total packets | Discarded packets |
| A | 0 | 102 | 0 |
| B | 0 | 102 | 0 |
| C | 0 | 102 | 0 |
| D | 0 | 102 | 0 |
| Mode M9 | |||
|---|---|---|---|
| Quadrant | BADHDUFLAG | Total packets | Discarded packets |
| A | 0 | 22 | 0 |
| B | 0 | 22 | 0 |
| C | 0 | 22 | 0 |
| D | 0 | 23 | 0 |
| Quadrant | Total seconds | Saturated seconds | Saturation percentage |
|---|---|---|---|
| A | 4932 | 22 | 0.446067% |
| B | 4932 | 165 | 3.345499% |
| C | 4932 | 23 | 0.466342% |
| D | 4932 | 461 | 9.347121% |
Noise dominated data is calculated using 1-second bins in cleaned event files. If a bin has >2000 counts, and if more than 50% of those come from <1% of pixels, then it is considered to be noise-dominated and hence unusable.
| Quadrant | # 1 sec bins | Bins with >0 counts | Bins with >2000 counts | High rate bins dominated by noise | Noise dominated (total time) | Noise dominated (detector-on time) | Marked lightcurve |
|---|---|---|---|---|---|---|---|
| A | 6274 | 4932 | 8 | 8 | 0.13% | 0.16% | 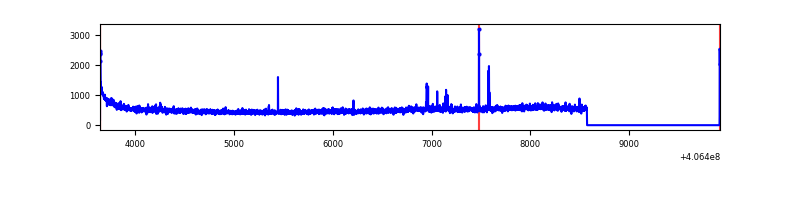 |
| B | 6274 | 4932 | 98 | 98 | 1.56% | 1.99% | 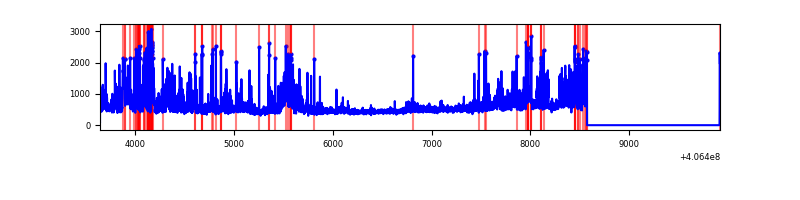 |
| C | 6274 | 4932 | 17 | 17 | 0.27% | 0.34% | 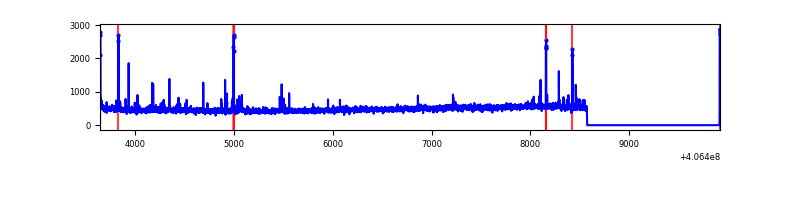 |
| D | 6274 | 4932 | 460 | 460 | 7.33% | 9.33% | 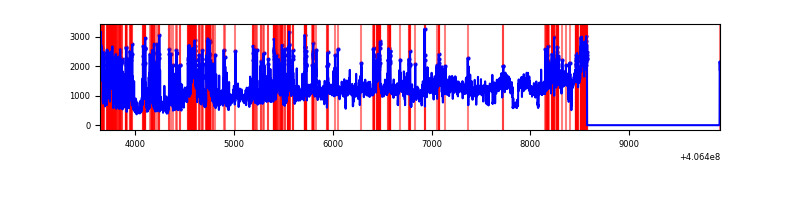 |
Top three noisy pixels from each quadrant. If the there are fewer than three noisy pixels in the level2.evt file, extra rows are filled as -1
| Pixel properties | Quadrant properties | ||||||
|---|---|---|---|---|---|---|---|
| Quadrant | DetID | PixID | Counts | Sigma | Mean | Median | Sigma |
| A | 10 | 83 | 329329 | 2870.22 | 555 | 544 | 114.6 |
| A | 13 | 248 | 40422 | 348.13 | 555 | 544 | 114.6 |
| A | 13 | 6 | 19608 | 166.42 | 555 | 544 | 114.6 |
| B | 0 | 183 | 350411 | 3294.72 | 548 | 533 | 106.2 |
| B | 4 | 251 | 209130 | 1964.31 | 548 | 533 | 106.2 |
| B | 0 | 190 | 152505 | 1431.08 | 548 | 533 | 106.2 |
| C | 15 | 214 | 196913 | 1541.47 | 541 | 542 | 127.4 |
| C | 14 | 254 | 45057 | 349.43 | 541 | 542 | 127.4 |
| C | 15 | 159 | 33578 | 259.33 | 541 | 542 | 127.4 |
| D | 1 | 20 | 2350109 | 18143.62 | 522 | 507 | 129.5 |
| D | 1 | 47 | 658056 | 5077.59 | 522 | 507 | 129.5 |
| D | 12 | 235 | 630978 | 4868.5 | 522 | 507 | 129.5 |
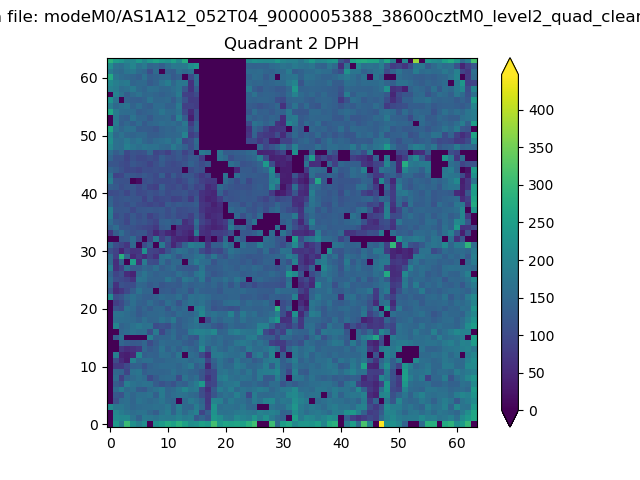
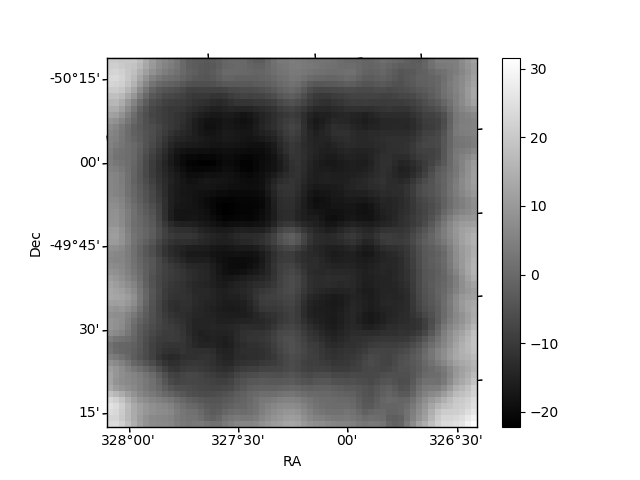
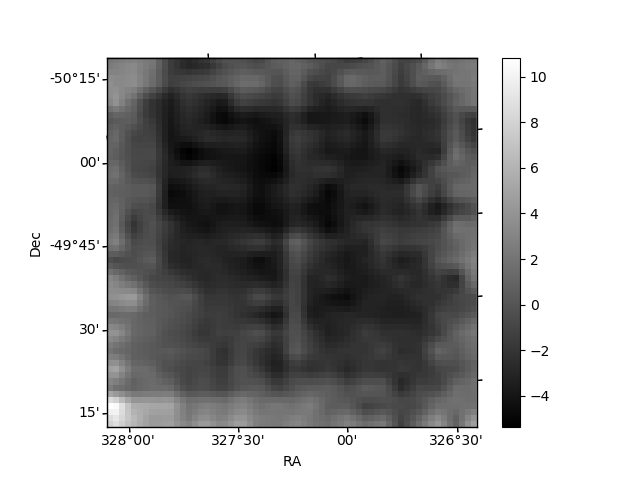
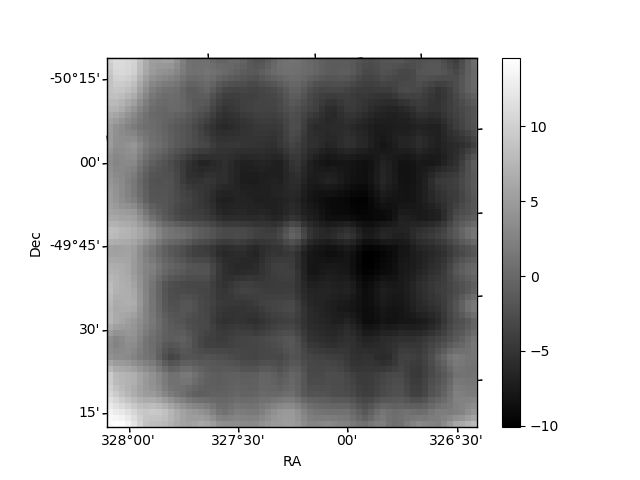
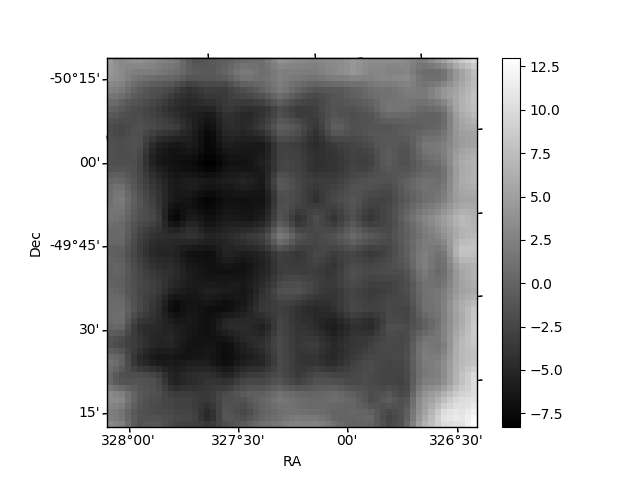
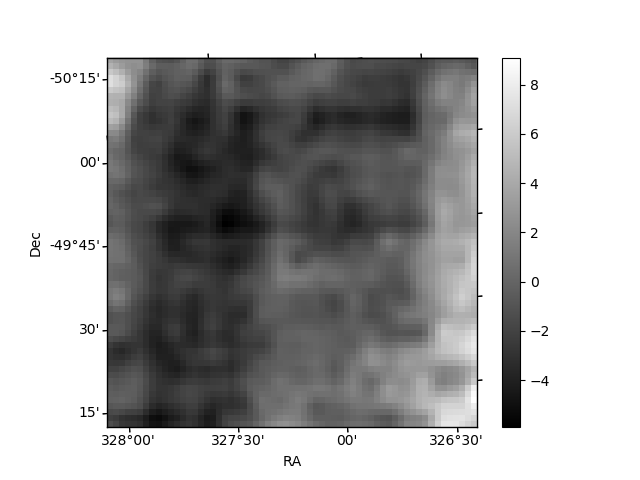
Histogram calculated using DETX and DETY for each event in the final _common_clean file
| Quadrant A | 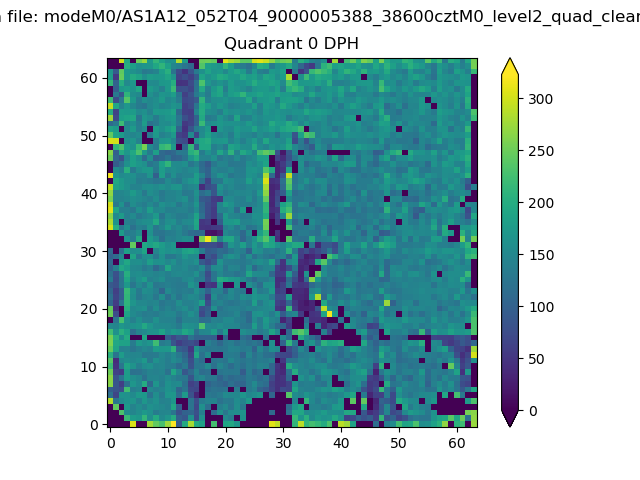 |
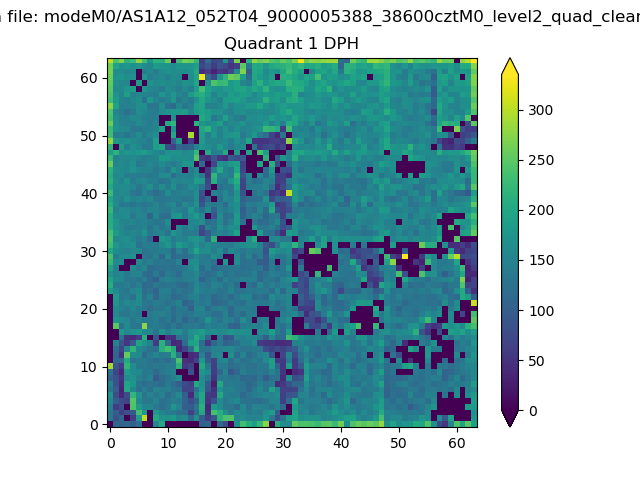 |
Quadrant B |
|---|---|---|---|
| Quadrant D | 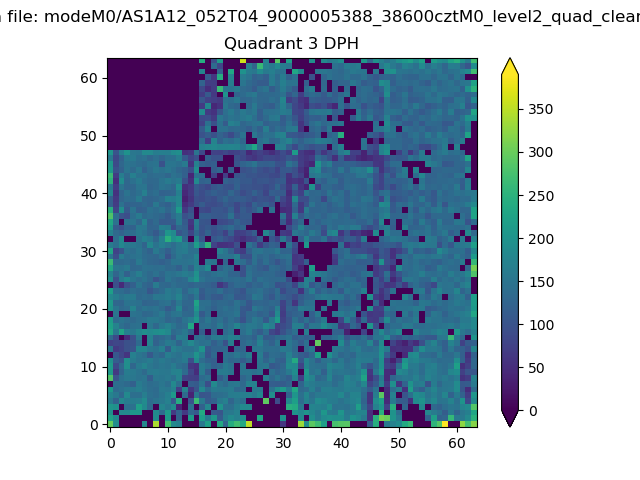 |
 |
Quadrant C |
| Plot type | Count rate plots | Images |
|---|---|---|
| Comparison with Poisson distribution Blue bars denote a histogram of data divided into 1 sec bins. Red curve is a Poisson curve with rate = median count rate of data. |
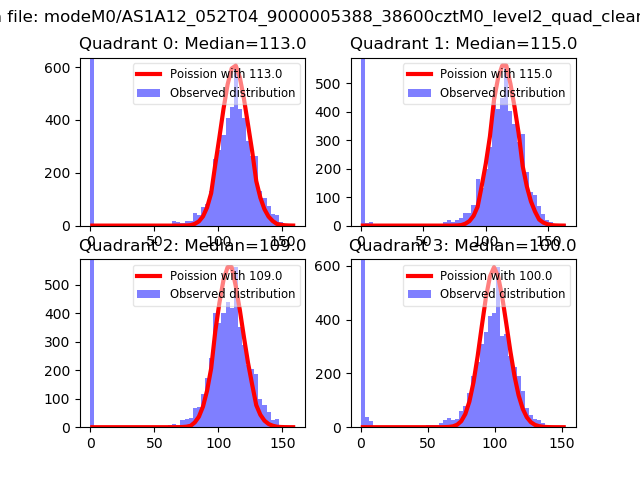 |
 |
| Quadrant-wise count rates Data is divided into 100 sec bins |
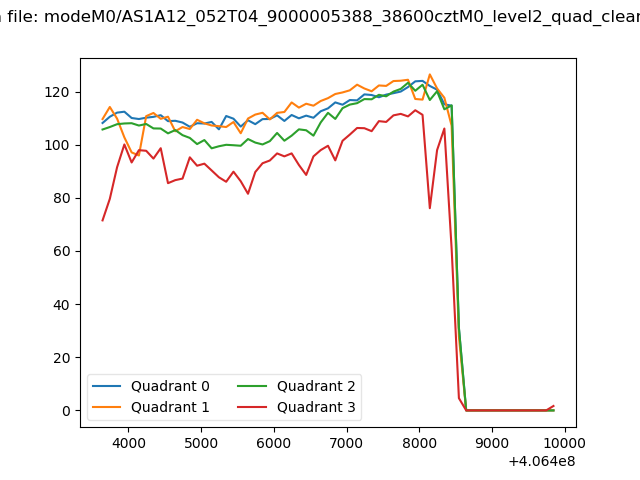 |
|
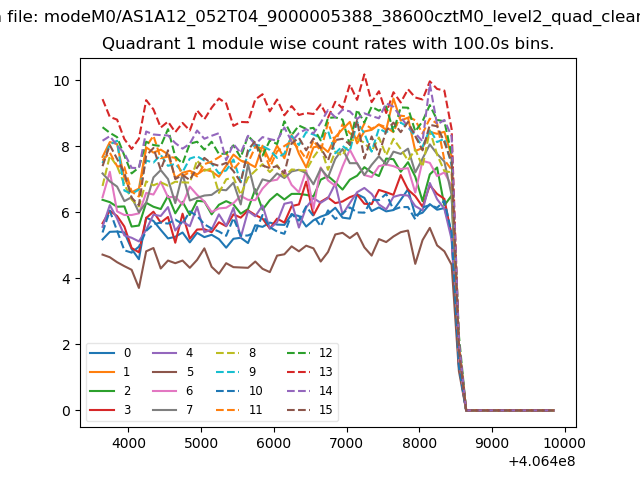
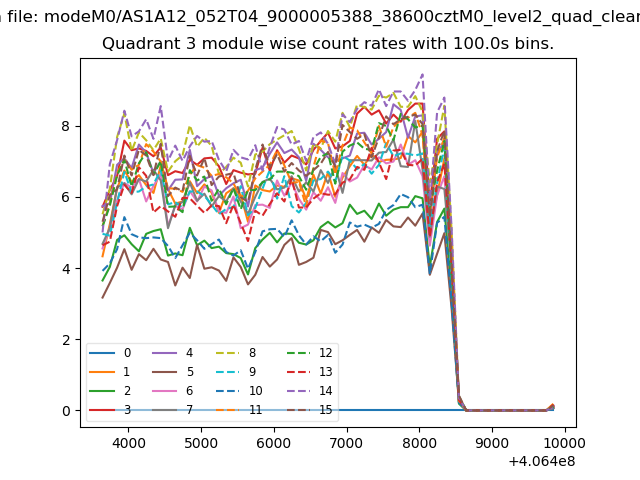
| Module-wise count rates for Quadrant A Data is divided into 100 sec bins |
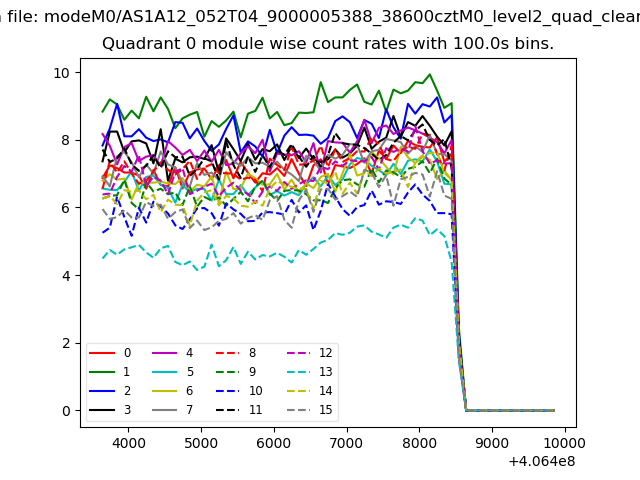 |
 |
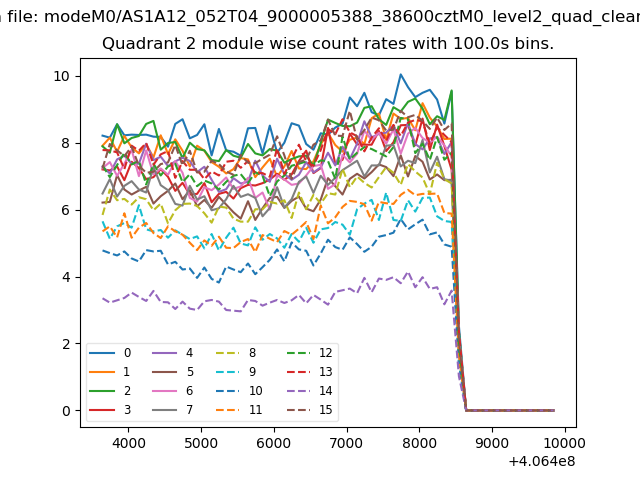
| Module-wise count rates for Quadrant B Data is divided into 100 sec bins |
 |
 |
| Module-wise count rates for Quadrant C Data is divided into 100 sec bins |
 |
 |
| Module-wise count rates for Quadrant D Data is divided into 100 sec bins |
 |
 |
| Parameter | Plot |
|---|---|
| CZT HV Monitor | 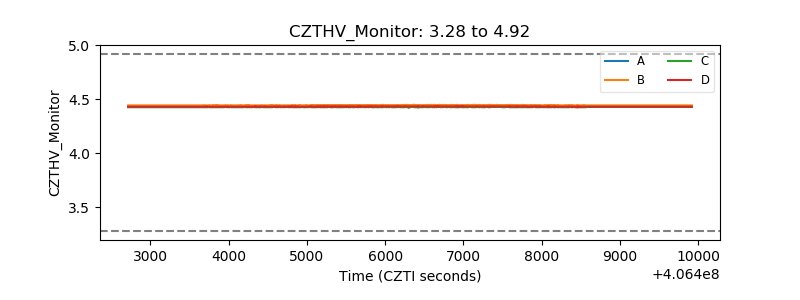 |
| D_VDD | 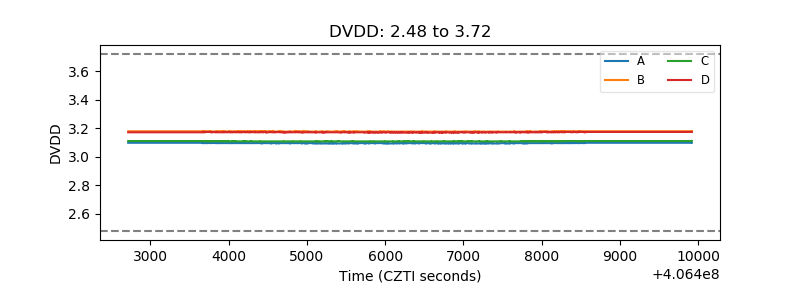 |
| Temperature 1 | 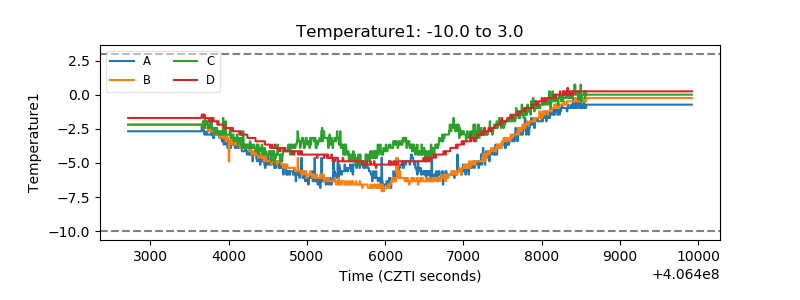 |
| Veto HV Monitor |  |
| Veto LLD | 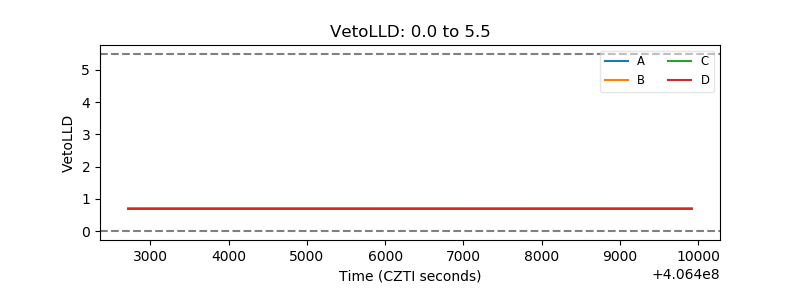 |
| Alpha Counter | 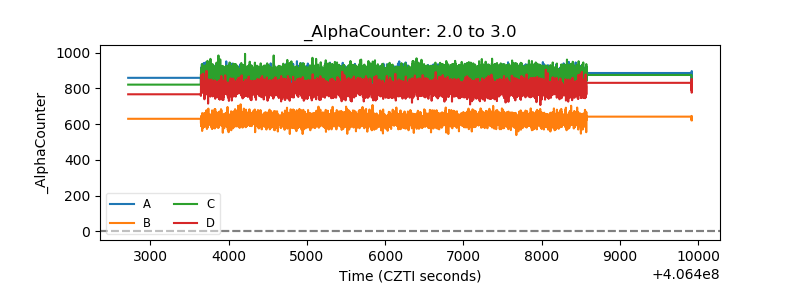 |
| _CPM_Rate | 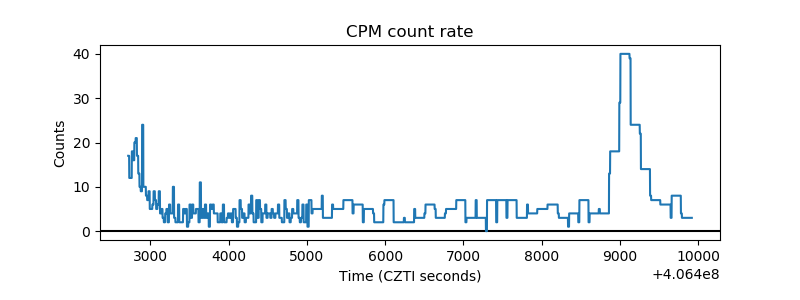 |
| CZT Counter | 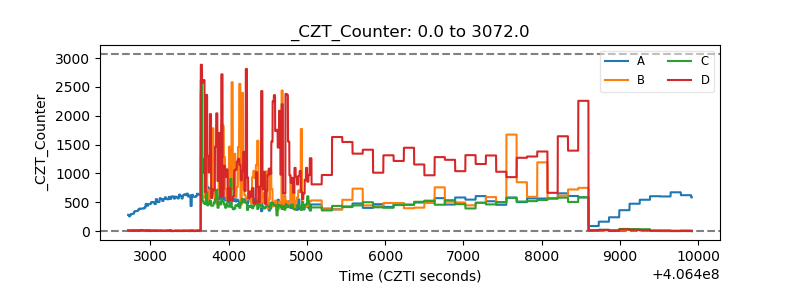 |
| +2.5 Volts monitor | 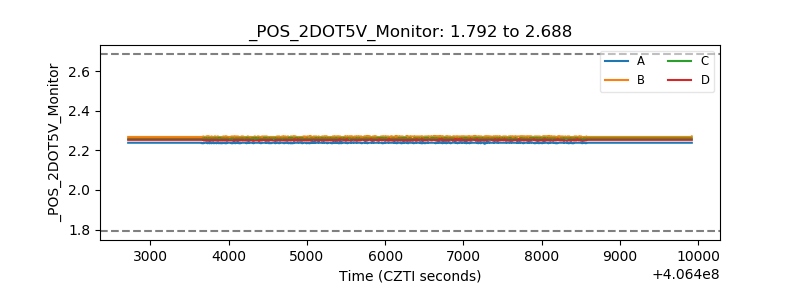 |
| +5 Volts monitor |  |
| _ROLL_ROT | 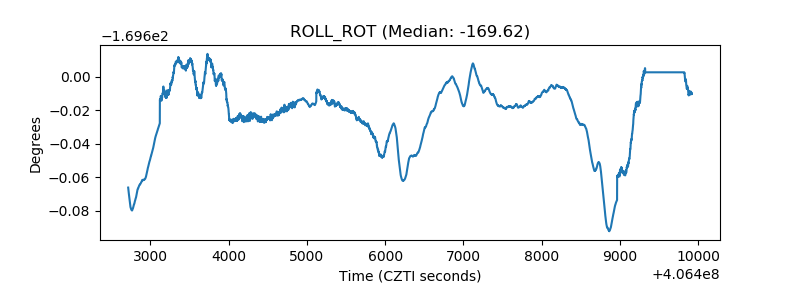 |
| _Roll_DEC | 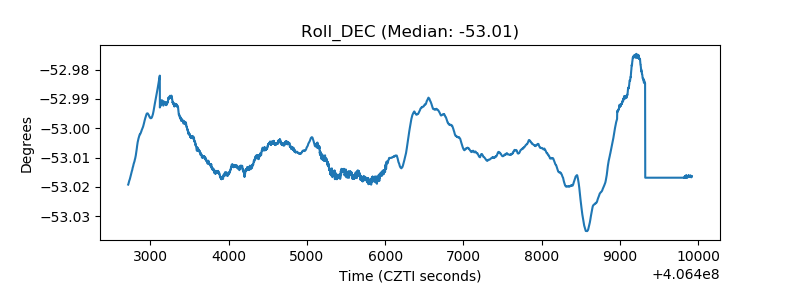 |
| _Roll_RA | 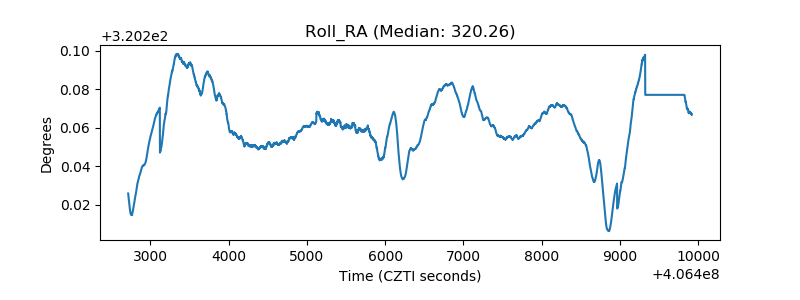 |
| Veto Counter | 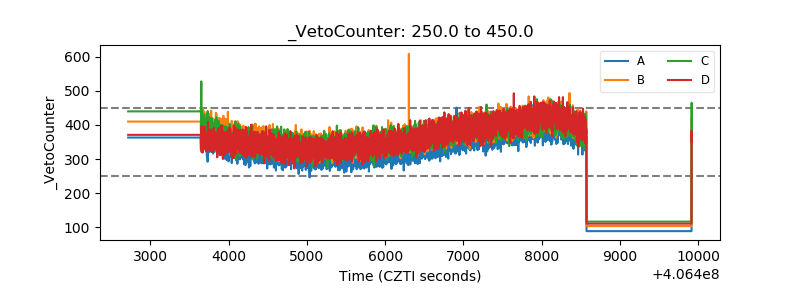 |