| Param | Original file | Final file |
|---|---|---|
| Filename | modeM0/AS1A12_052T04_9000005388_38601cztM0_level2.fits | modeM0/AS1A12_052T04_9000005388_38601cztM0_level2_quad_clean.evt |
| Size (bytes) | 668,640,960 | 172,638,720 |
| Size | 637.7 MB | 164.6 MB |
| Events in quadrant A | 5,480,353 | 1,176,734 |
| Events in quadrant B | 6,841,190 | 1,158,617 |
| Events in quadrant C | 5,176,468 | 1,137,014 |
| Events in quadrant D | 6,432,596 | 1,022,739 |
| Mode M0 | |||
|---|---|---|---|
| Quadrant | BADHDUFLAG | Total packets | Discarded packets |
| A | 0 | 22724 | 3 |
| B | 0 | 27402 | 2 |
| C | 0 | 21919 | 2 |
| D | 0 | 26594 | 2 |
| Mode SS | |||
|---|---|---|---|
| Quadrant | BADHDUFLAG | Total packets | Discarded packets |
| A | 0 | 214 | 0 |
| B | 0 | 214 | 0 |
| C | 0 | 214 | 0 |
| D | 0 | 214 | 0 |
| Mode M9 | |||
|---|---|---|---|
| Quadrant | BADHDUFLAG | Total packets | Discarded packets |
| A | 0 | 30 | 0 |
| B | 0 | 30 | 0 |
| C | 0 | 30 | 0 |
| D | 0 | 30 | 0 |
| Quadrant | Total seconds | Saturated seconds | Saturation percentage |
|---|---|---|---|
| A | 10575 | 27 | 0.255319% |
| B | 10575 | 475 | 4.491726% |
| C | 10575 | 22 | 0.208038% |
| D | 10575 | 365 | 3.451537% |
Noise dominated data is calculated using 1-second bins in cleaned event files. If a bin has >2000 counts, and if more than 50% of those come from <1% of pixels, then it is considered to be noise-dominated and hence unusable.
| Quadrant | # 1 sec bins | Bins with >0 counts | Bins with >2000 counts | High rate bins dominated by noise | Noise dominated (total time) | Noise dominated (detector-on time) | Marked lightcurve |
|---|---|---|---|---|---|---|---|
| A | 13559 | 10577 | 17 | 17 | 0.13% | 0.16% | 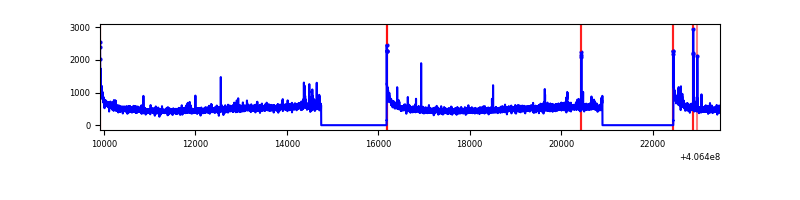 |
| B | 13559 | 10577 | 332 | 332 | 2.45% | 3.14% | 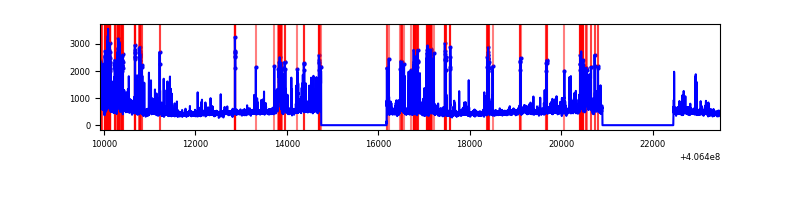 |
| C | 13559 | 10577 | 22 | 22 | 0.16% | 0.21% | 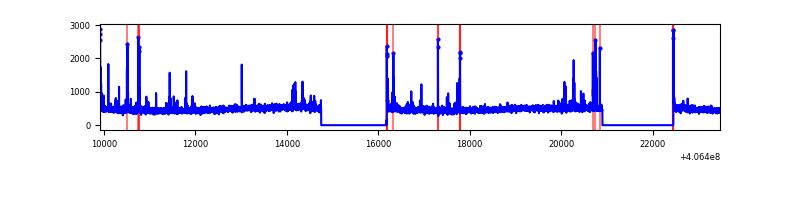 |
| D | 13559 | 10577 | 357 | 357 | 2.63% | 3.38% | 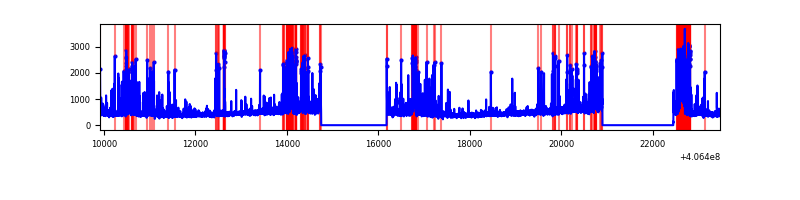 |
Top three noisy pixels from each quadrant. If the there are fewer than three noisy pixels in the level2.evt file, extra rows are filled as -1
| Pixel properties | Quadrant properties | ||||||
|---|---|---|---|---|---|---|---|
| Quadrant | DetID | PixID | Counts | Sigma | Mean | Median | Sigma |
| A | 10 | 83 | 747877 | 3104.38 | 1185 | 1161 | 240.5 |
| A | 13 | 6 | 34830 | 139.97 | 1185 | 1161 | 240.5 |
| A | 12 | 189 | 34139 | 137.1 | 1185 | 1161 | 240.5 |
| B | 0 | 183 | 565751 | 2497.26 | 1166 | 1135 | 226.1 |
| B | 5 | 200 | 480262 | 2119.15 | 1166 | 1135 | 226.1 |
| B | 5 | 184 | 367883 | 1622.1 | 1166 | 1135 | 226.1 |
| C | 15 | 214 | 431026 | 1595.42 | 1155 | 1160 | 269.4 |
| C | 14 | 254 | 121698 | 447.37 | 1155 | 1160 | 269.4 |
| C | 15 | 159 | 57342 | 208.51 | 1155 | 1160 | 269.4 |
| D | 1 | 47 | 483874 | 1750.08 | 1137 | 1103 | 275.9 |
| D | 12 | 227 | 383643 | 1386.73 | 1137 | 1103 | 275.9 |
| D | 10 | 253 | 248780 | 897.84 | 1137 | 1103 | 275.9 |
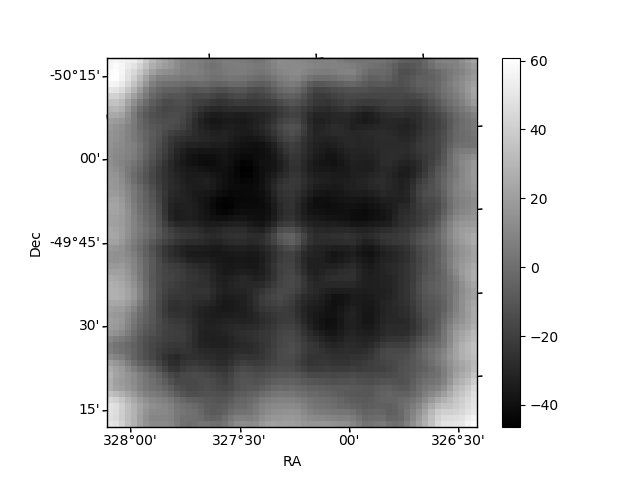
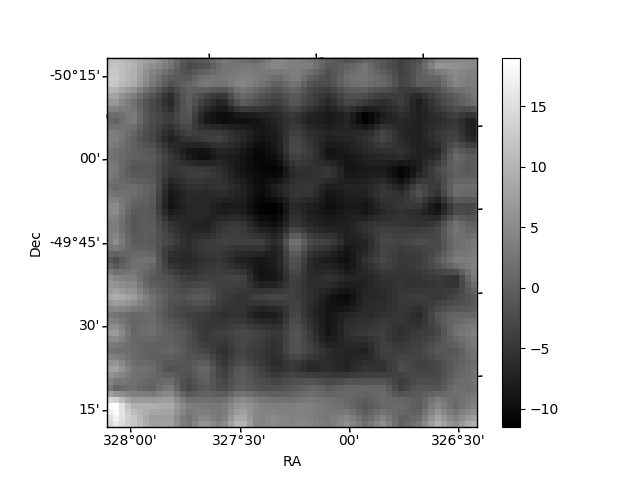
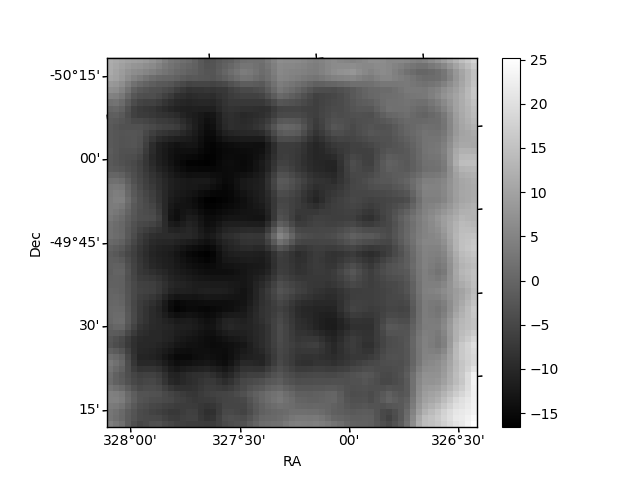
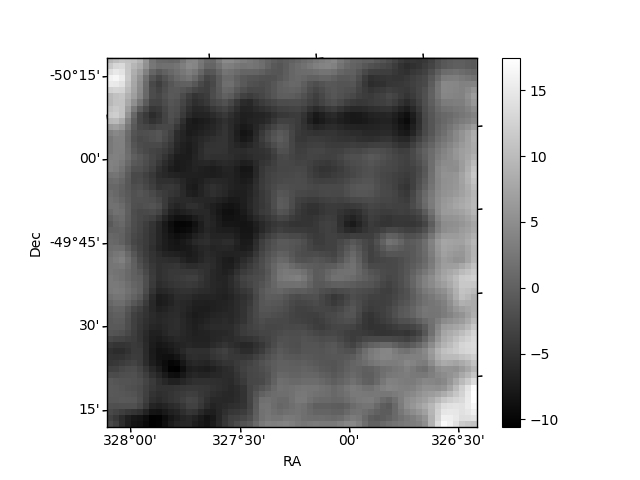
Histogram calculated using DETX and DETY for each event in the final _common_clean file
| Quadrant A | 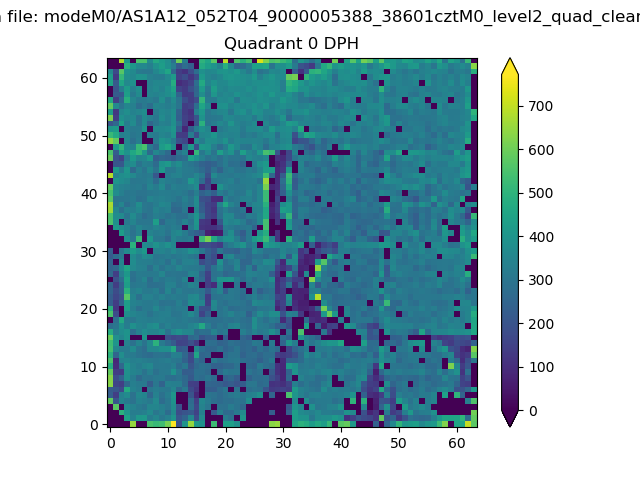 |
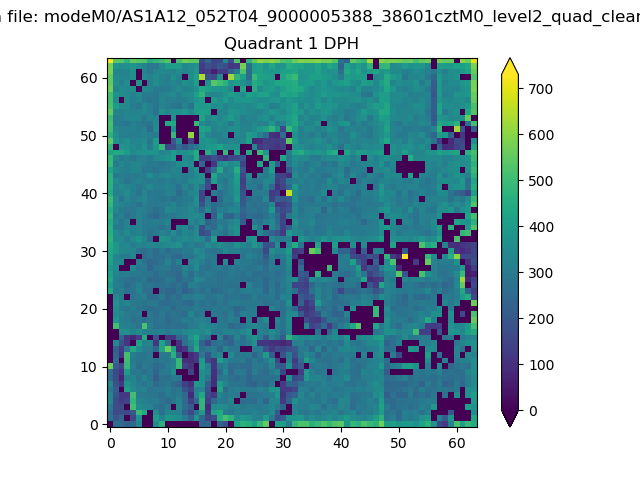 |
Quadrant B |
|---|---|---|---|
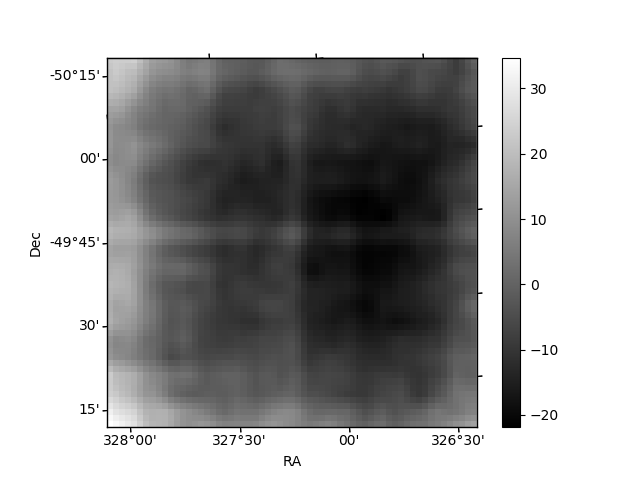
| Quadrant D | 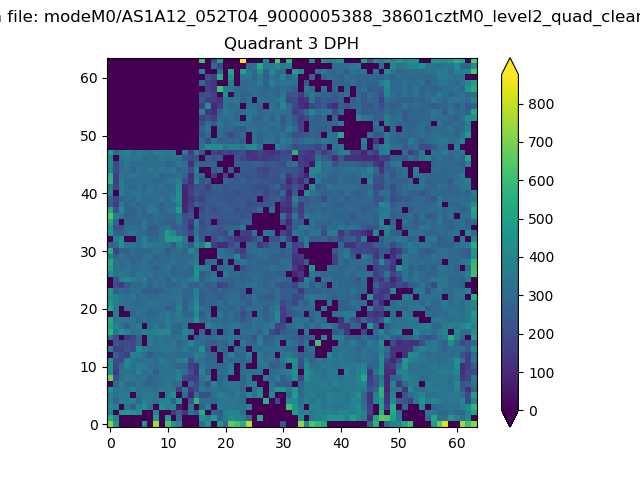 |
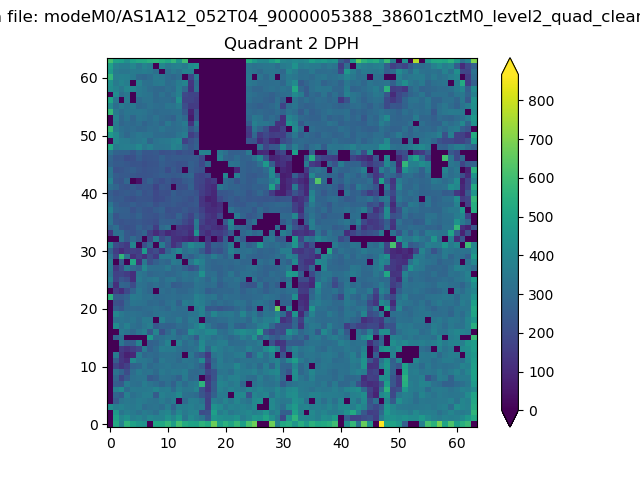 |
Quadrant C |
| Plot type | Count rate plots | Images |
|---|---|---|
| Comparison with Poisson distribution Blue bars denote a histogram of data divided into 1 sec bins. Red curve is a Poisson curve with rate = median count rate of data. |
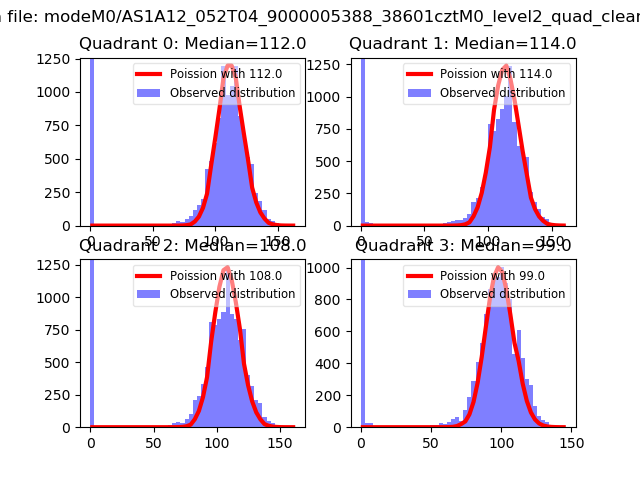 |
 |
| Quadrant-wise count rates Data is divided into 100 sec bins |
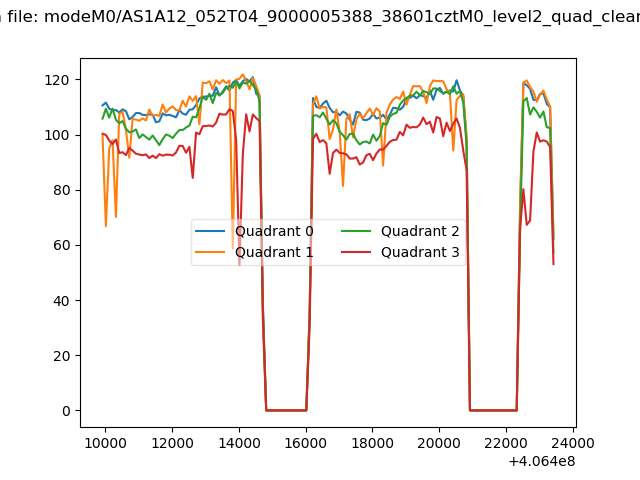 |
|
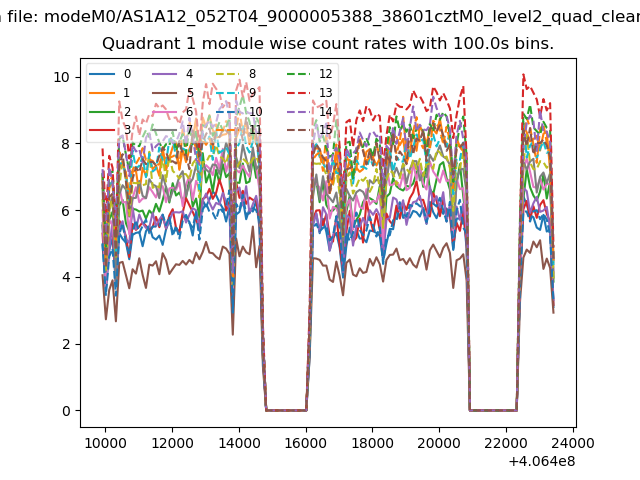
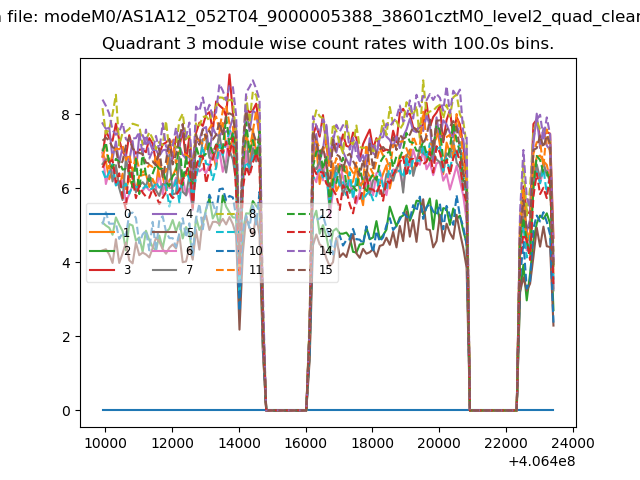
| Module-wise count rates for Quadrant A Data is divided into 100 sec bins |
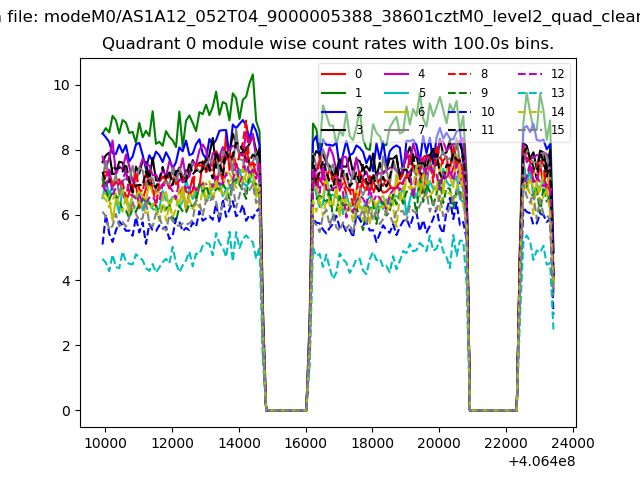 |
 |
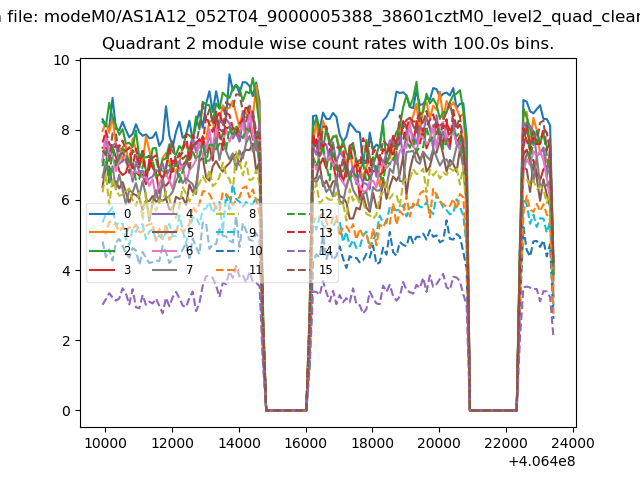
| Module-wise count rates for Quadrant B Data is divided into 100 sec bins |
 |
 |
| Module-wise count rates for Quadrant C Data is divided into 100 sec bins |
 |
 |
| Module-wise count rates for Quadrant D Data is divided into 100 sec bins |
 |
 |
| Parameter | Plot |
|---|---|
| CZT HV Monitor | 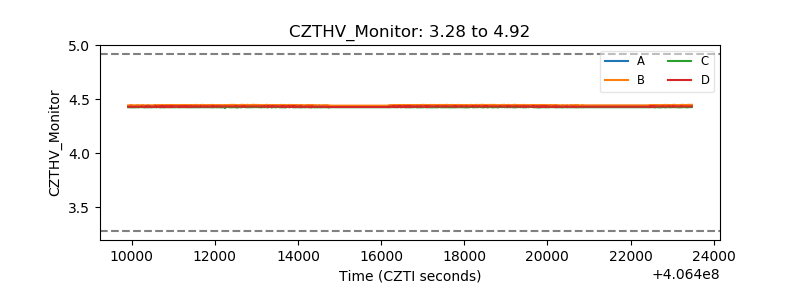 |
| D_VDD | 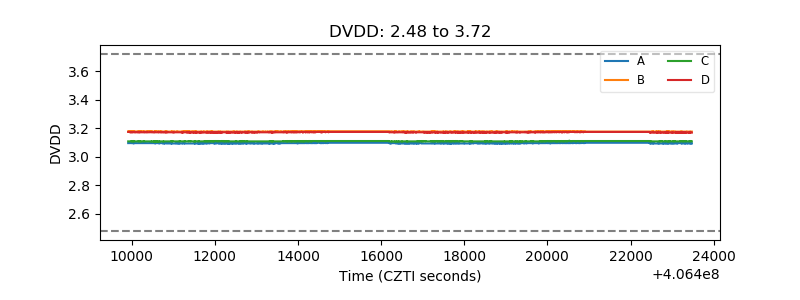 |
| Temperature 1 | 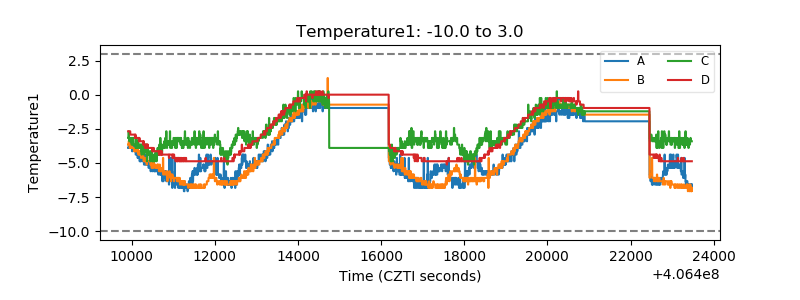 |
| Veto HV Monitor | 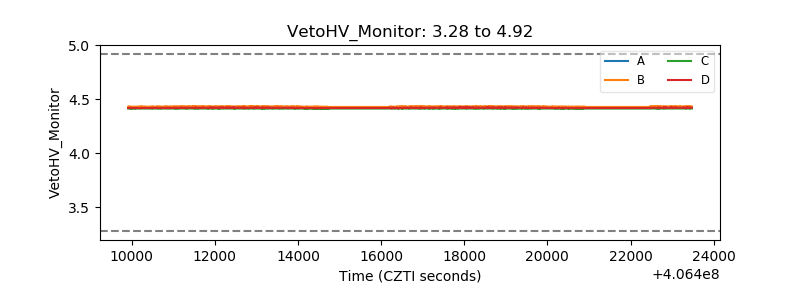 |
| Veto LLD | 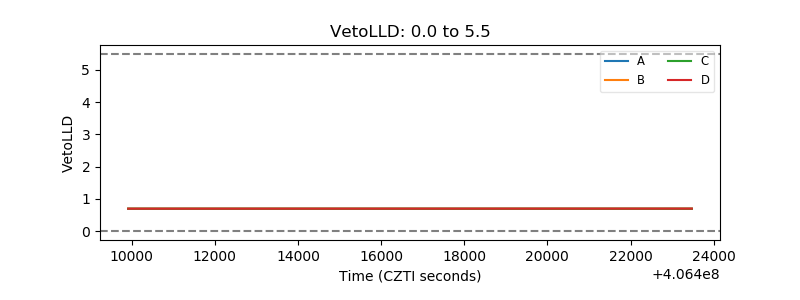 |
| Alpha Counter | 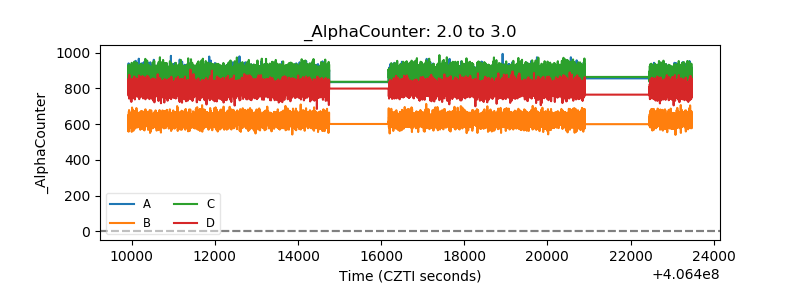 |
| _CPM_Rate | 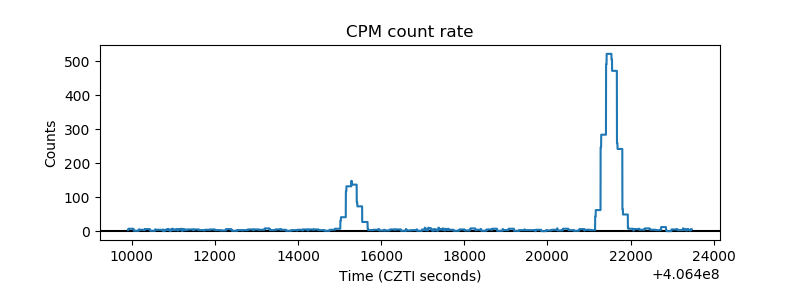 |
| CZT Counter | 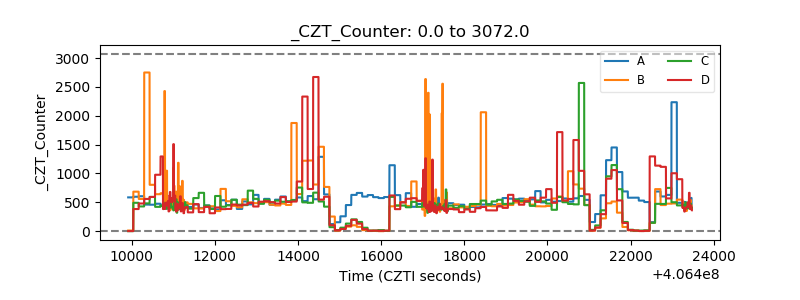 |
| +2.5 Volts monitor | 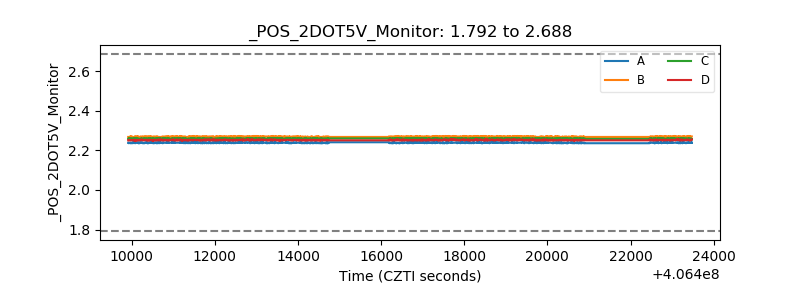 |
| +5 Volts monitor | 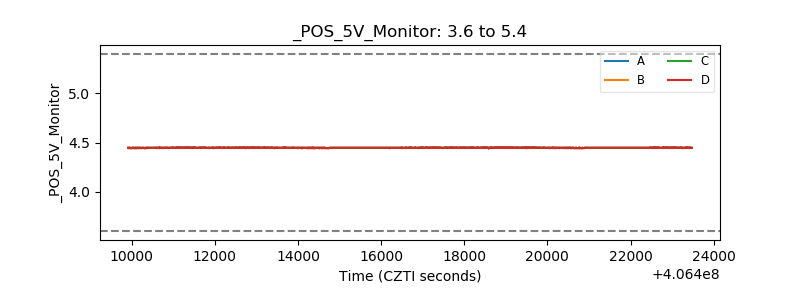 |
| _ROLL_ROT | 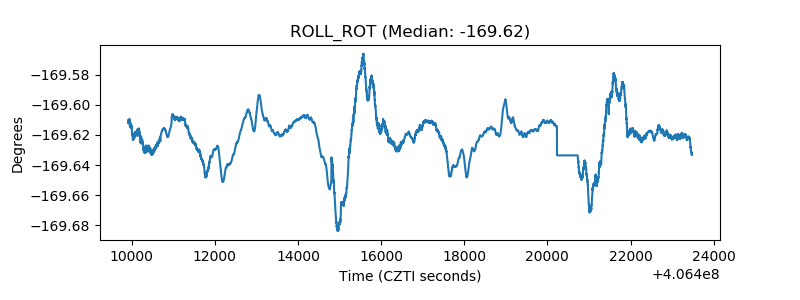 |
| _Roll_DEC | 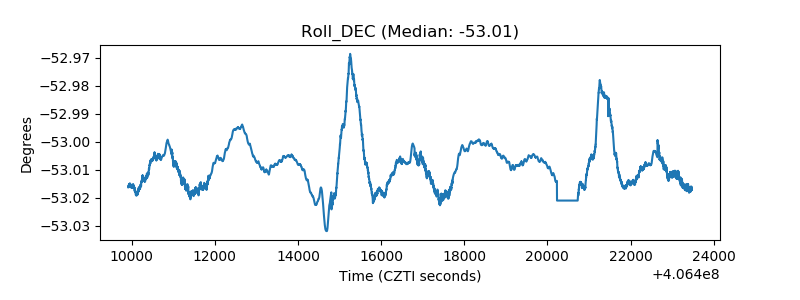 |
| _Roll_RA | 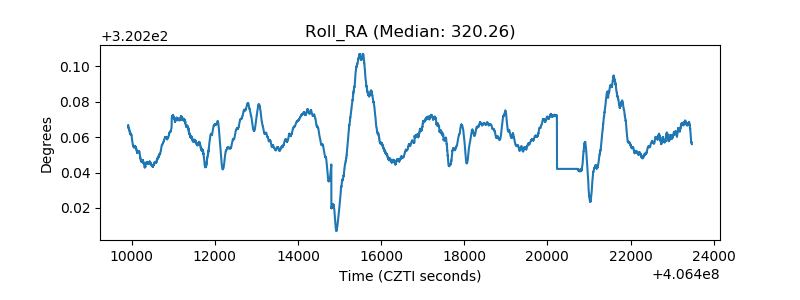 |
| Veto Counter | 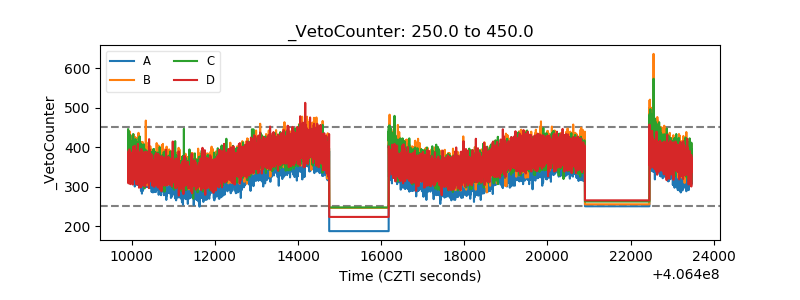 |