| Param | Original file | Final file |
|---|---|---|
| Filename | modeM0/AS1A12_052T04_9000005388_38602cztM0_level2.fits | modeM0/AS1A12_052T04_9000005388_38602cztM0_level2_quad_clean.evt |
| Size (bytes) | 352,889,280 | 98,314,560 |
| Size | 336.5 MB | 93.8 MB |
| Events in quadrant A | 3,148,725 | 665,594 |
| Events in quadrant B | 3,145,106 | 682,120 |
| Events in quadrant C | 2,833,525 | 644,956 |
| Events in quadrant D | 3,484,513 | 580,005 |
| Mode M0 | |||
|---|---|---|---|
| Quadrant | BADHDUFLAG | Total packets | Discarded packets |
| A | 0 | 12830 | 3 |
| B | 0 | 13078 | 2 |
| C | 0 | 11888 | 2 |
| D | 0 | 14322 | 2 |
| Mode SS | |||
|---|---|---|---|
| Quadrant | BADHDUFLAG | Total packets | Discarded packets |
| A | 0 | 118 | 0 |
| B | 0 | 118 | 0 |
| C | 0 | 118 | 0 |
| D | 0 | 118 | 0 |
| Mode M9 | |||
|---|---|---|---|
| Quadrant | BADHDUFLAG | Total packets | Discarded packets |
| A | 0 | 33 | 0 |
| B | 0 | 33 | 0 |
| C | 0 | 33 | 0 |
| D | 0 | 33 | 0 |
| Quadrant | Total seconds | Saturated seconds | Saturation percentage |
|---|---|---|---|
| A | 5790 | 23 | 0.397237% |
| B | 5790 | 46 | 0.794473% |
| C | 5790 | 16 | 0.276339% |
| D | 5790 | 209 | 3.609672% |
Noise dominated data is calculated using 1-second bins in cleaned event files. If a bin has >2000 counts, and if more than 50% of those come from <1% of pixels, then it is considered to be noise-dominated and hence unusable.
| Quadrant | # 1 sec bins | Bins with >0 counts | Bins with >2000 counts | High rate bins dominated by noise | Noise dominated (total time) | Noise dominated (detector-on time) | Marked lightcurve |
|---|---|---|---|---|---|---|---|
| A | 9015 | 5792 | 16 | 16 | 0.18% | 0.28% | 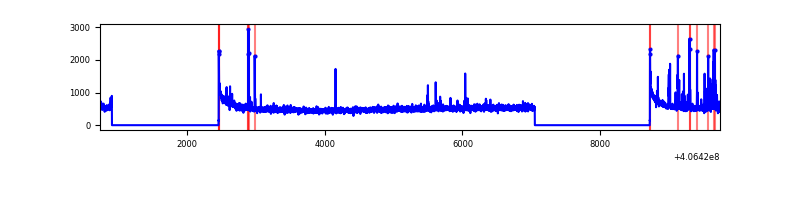 |
| B | 9015 | 5792 | 19 | 19 | 0.21% | 0.33% | 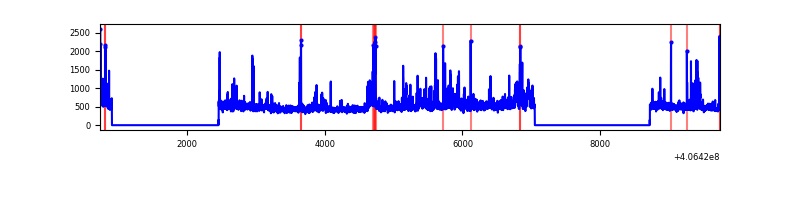 |
| C | 9015 | 5792 | 10 | 10 | 0.11% | 0.17% | 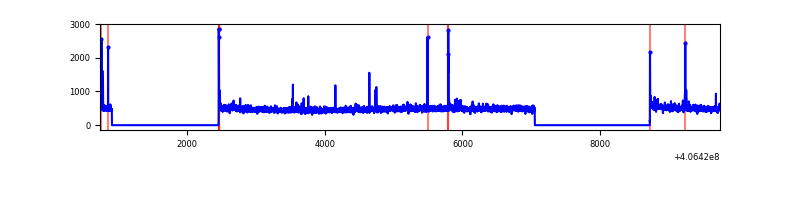 |
| D | 9015 | 5792 | 202 | 202 | 2.24% | 3.49% | 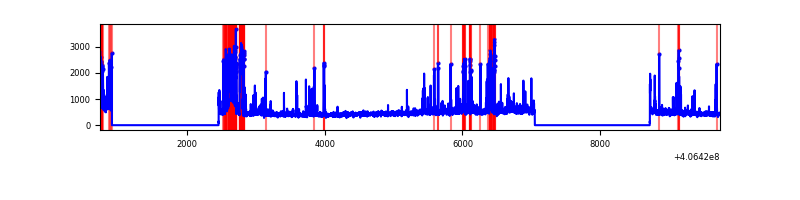 |
Top three noisy pixels from each quadrant. If the there are fewer than three noisy pixels in the level2.evt file, extra rows are filled as -1
| Pixel properties | Quadrant properties | ||||||
|---|---|---|---|---|---|---|---|
| Quadrant | DetID | PixID | Counts | Sigma | Mean | Median | Sigma |
| A | 10 | 83 | 429437 | 3242.74 | 655 | 641 | 132.2 |
| A | 13 | 248 | 138993 | 1046.28 | 655 | 641 | 132.2 |
| A | 13 | 6 | 19396 | 141.83 | 655 | 641 | 132.2 |
| B | 0 | 183 | 195382 | 1544.81 | 655 | 639 | 126.1 |
| B | 5 | 200 | 148877 | 1175.91 | 655 | 639 | 126.1 |
| B | 5 | 172 | 52182 | 408.87 | 655 | 639 | 126.1 |
| C | 15 | 214 | 238150 | 1588.77 | 642 | 645 | 149.5 |
| C | 14 | 254 | 34085 | 223.69 | 642 | 645 | 149.5 |
| C | 1 | 23 | 22976 | 149.38 | 642 | 645 | 149.5 |
| D | 12 | 227 | 206987 | 1347.68 | 631 | 613 | 153.1 |
| D | 13 | 249 | 201400 | 1311.2 | 631 | 613 | 153.1 |
| D | 1 | 47 | 153880 | 1000.88 | 631 | 613 | 153.1 |
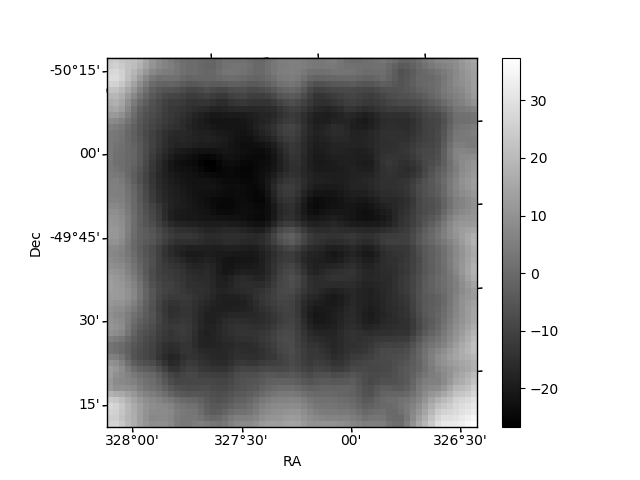
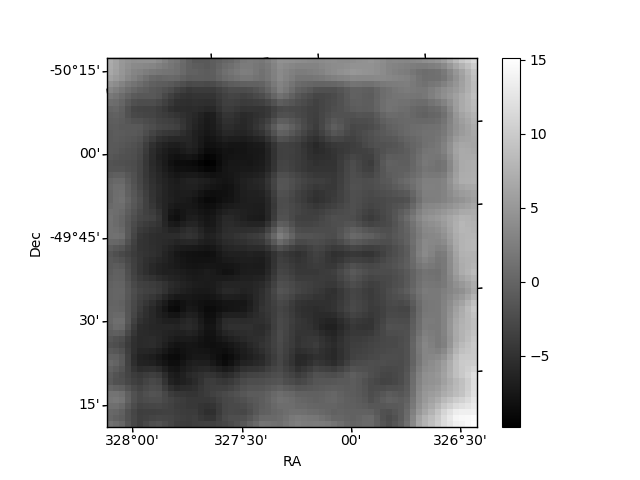
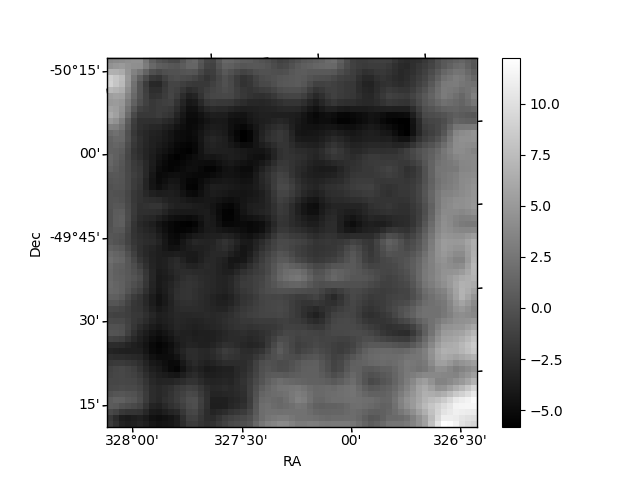
Histogram calculated using DETX and DETY for each event in the final _common_clean file
| Quadrant A | 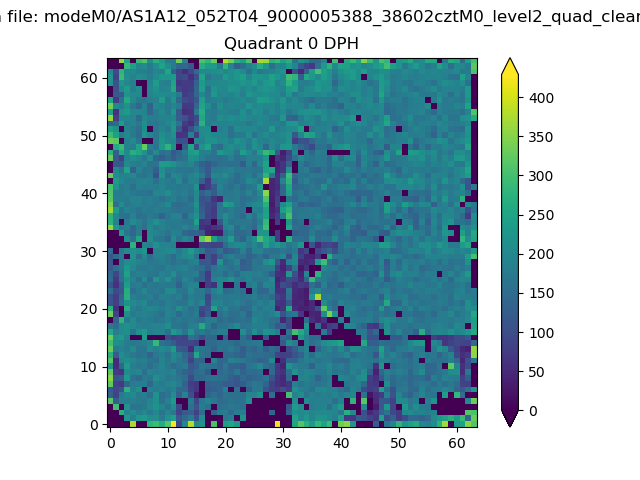 |
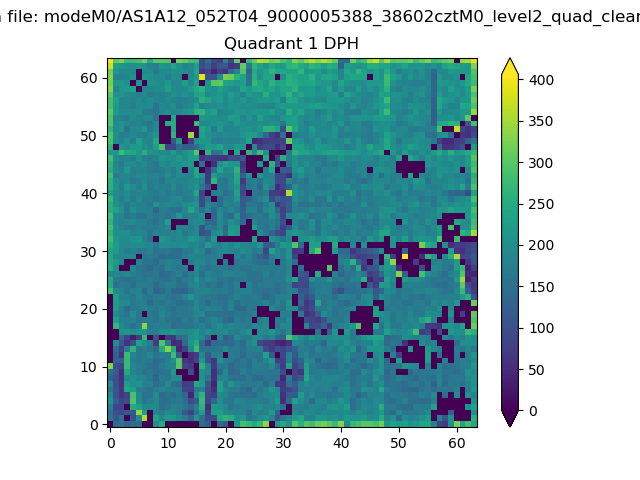 |
Quadrant B |
|---|---|---|---|
| Quadrant D | 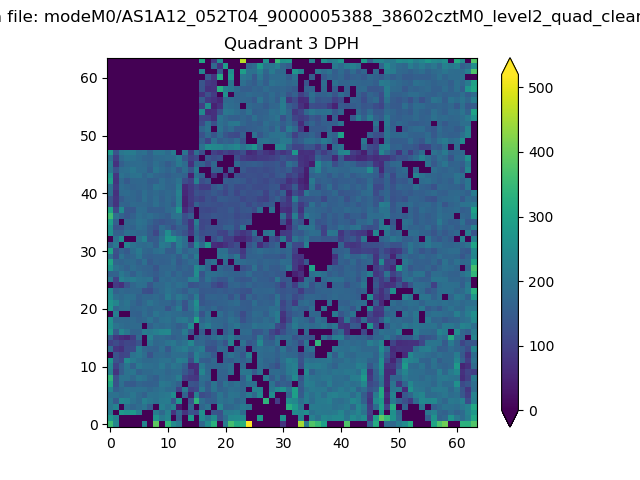 |
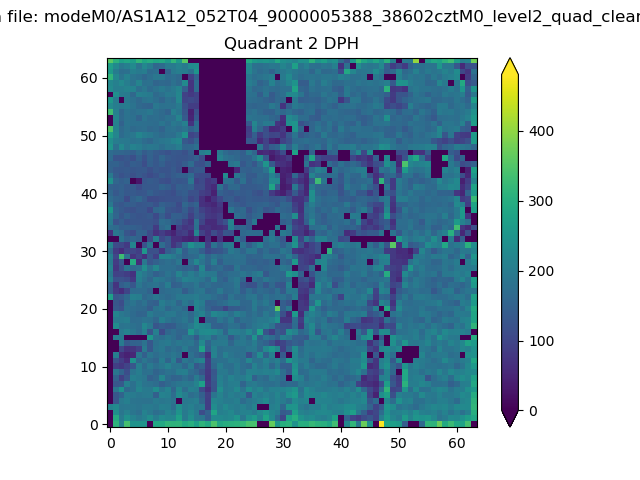 |
Quadrant C |
| Plot type | Count rate plots | Images |
|---|---|---|
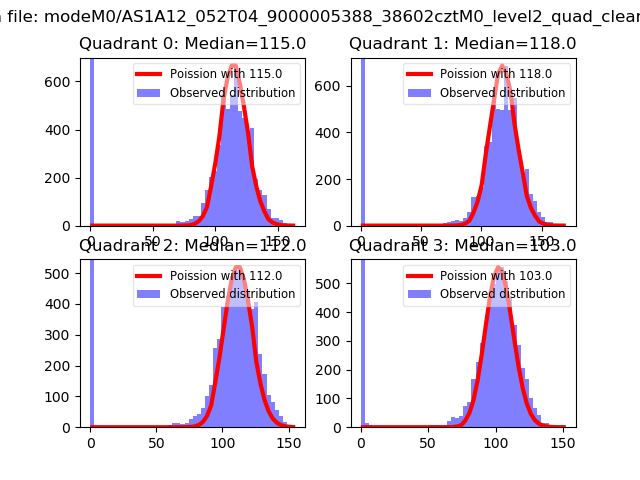
| Comparison with Poisson distribution Blue bars denote a histogram of data divided into 1 sec bins. Red curve is a Poisson curve with rate = median count rate of data. |
 |
 |
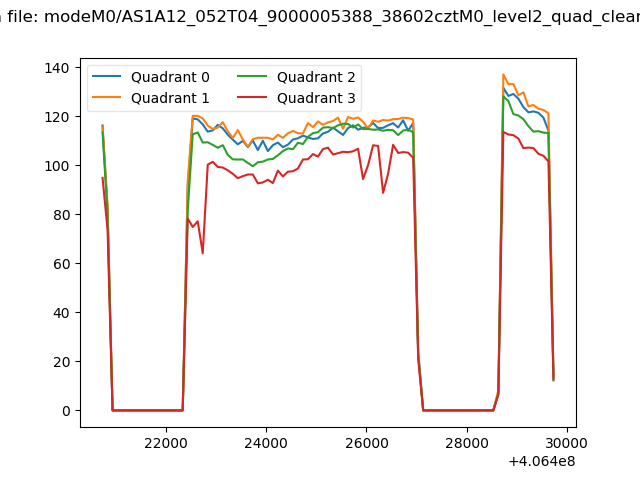
| Quadrant-wise count rates Data is divided into 100 sec bins |
 |
|
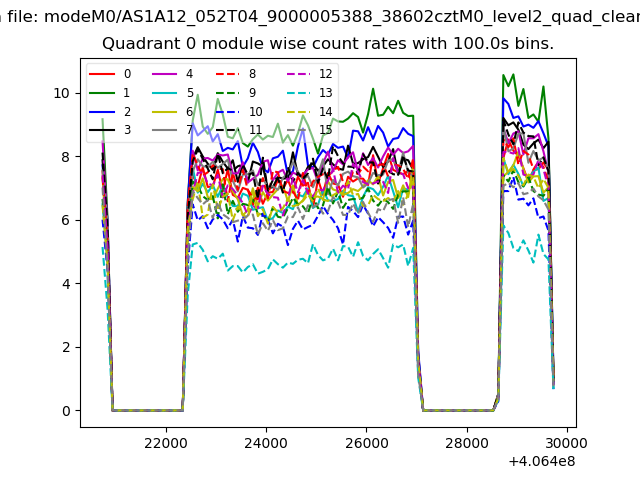
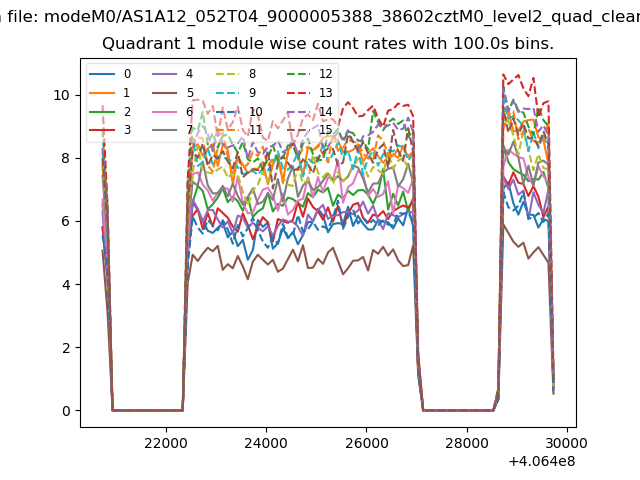
| Module-wise count rates for Quadrant A Data is divided into 100 sec bins |
 |
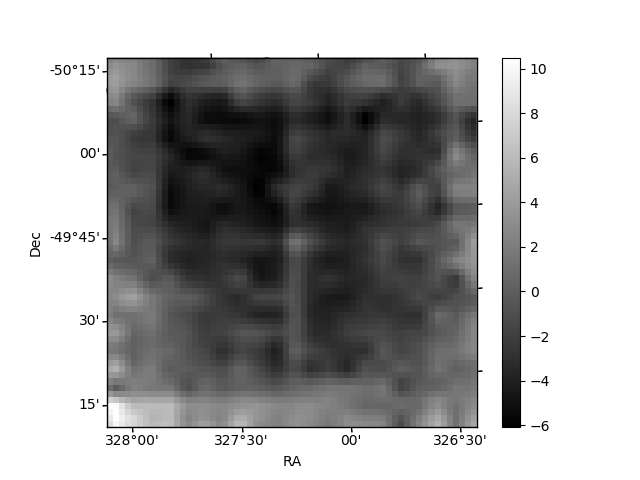 |
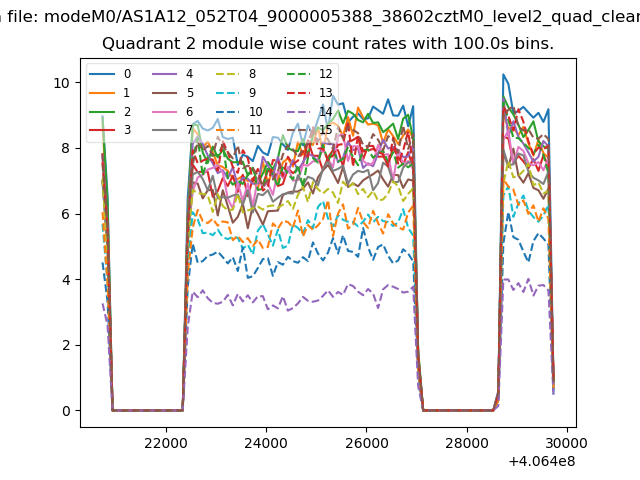
| Module-wise count rates for Quadrant B Data is divided into 100 sec bins |
 |
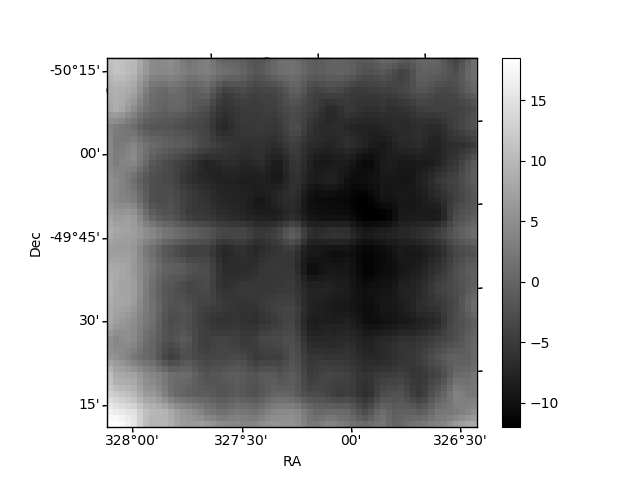 |
| Module-wise count rates for Quadrant C Data is divided into 100 sec bins |
 |
 |
| Module-wise count rates for Quadrant D Data is divided into 100 sec bins |
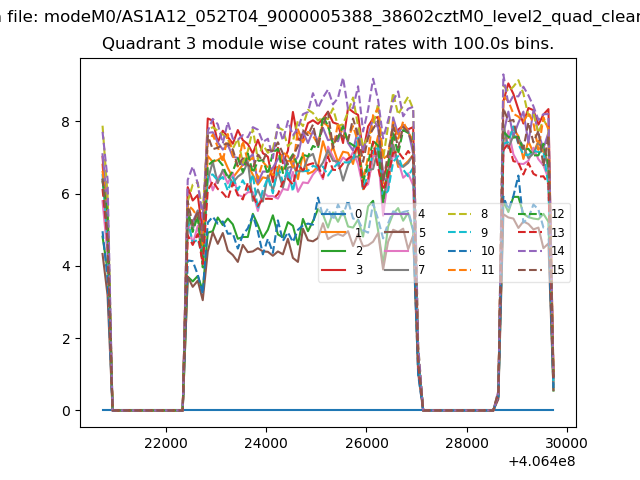 |
 |
| Parameter | Plot |
|---|---|
| CZT HV Monitor | 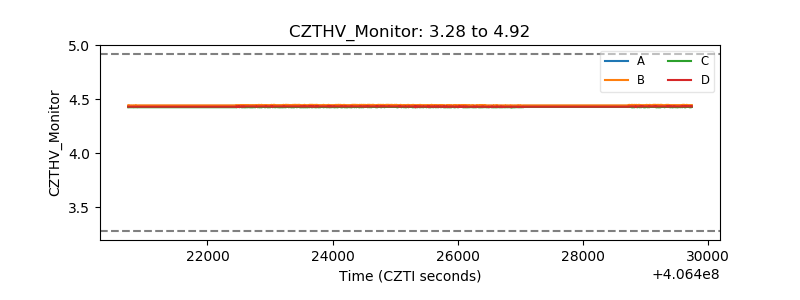 |
| D_VDD | 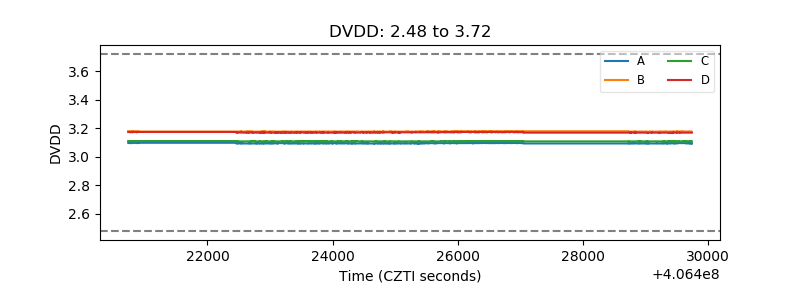 |
| Temperature 1 | 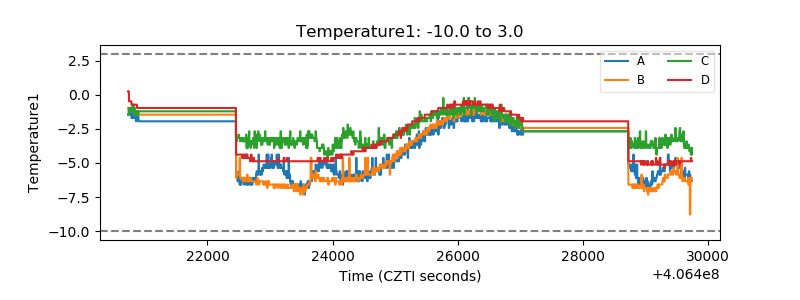 |
| Veto HV Monitor | 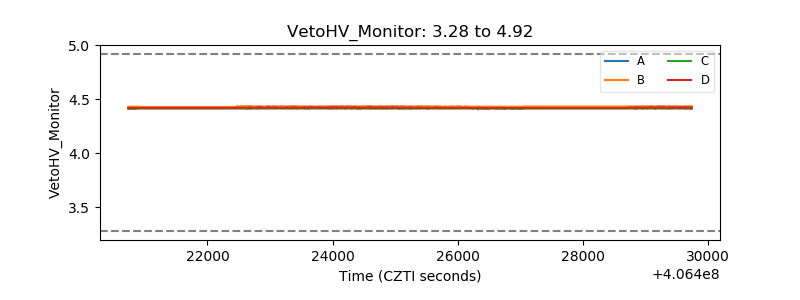 |
| Veto LLD | 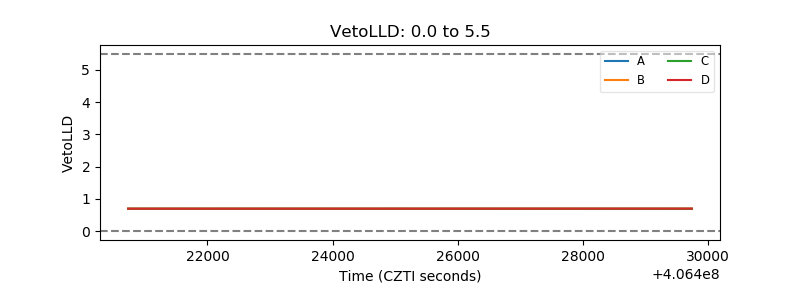 |
| Alpha Counter | 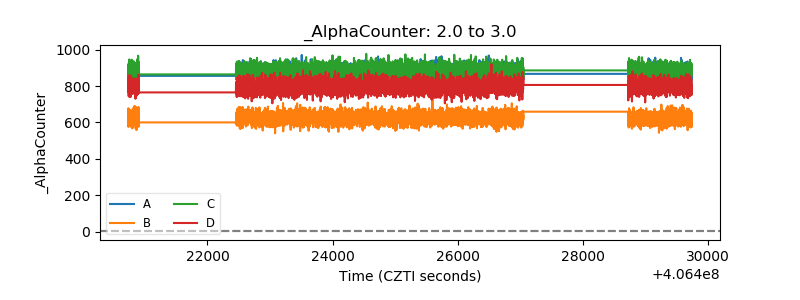 |
| _CPM_Rate | 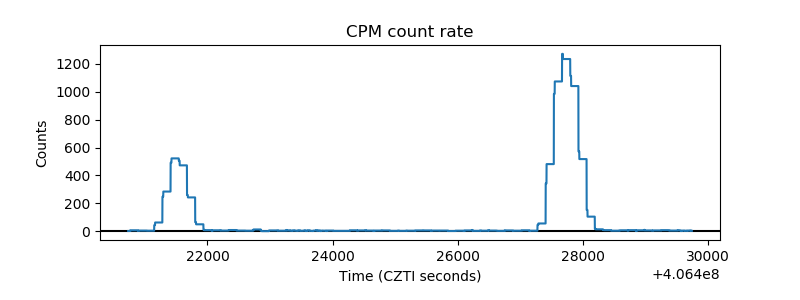 |
| CZT Counter | 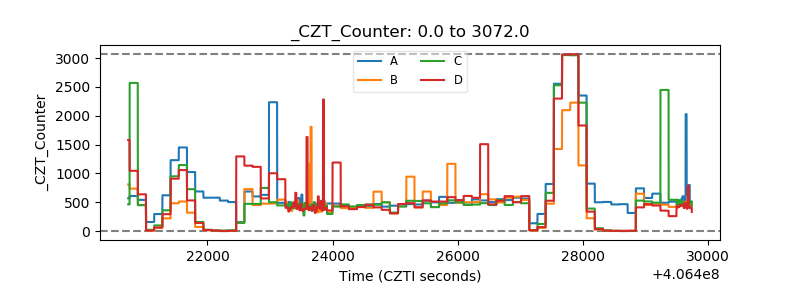 |
| +2.5 Volts monitor | 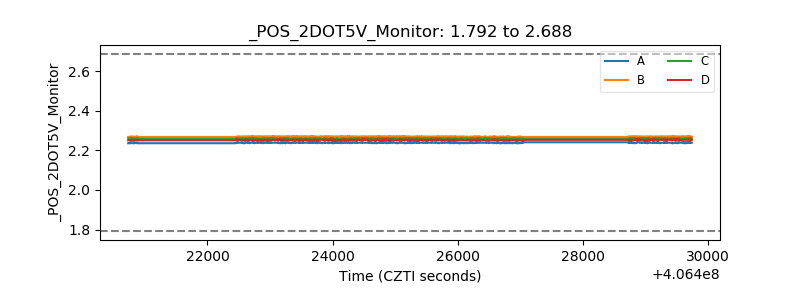 |
| +5 Volts monitor | 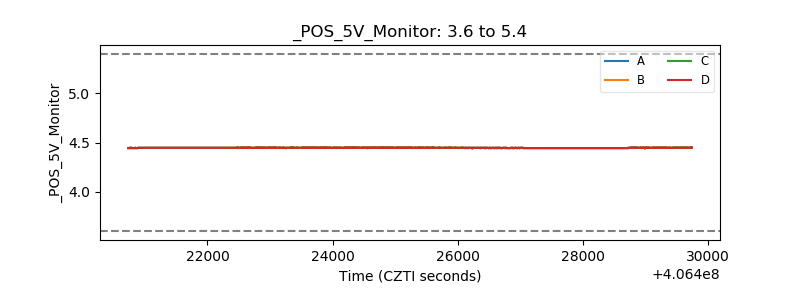 |
| _ROLL_ROT | 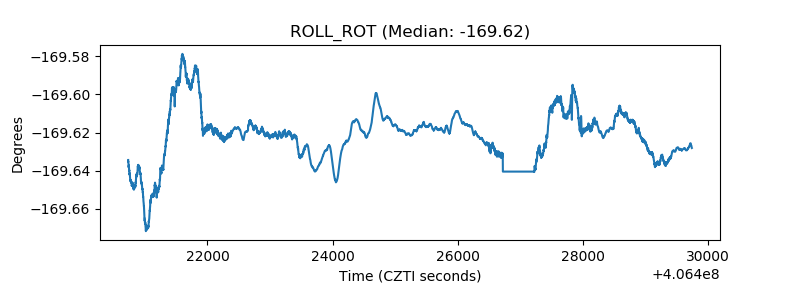 |
| _Roll_DEC | 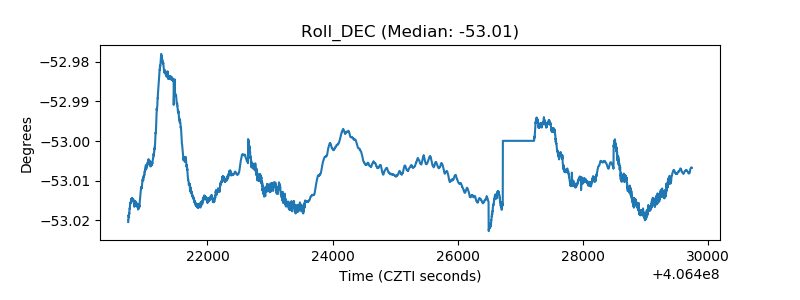 |
| _Roll_RA | 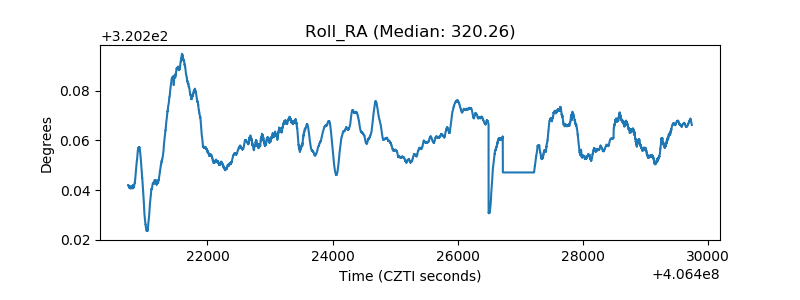 |
| Veto Counter | 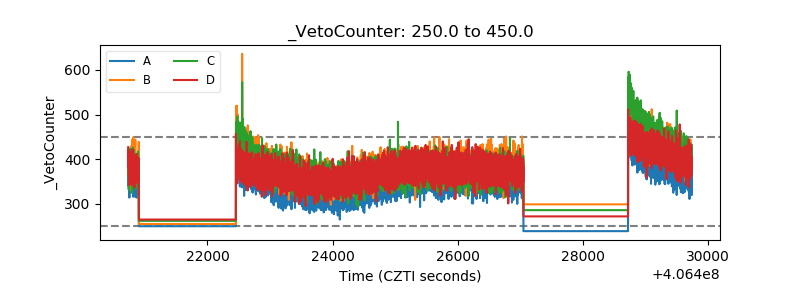 |