| Param | Original file | Final file |
|---|---|---|
| Filename | modeM0/AS1A12_052T04_9000005388_38604cztM0_level2.fits | modeM0/AS1A12_052T04_9000005388_38604cztM0_level2_quad_clean.evt |
| Size (bytes) | 373,115,520 | 93,939,840 |
| Size | 355.8 MB | 89.6 MB |
| Events in quadrant A | 3,045,629 | 652,725 |
| Events in quadrant B | 2,785,400 | 672,474 |
| Events in quadrant C | 2,762,505 | 639,998 |
| Events in quadrant D | 4,798,405 | 502,211 |
| Mode M0 | |||
|---|---|---|---|
| Quadrant | BADHDUFLAG | Total packets | Discarded packets |
| A | 0 | 12188 | 3 |
| B | 0 | 11636 | 2 |
| C | 0 | 11357 | 2 |
| D | 0 | 17923 | 2 |
| Mode SS | |||
|---|---|---|---|
| Quadrant | BADHDUFLAG | Total packets | Discarded packets |
| A | 0 | 110 | 0 |
| B | 0 | 110 | 0 |
| C | 0 | 110 | 0 |
| D | 0 | 110 | 0 |
| Mode M9 | |||
|---|---|---|---|
| Quadrant | BADHDUFLAG | Total packets | Discarded packets |
| A | 0 | 32 | 0 |
| B | 0 | 32 | 0 |
| C | 0 | 32 | 0 |
| D | 0 | 33 | 0 |
| Quadrant | Total seconds | Saturated seconds | Saturation percentage |
|---|---|---|---|
| A | 5386 | 25 | 0.464166% |
| B | 5386 | 46 | 0.854066% |
| C | 5386 | 17 | 0.315633% |
| D | 5386 | 810 | 15.038990% |
Noise dominated data is calculated using 1-second bins in cleaned event files. If a bin has >2000 counts, and if more than 50% of those come from <1% of pixels, then it is considered to be noise-dominated and hence unusable.
| Quadrant | # 1 sec bins | Bins with >0 counts | Bins with >2000 counts | High rate bins dominated by noise | Noise dominated (total time) | Noise dominated (detector-on time) | Marked lightcurve |
|---|---|---|---|---|---|---|---|
| A | 7208 | 5387 | 13 | 13 | 0.18% | 0.24% | 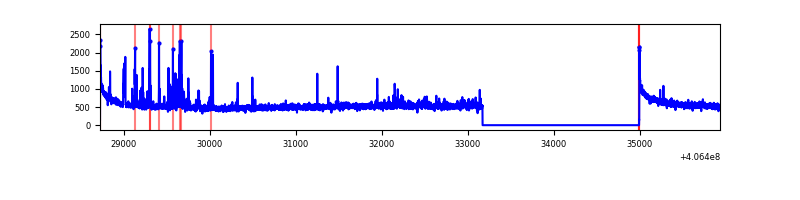 |
| B | 7208 | 5387 | 29 | 29 | 0.40% | 0.54% | 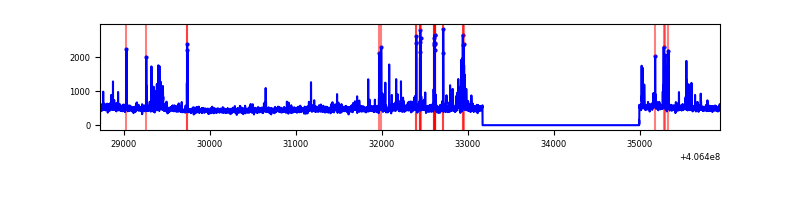 |
| C | 7208 | 5387 | 8 | 8 | 0.11% | 0.15% | 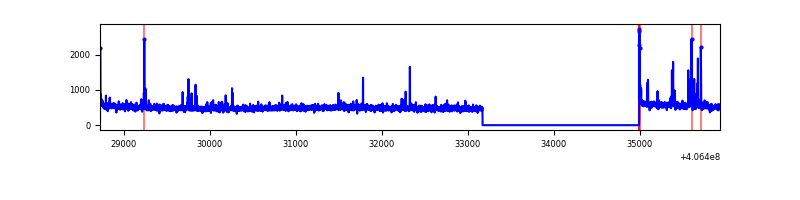 |
| D | 7208 | 5387 | 797 | 797 | 11.06% | 14.79% | 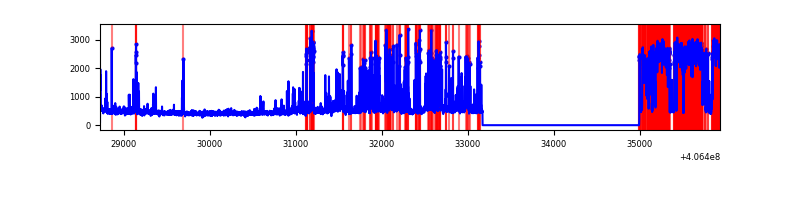 |
Top three noisy pixels from each quadrant. If the there are fewer than three noisy pixels in the level2.evt file, extra rows are filled as -1
| Pixel properties | Quadrant properties | ||||||
|---|---|---|---|---|---|---|---|
| Quadrant | DetID | PixID | Counts | Sigma | Mean | Median | Sigma |
| A | 10 | 83 | 420276 | 3288.11 | 628 | 614 | 127.6 |
| A | 13 | 248 | 149084 | 1163.28 | 628 | 614 | 127.6 |
| A | 12 | 189 | 25448 | 194.58 | 628 | 614 | 127.6 |
| B | 5 | 200 | 93177 | 779.22 | 626 | 612 | 118.8 |
| B | 5 | 172 | 71154 | 593.83 | 626 | 612 | 118.8 |
| B | 0 | 183 | 45280 | 376.02 | 626 | 612 | 118.8 |
| C | 15 | 214 | 223506 | 1568.23 | 620 | 626 | 142.1 |
| C | 14 | 254 | 45644 | 316.76 | 620 | 626 | 142.1 |
| C | 15 | 159 | 28159 | 193.73 | 620 | 626 | 142.1 |
| D | 12 | 227 | 1490617 | 10720.05 | 572 | 555 | 139.0 |
| D | 1 | 47 | 365461 | 2625.27 | 572 | 555 | 139.0 |
| D | 13 | 249 | 200599 | 1439.19 | 572 | 555 | 139.0 |
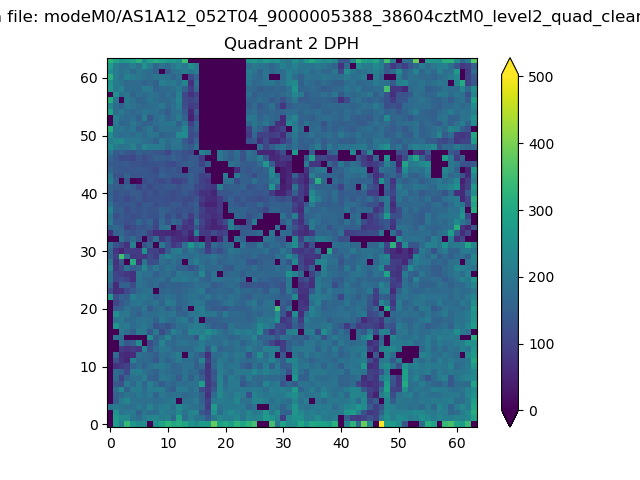
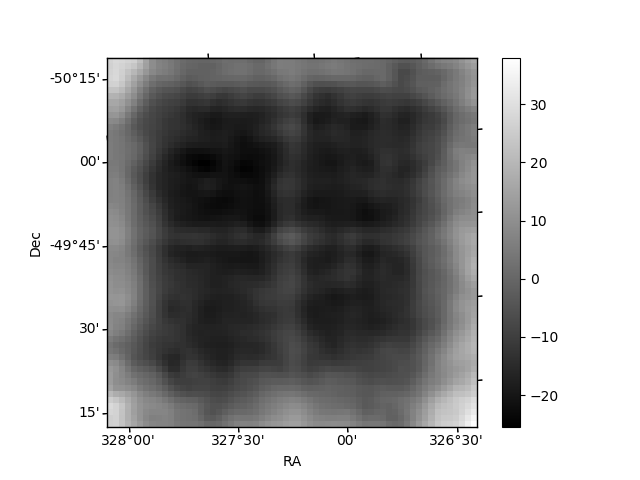
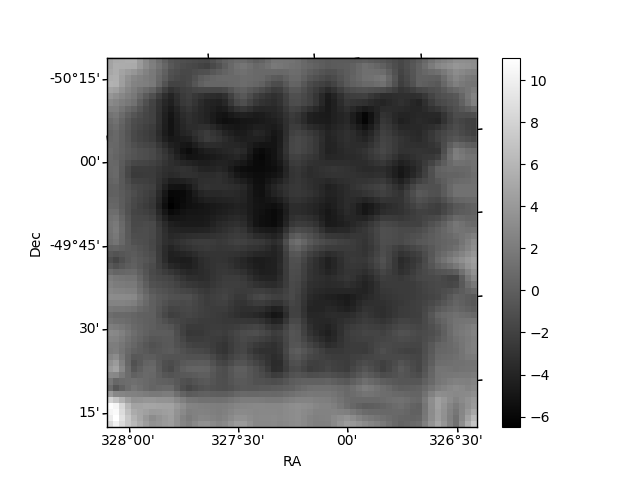
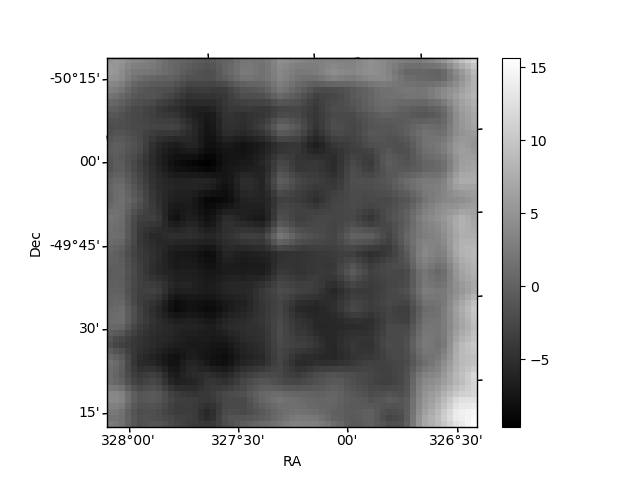
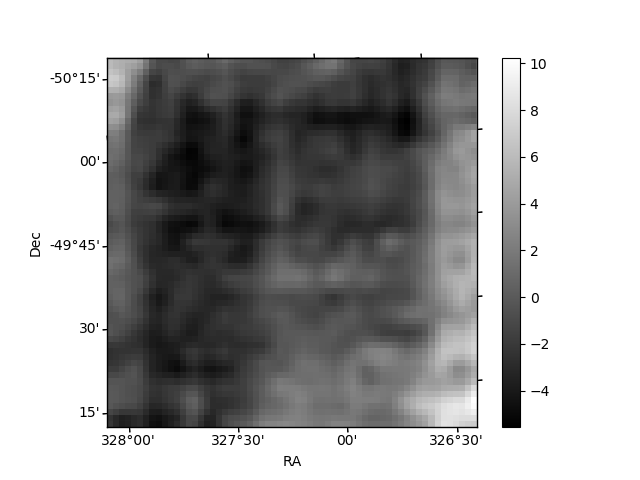
Histogram calculated using DETX and DETY for each event in the final _common_clean file
| Quadrant A | 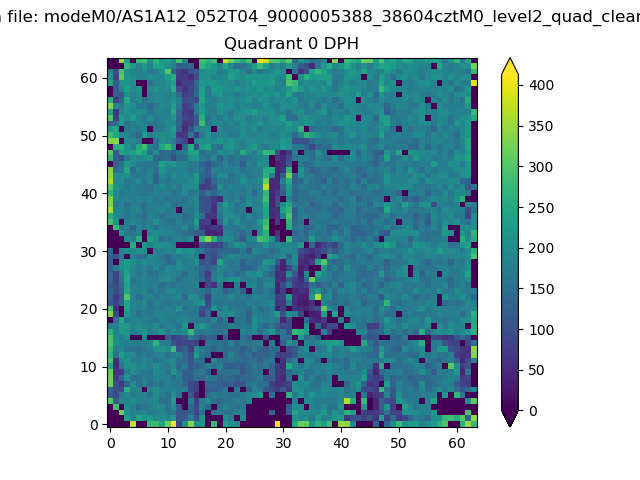 |
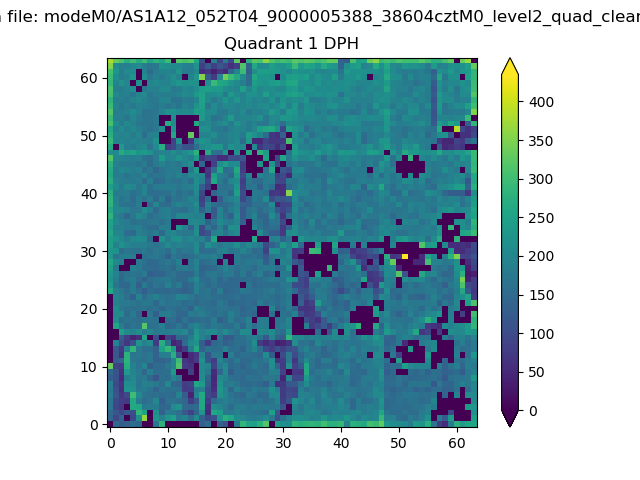 |
Quadrant B |
|---|---|---|---|
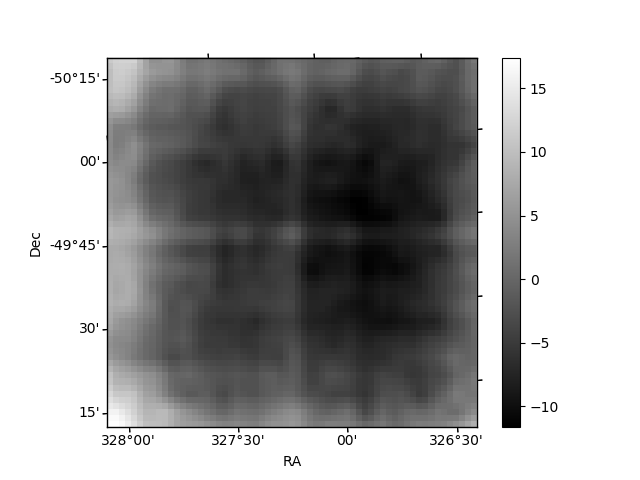
| Quadrant D | 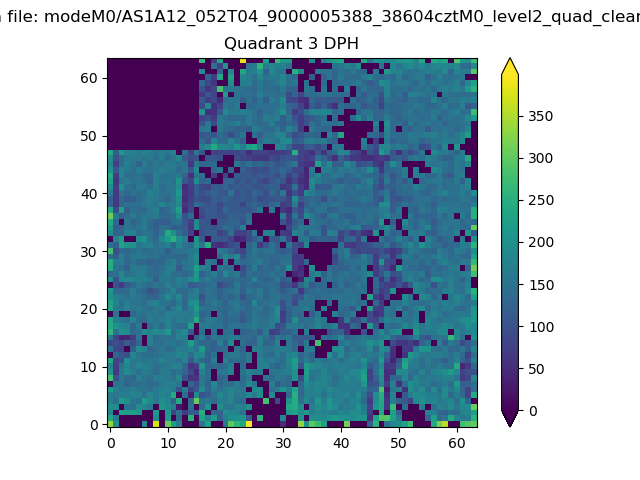 |
 |
Quadrant C |
| Plot type | Count rate plots | Images |
|---|---|---|
| Comparison with Poisson distribution Blue bars denote a histogram of data divided into 1 sec bins. Red curve is a Poisson curve with rate = median count rate of data. |
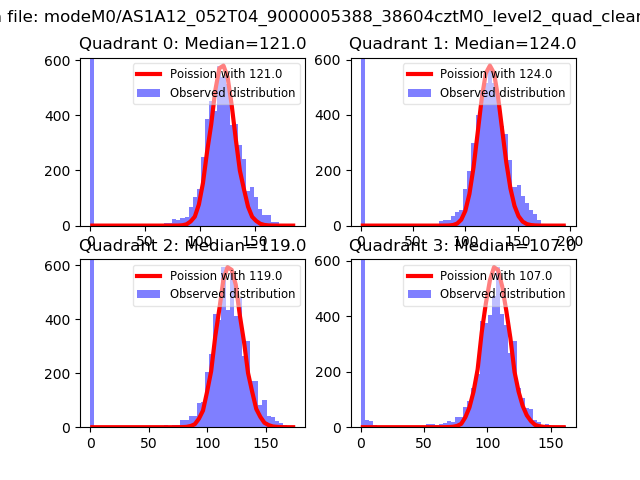 |
 |
| Quadrant-wise count rates Data is divided into 100 sec bins |
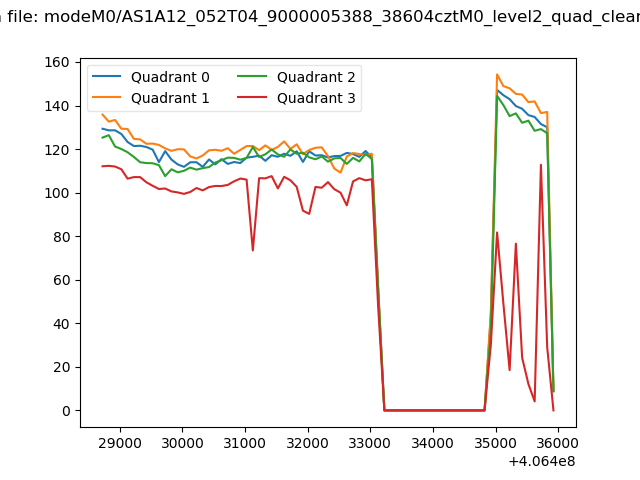 |
|
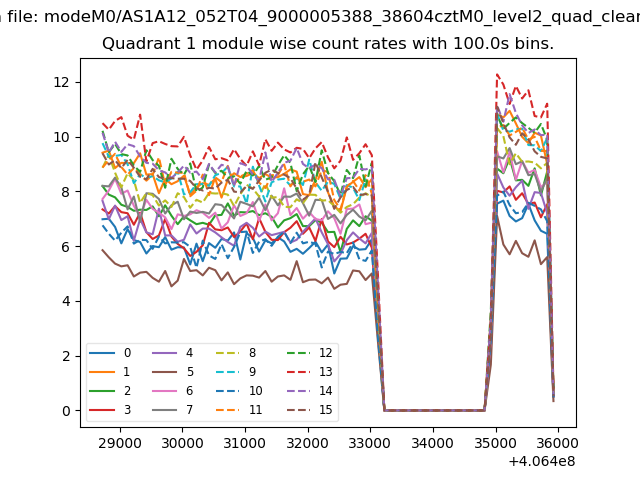
| Module-wise count rates for Quadrant A Data is divided into 100 sec bins |
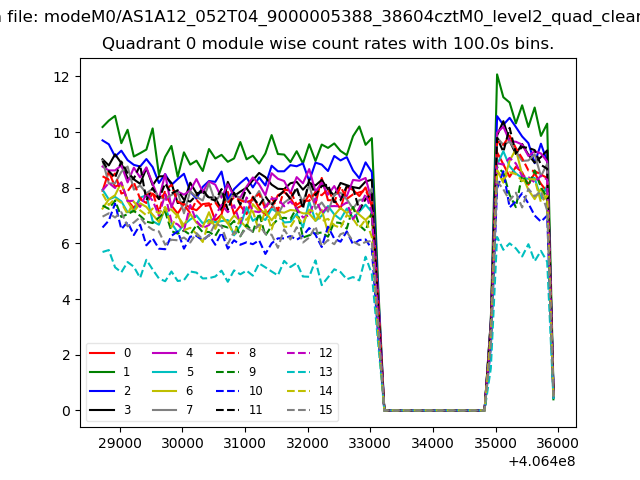 |
 |
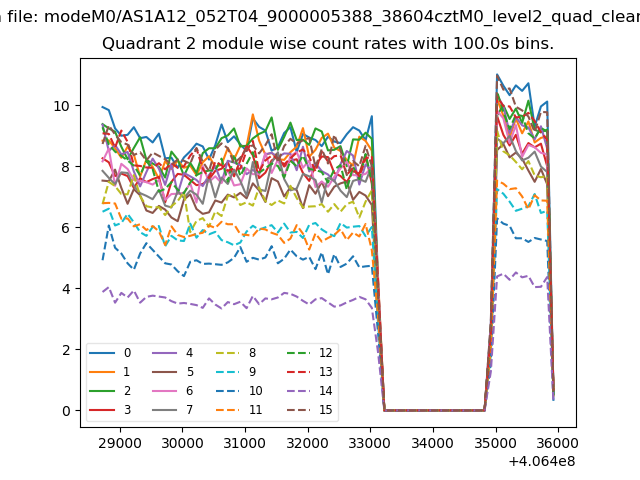
| Module-wise count rates for Quadrant B Data is divided into 100 sec bins |
 |
 |
| Module-wise count rates for Quadrant C Data is divided into 100 sec bins |
 |
 |
| Module-wise count rates for Quadrant D Data is divided into 100 sec bins |
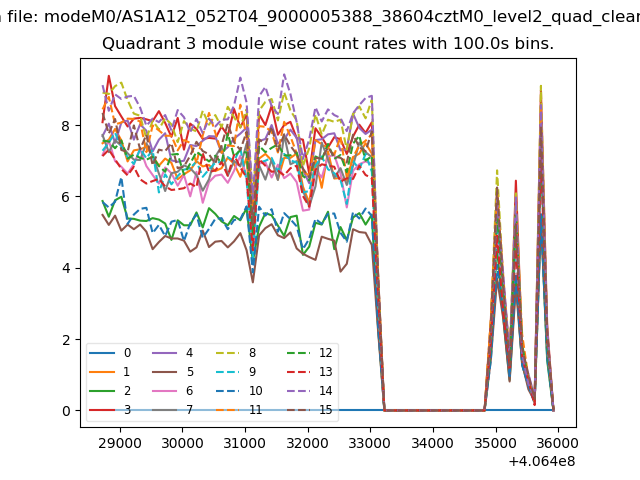 |
 |
| Parameter | Plot |
|---|---|
| CZT HV Monitor | 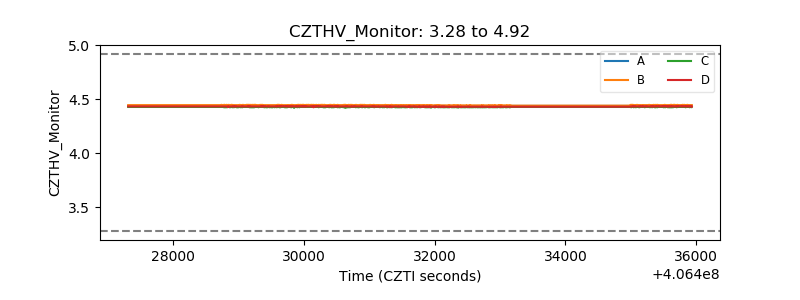 |
| D_VDD | 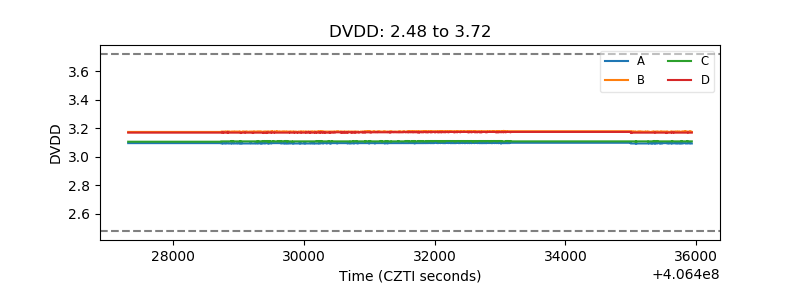 |
| Temperature 1 | 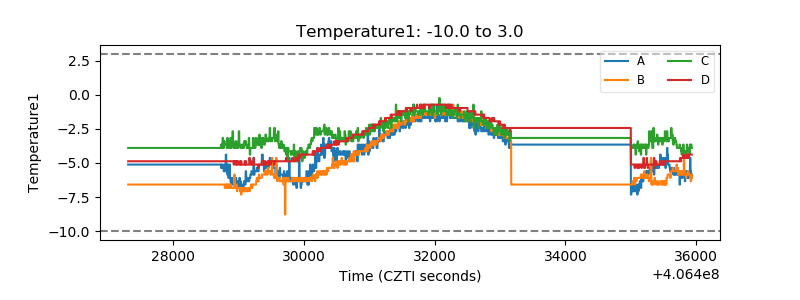 |
| Veto HV Monitor | 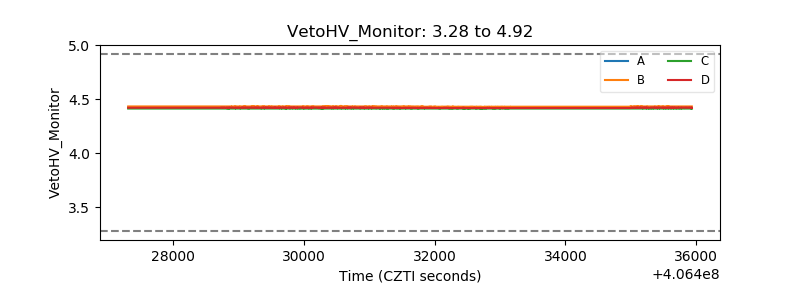 |
| Veto LLD | 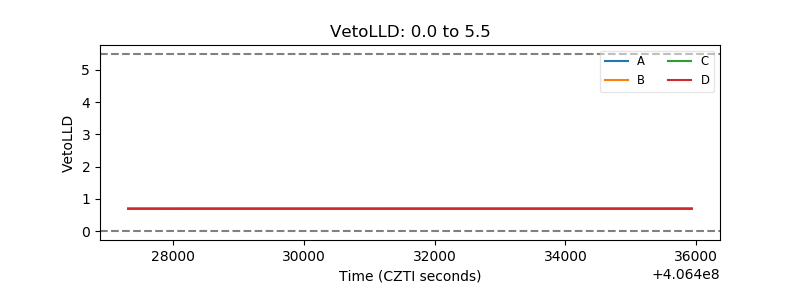 |
| Alpha Counter | 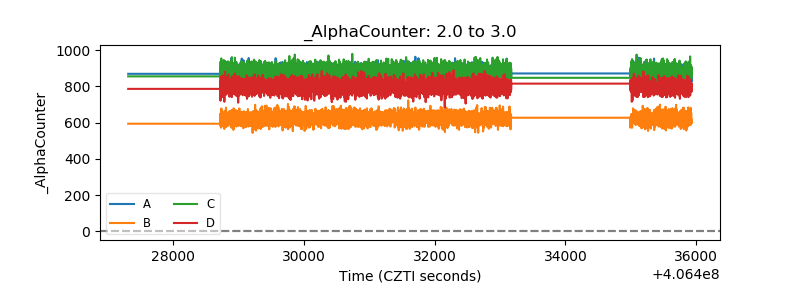 |
| _CPM_Rate |  |
| CZT Counter | 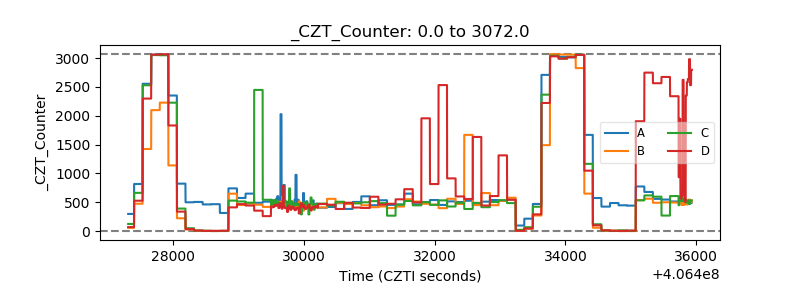 |
| +2.5 Volts monitor | 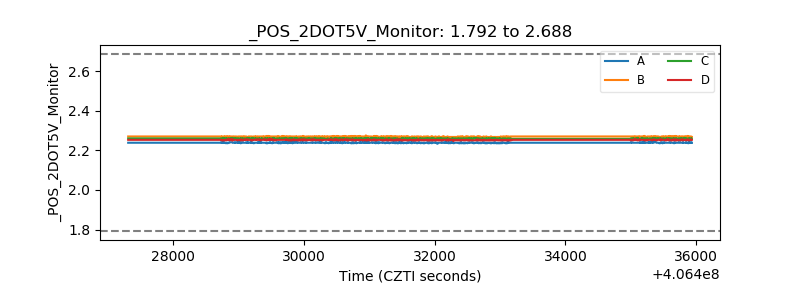 |
| +5 Volts monitor |  |
| _ROLL_ROT | 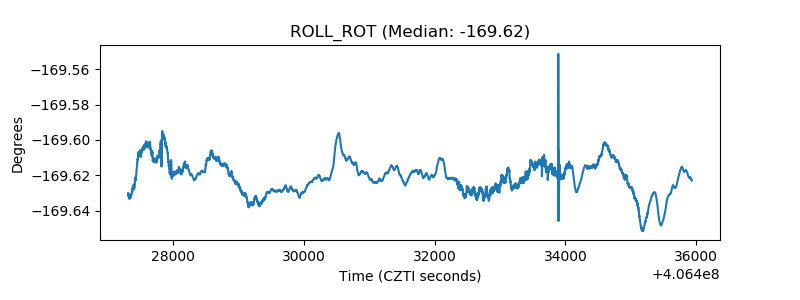 |
| _Roll_DEC | 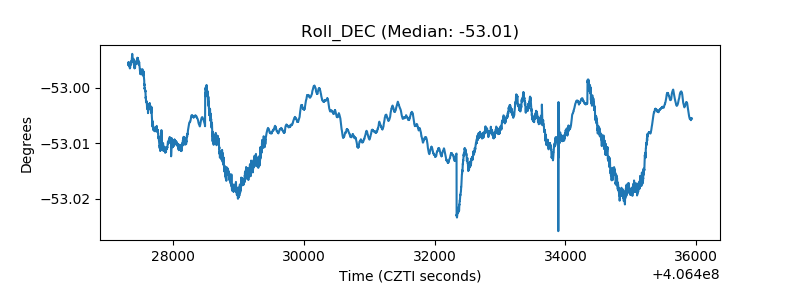 |
| _Roll_RA | 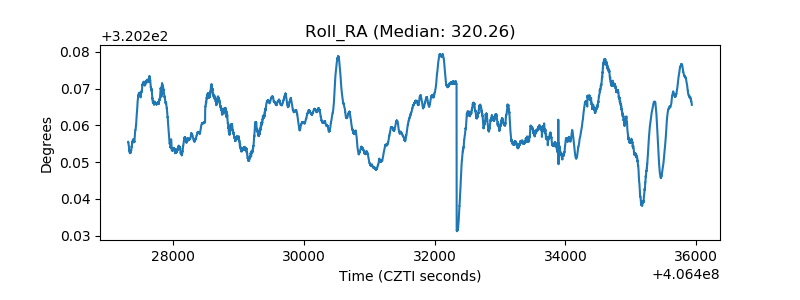 |
| Veto Counter | 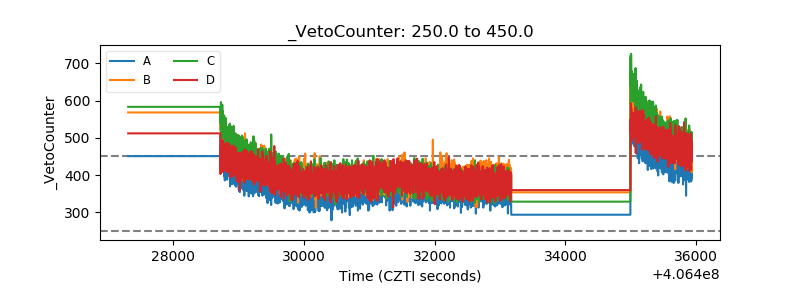 |