| Param | Original file | Final file |
|---|---|---|
| Filename | modeM0/AS1A12_052T04_9000005388_38605cztM0_level2.fits | modeM0/AS1A12_052T04_9000005388_38605cztM0_level2_quad_clean.evt |
| Size (bytes) | 439,223,040 | 91,837,440 |
| Size | 418.9 MB | 87.6 MB |
| Events in quadrant A | 2,913,480 | 671,576 |
| Events in quadrant B | 3,143,667 | 667,581 |
| Events in quadrant C | 2,956,650 | 654,175 |
| Events in quadrant D | 6,844,140 | 426,548 |
| Mode M0 | |||
|---|---|---|---|
| Quadrant | BADHDUFLAG | Total packets | Discarded packets |
| A | 0 | 11644 | 3 |
| B | 0 | 12459 | 2 |
| C | 0 | 11863 | 2 |
| D | 0 | 23664 | 2 |
| Mode SS | |||
|---|---|---|---|
| Quadrant | BADHDUFLAG | Total packets | Discarded packets |
| A | 0 | 106 | 0 |
| B | 0 | 106 | 0 |
| C | 0 | 106 | 0 |
| D | 0 | 106 | 0 |
| Mode M9 | |||
|---|---|---|---|
| Quadrant | BADHDUFLAG | Total packets | Discarded packets |
| A | 0 | 29 | 0 |
| B | 0 | 29 | 0 |
| C | 0 | 29 | 0 |
| D | 0 | 30 | 0 |
| Quadrant | Total seconds | Saturated seconds | Saturation percentage |
|---|---|---|---|
| A | 5150 | 14 | 0.271845% |
| B | 5150 | 224 | 4.349515% |
| C | 5150 | 69 | 1.339806% |
| D | 5150 | 1677 | 32.563107% |
Noise dominated data is calculated using 1-second bins in cleaned event files. If a bin has >2000 counts, and if more than 50% of those come from <1% of pixels, then it is considered to be noise-dominated and hence unusable.
| Quadrant | # 1 sec bins | Bins with >0 counts | Bins with >2000 counts | High rate bins dominated by noise | Noise dominated (total time) | Noise dominated (detector-on time) | Marked lightcurve |
|---|---|---|---|---|---|---|---|
| A | 7093 | 5151 | 6 | 6 | 0.08% | 0.12% | 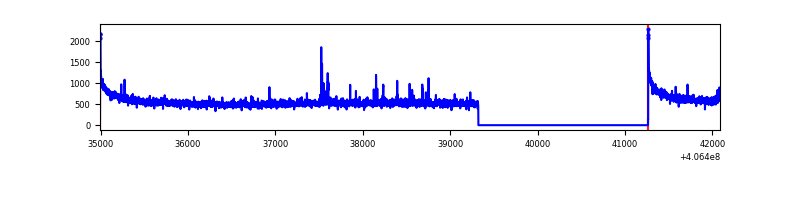 |
| B | 7093 | 5151 | 142 | 142 | 2.00% | 2.76% | 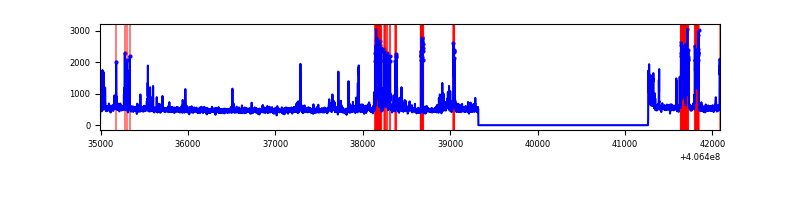 |
| C | 7093 | 5151 | 55 | 55 | 0.78% | 1.07% | 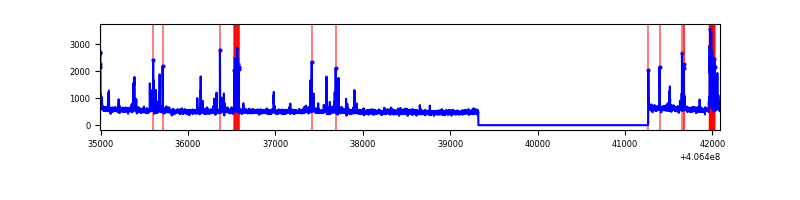 |
| D | 7093 | 5151 | 1702 | 1702 | 24.00% | 33.04% | 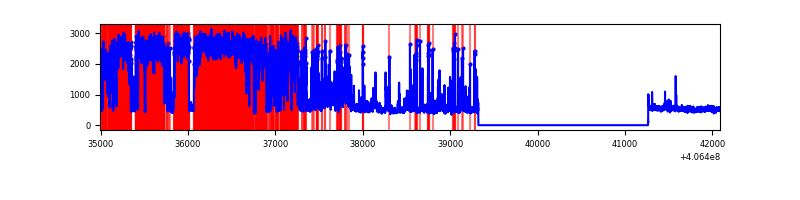 |
Top three noisy pixels from each quadrant. If the there are fewer than three noisy pixels in the level2.evt file, extra rows are filled as -1
| Pixel properties | Quadrant properties | ||||||
|---|---|---|---|---|---|---|---|
| Quadrant | DetID | PixID | Counts | Sigma | Mean | Median | Sigma |
| A | 10 | 83 | 404553 | 3167.7 | 630 | 620 | 127.5 |
| A | 13 | 248 | 41129 | 317.68 | 630 | 620 | 127.5 |
| A | 12 | 189 | 16370 | 123.51 | 630 | 620 | 127.5 |
| B | 5 | 184 | 385947 | 3323.25 | 618 | 603 | 116.0 |
| B | 5 | 200 | 95702 | 820.15 | 618 | 603 | 116.0 |
| B | 5 | 172 | 67198 | 574.32 | 618 | 603 | 116.0 |
| C | 15 | 214 | 213886 | 1508.44 | 617 | 622 | 141.4 |
| C | 15 | 159 | 156063 | 1099.45 | 617 | 622 | 141.4 |
| C | 14 | 254 | 138633 | 976.17 | 617 | 622 | 141.4 |
| D | 12 | 227 | 4157271 | 32468.04 | 526 | 512 | 128.0 |
| D | 1 | 47 | 251609 | 1961.29 | 526 | 512 | 128.0 |
| D | 14 | 52 | 127166 | 989.28 | 526 | 512 | 128.0 |
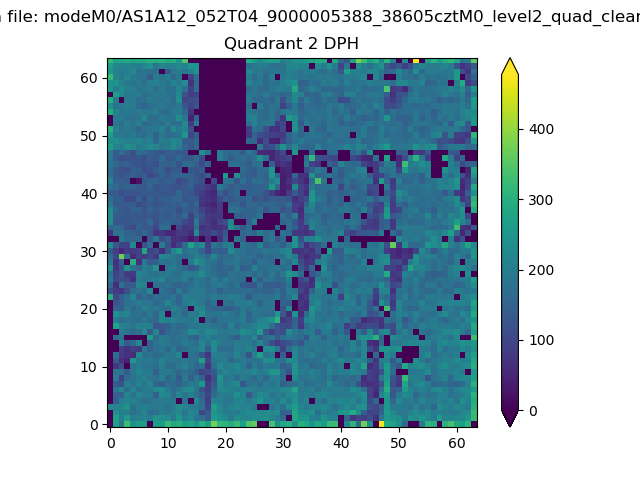
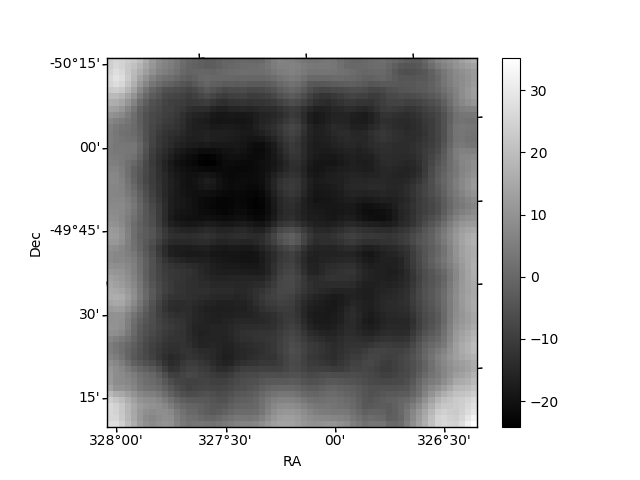
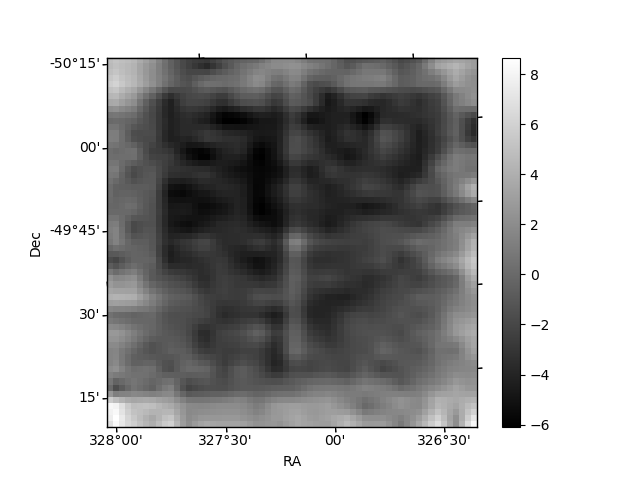
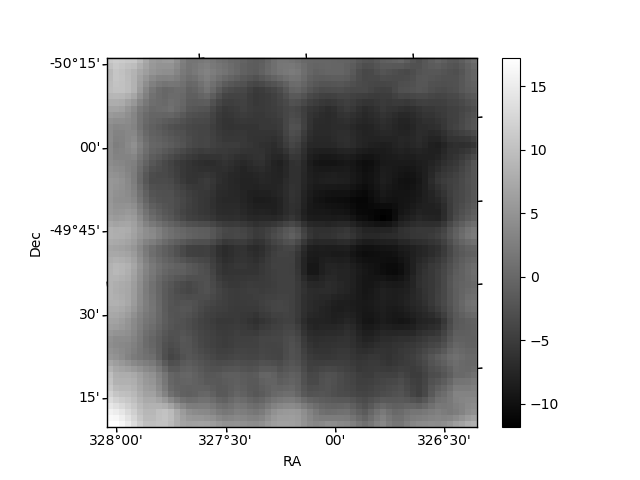
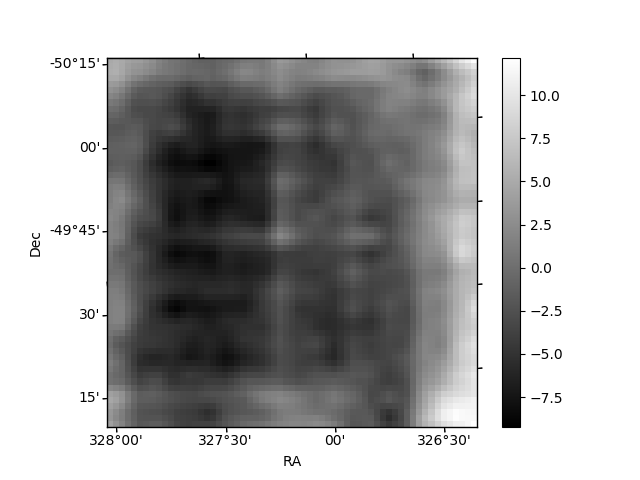
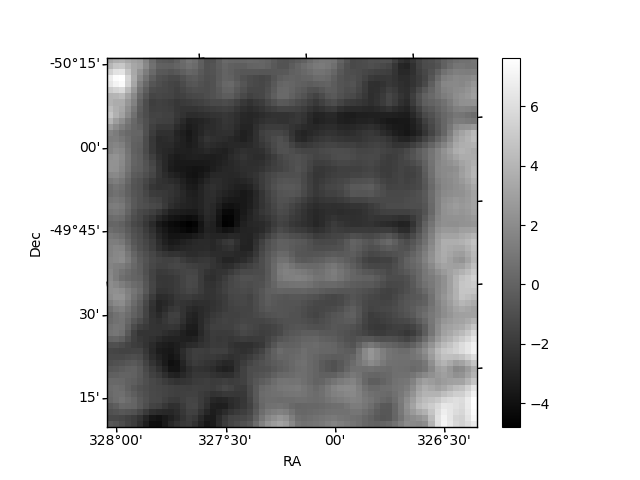
Histogram calculated using DETX and DETY for each event in the final _common_clean file
| Quadrant A | 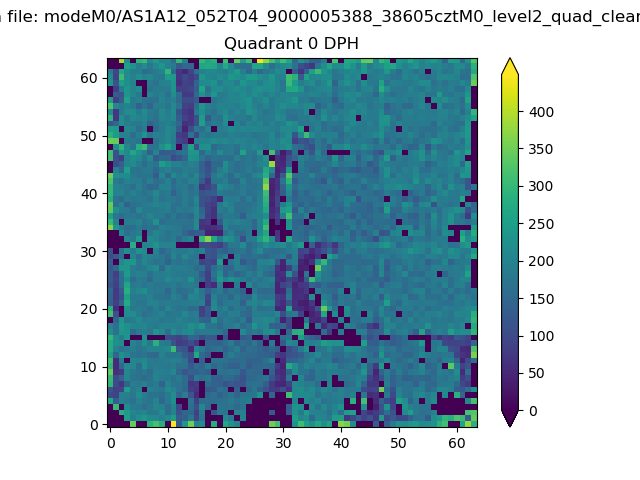 |
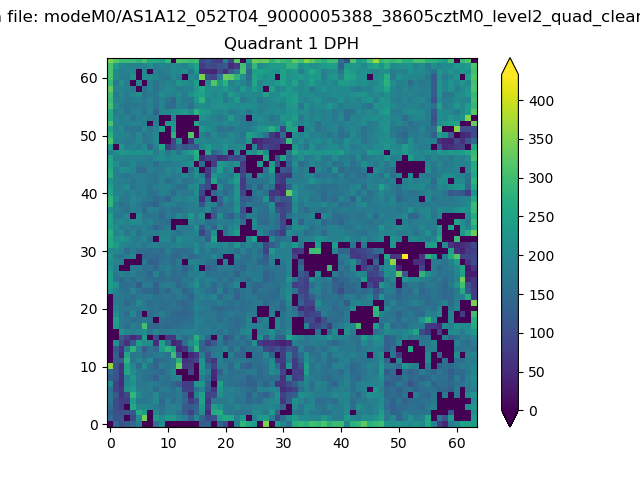 |
Quadrant B |
|---|---|---|---|
| Quadrant D | 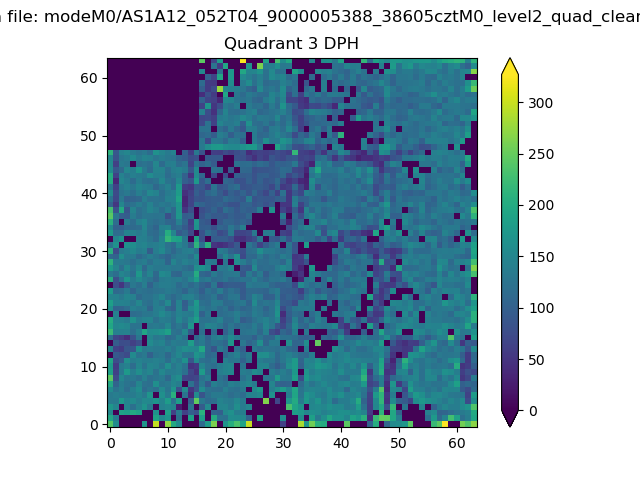 |
 |
Quadrant C |
| Plot type | Count rate plots | Images |
|---|---|---|
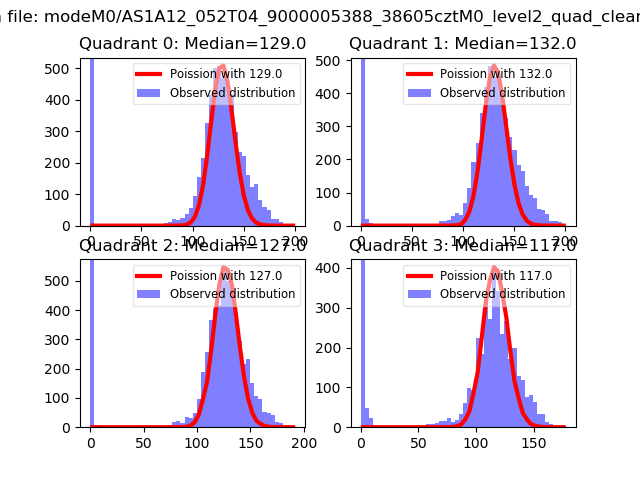
| Comparison with Poisson distribution Blue bars denote a histogram of data divided into 1 sec bins. Red curve is a Poisson curve with rate = median count rate of data. |
 |
 |
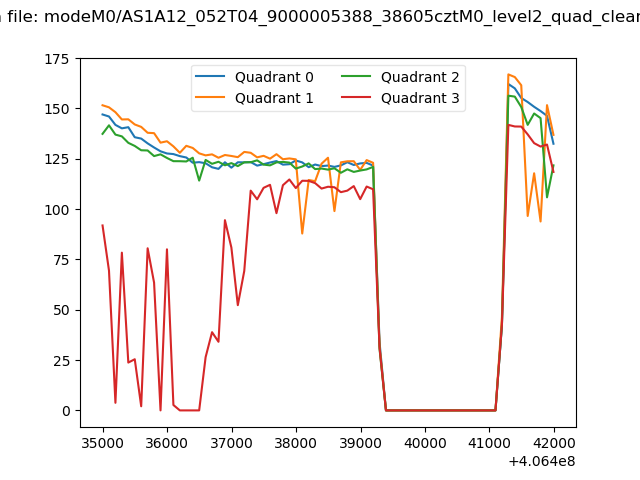
| Quadrant-wise count rates Data is divided into 100 sec bins |
 |
|
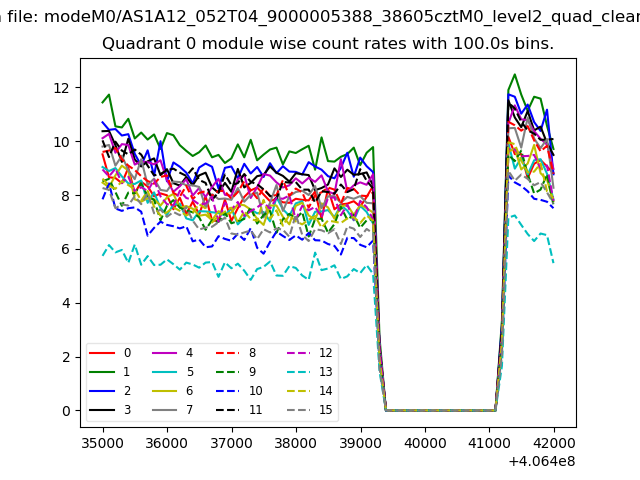
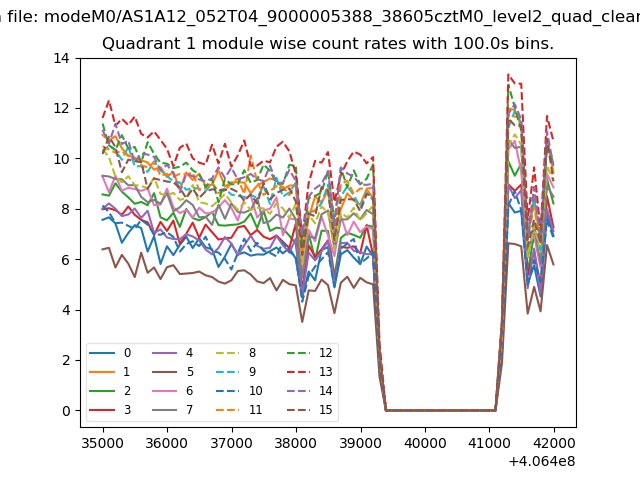
| Module-wise count rates for Quadrant A Data is divided into 100 sec bins |
 |
 |
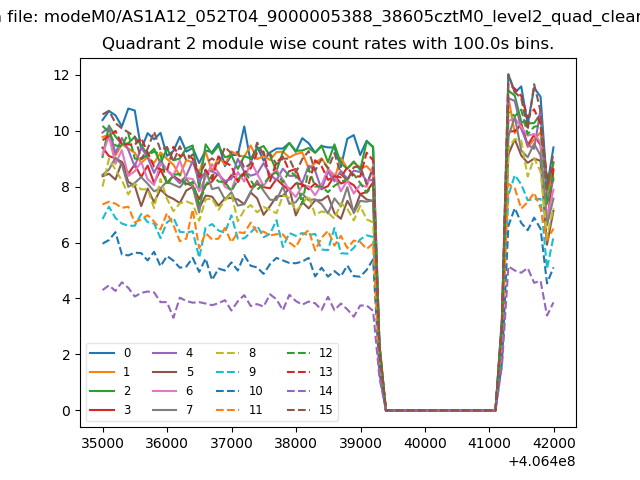
| Module-wise count rates for Quadrant B Data is divided into 100 sec bins |
 |
 |
| Module-wise count rates for Quadrant C Data is divided into 100 sec bins |
 |
 |
| Module-wise count rates for Quadrant D Data is divided into 100 sec bins |
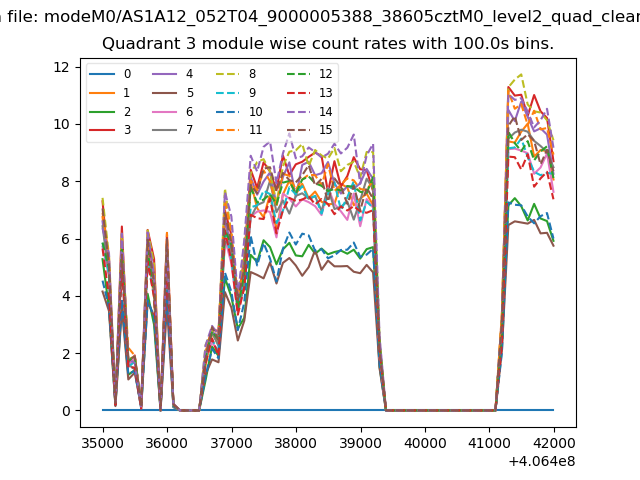 |
 |
| Parameter | Plot |
|---|---|
| CZT HV Monitor | 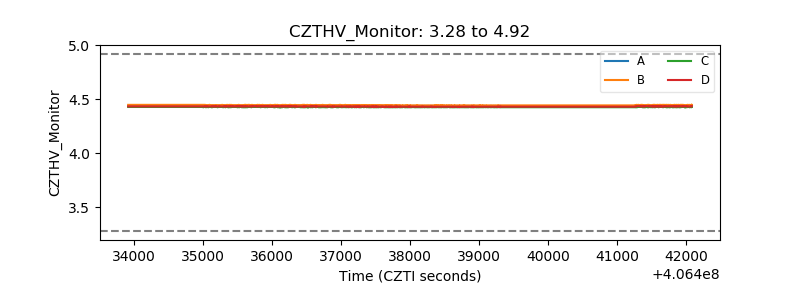 |
| D_VDD | 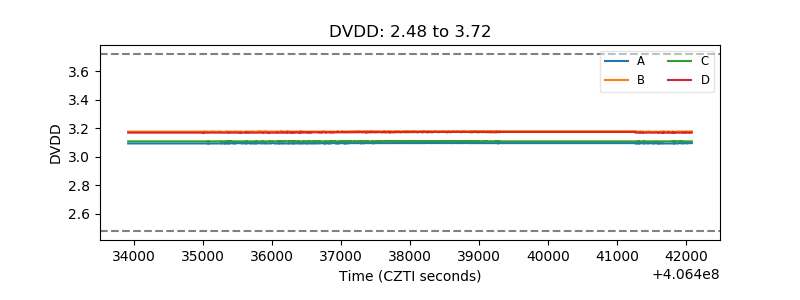 |
| Temperature 1 | 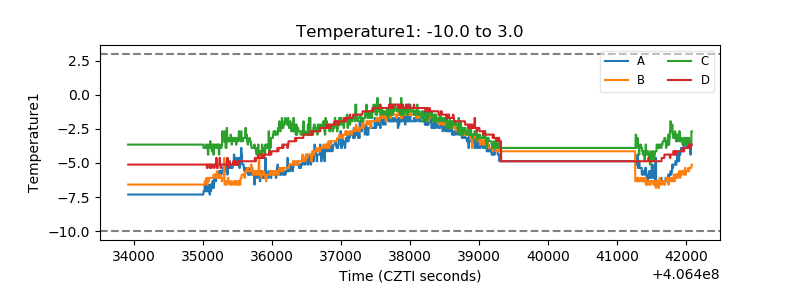 |
| Veto HV Monitor | 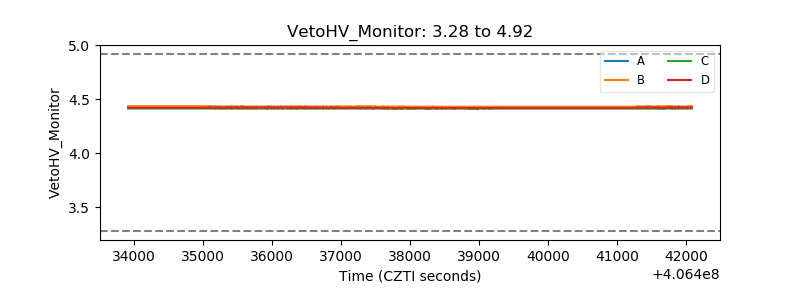 |
| Veto LLD | 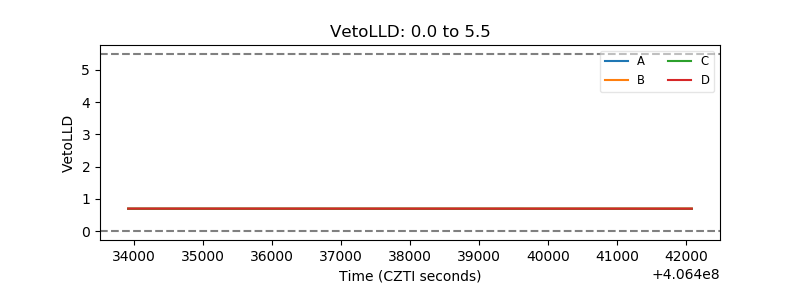 |
| Alpha Counter | 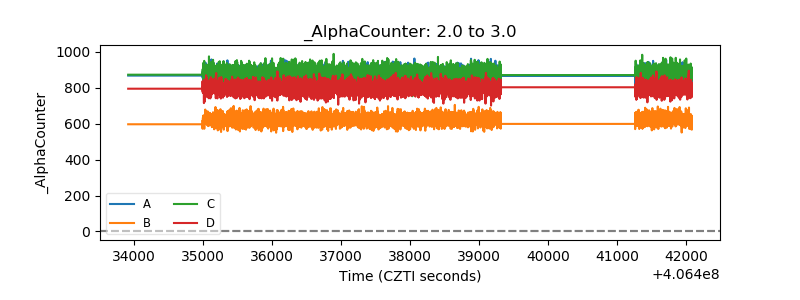 |
| _CPM_Rate | 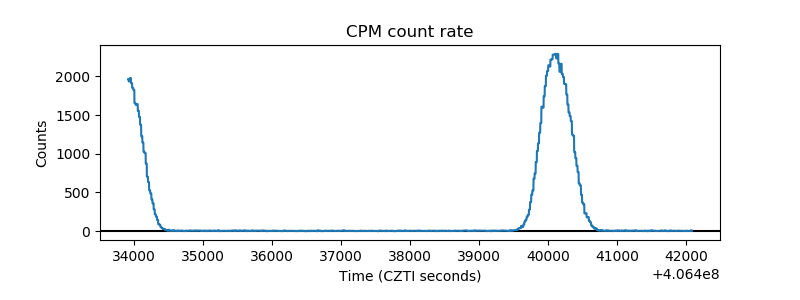 |
| CZT Counter | 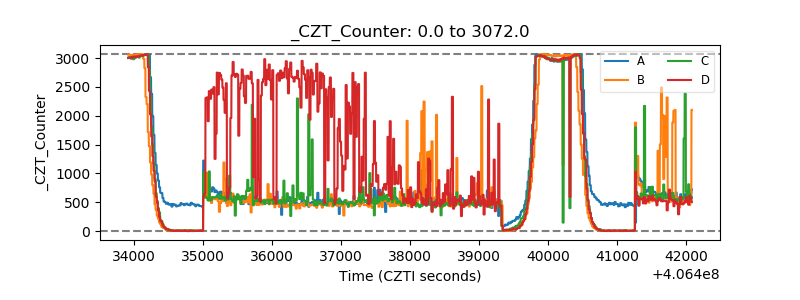 |
| +2.5 Volts monitor |  |
| +5 Volts monitor |  |
| _ROLL_ROT | 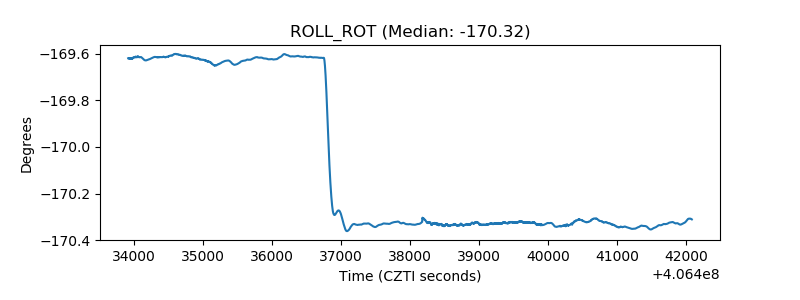 |
| _Roll_DEC | 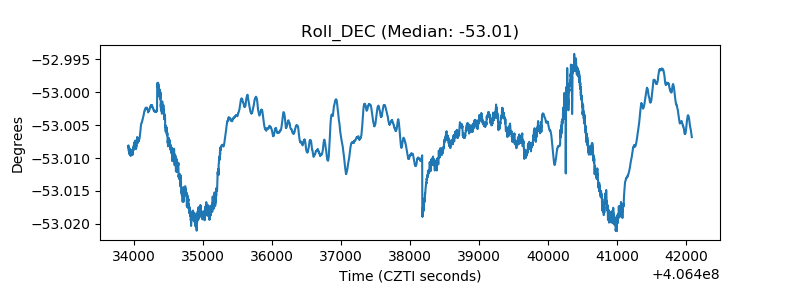 |
| _Roll_RA | 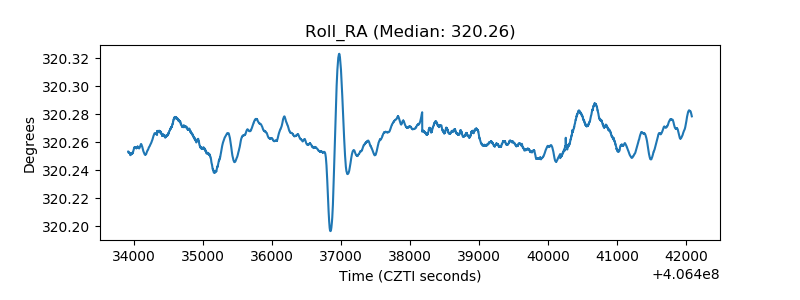 |
| Veto Counter | 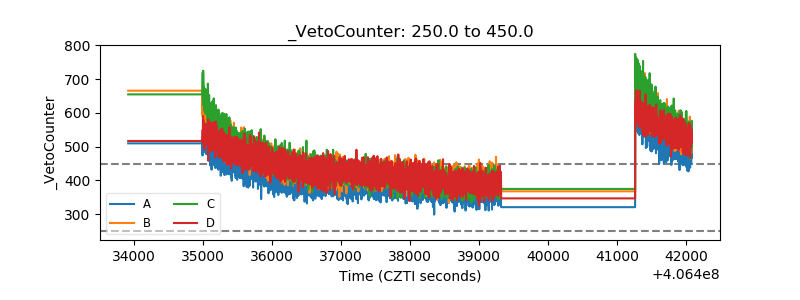 |