| Param | Original file | Final file |
|---|---|---|
| Filename | modeM0/AS1A12_052T04_9000005388_38606cztM0_level2.fits | modeM0/AS1A12_052T04_9000005388_38606cztM0_level2_quad_clean.evt |
| Size (bytes) | 374,739,840 | 99,362,880 |
| Size | 357.4 MB | 94.8 MB |
| Events in quadrant A | 2,962,708 | 696,297 |
| Events in quadrant B | 3,532,516 | 688,835 |
| Events in quadrant C | 2,972,156 | 681,610 |
| Events in quadrant D | 4,013,385 | 590,161 |
| Mode M0 | |||
|---|---|---|---|
| Quadrant | BADHDUFLAG | Total packets | Discarded packets |
| A | 0 | 11813 | 3 |
| B | 0 | 13586 | 2 |
| C | 0 | 11939 | 2 |
| D | 0 | 15115 | 2 |
| Mode SS | |||
|---|---|---|---|
| Quadrant | BADHDUFLAG | Total packets | Discarded packets |
| A | 0 | 102 | 0 |
| B | 0 | 102 | 0 |
| C | 0 | 102 | 0 |
| D | 0 | 102 | 0 |
| Mode M9 | |||
|---|---|---|---|
| Quadrant | BADHDUFLAG | Total packets | Discarded packets |
| A | 0 | 33 | 0 |
| B | 0 | 33 | 0 |
| C | 0 | 33 | 0 |
| D | 0 | 34 | 0 |
| Quadrant | Total seconds | Saturated seconds | Saturation percentage |
|---|---|---|---|
| A | 5024 | 14 | 0.278662% |
| B | 5024 | 272 | 5.414013% |
| C | 5024 | 60 | 1.194268% |
| D | 5024 | 417 | 8.300159% |
Noise dominated data is calculated using 1-second bins in cleaned event files. If a bin has >2000 counts, and if more than 50% of those come from <1% of pixels, then it is considered to be noise-dominated and hence unusable.
| Quadrant | # 1 sec bins | Bins with >0 counts | Bins with >2000 counts | High rate bins dominated by noise | Noise dominated (total time) | Noise dominated (detector-on time) | Marked lightcurve |
|---|---|---|---|---|---|---|---|
| A | 7088 | 5025 | 7 | 7 | 0.10% | 0.14% | 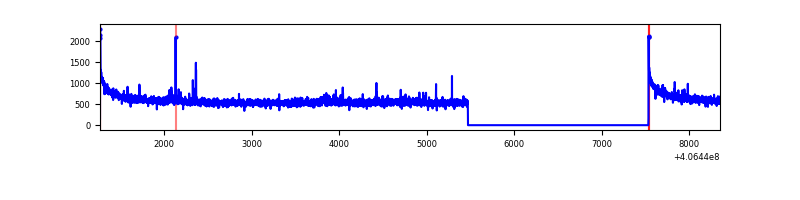 |
| B | 7088 | 5025 | 160 | 160 | 2.26% | 3.18% | 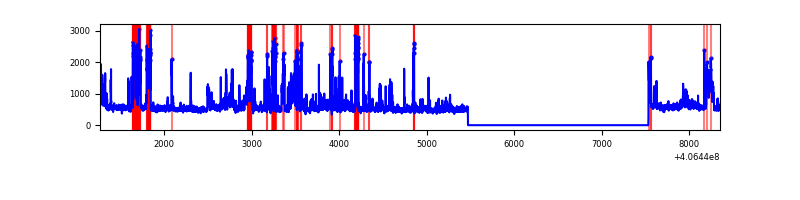 |
| C | 7088 | 5025 | 47 | 47 | 0.66% | 0.94% | 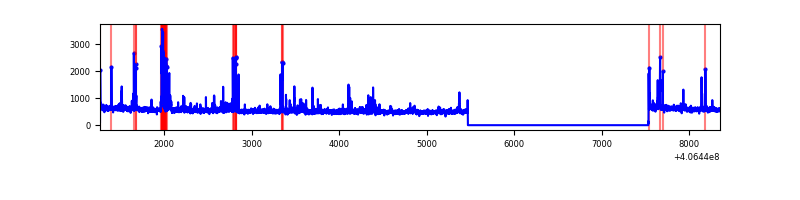 |
| D | 7088 | 5025 | 370 | 370 | 5.22% | 7.36% | 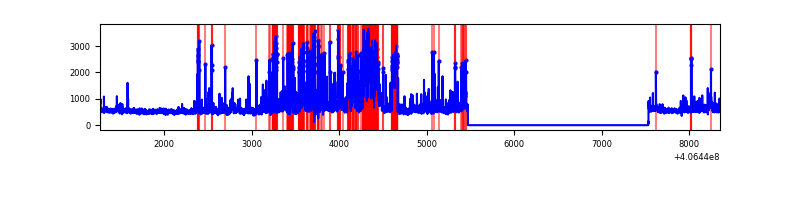 |
Top three noisy pixels from each quadrant. If the there are fewer than three noisy pixels in the level2.evt file, extra rows are filled as -1
| Pixel properties | Quadrant properties | ||||||
|---|---|---|---|---|---|---|---|
| Quadrant | DetID | PixID | Counts | Sigma | Mean | Median | Sigma |
| A | 10 | 83 | 414781 | 3236.7 | 641 | 631 | 128.0 |
| A | 12 | 189 | 31411 | 240.55 | 641 | 631 | 128.0 |
| A | 13 | 248 | 23862 | 181.56 | 641 | 631 | 128.0 |
| B | 5 | 184 | 785324 | 6774.11 | 623 | 609 | 115.8 |
| B | 5 | 200 | 63181 | 540.16 | 623 | 609 | 115.8 |
| B | 5 | 172 | 58677 | 501.28 | 623 | 609 | 115.8 |
| C | 15 | 214 | 207995 | 1465.59 | 623 | 629 | 141.5 |
| C | 15 | 159 | 159626 | 1123.74 | 623 | 629 | 141.5 |
| C | 14 | 254 | 122554 | 861.72 | 623 | 629 | 141.5 |
| D | 13 | 249 | 436336 | 3033.62 | 602 | 588 | 143.6 |
| D | 1 | 47 | 384657 | 2673.84 | 602 | 588 | 143.6 |
| D | 12 | 235 | 343526 | 2387.49 | 602 | 588 | 143.6 |
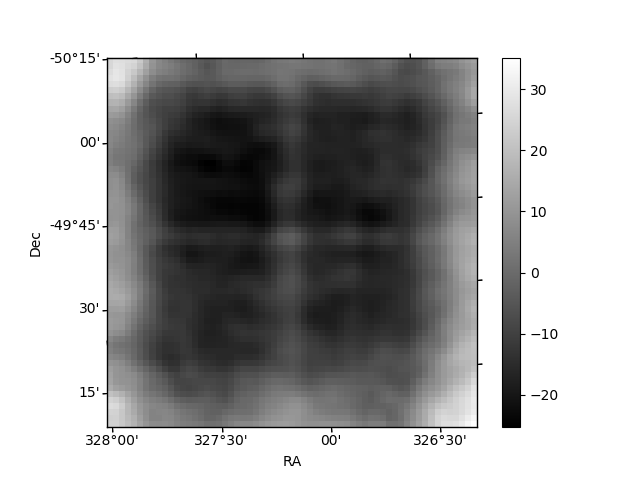
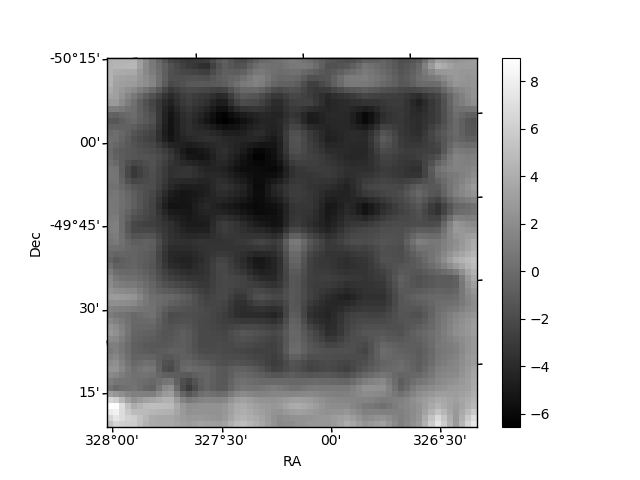
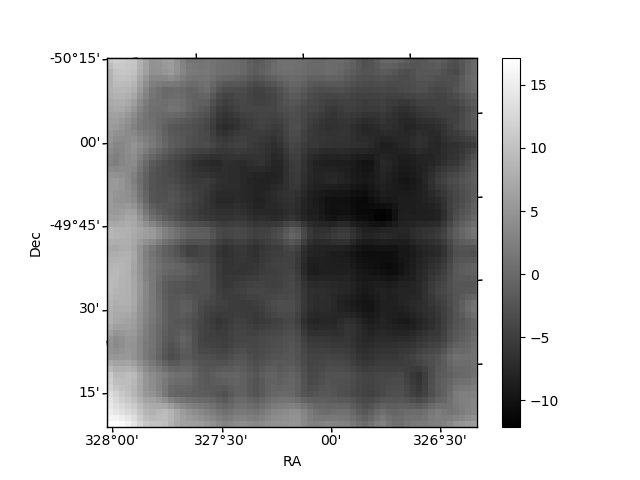
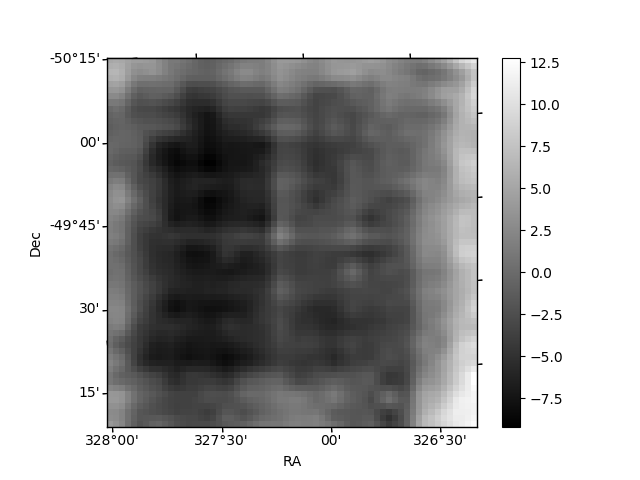
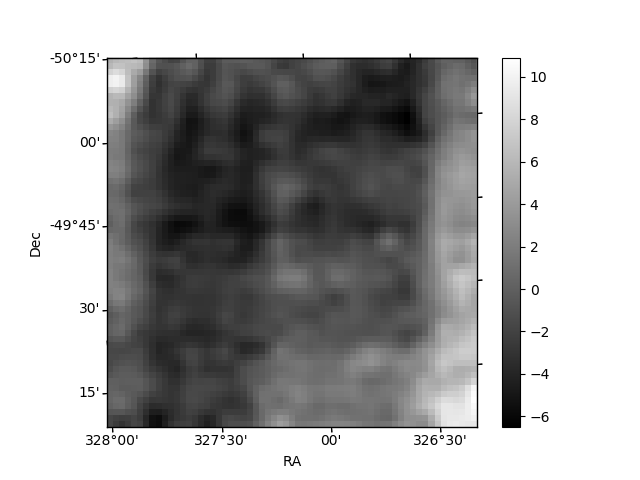
Histogram calculated using DETX and DETY for each event in the final _common_clean file
| Quadrant A | 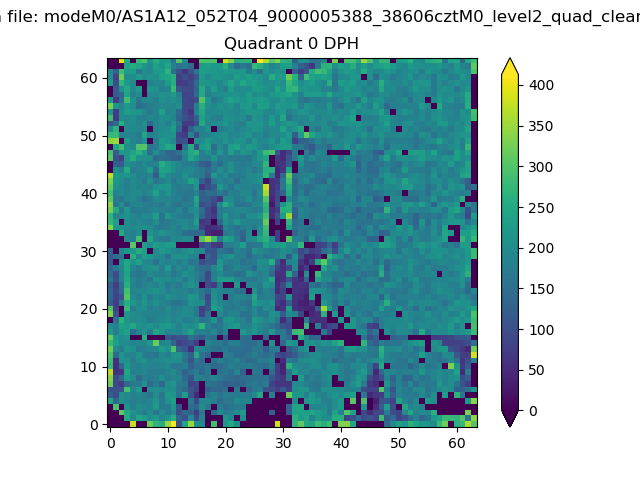 |
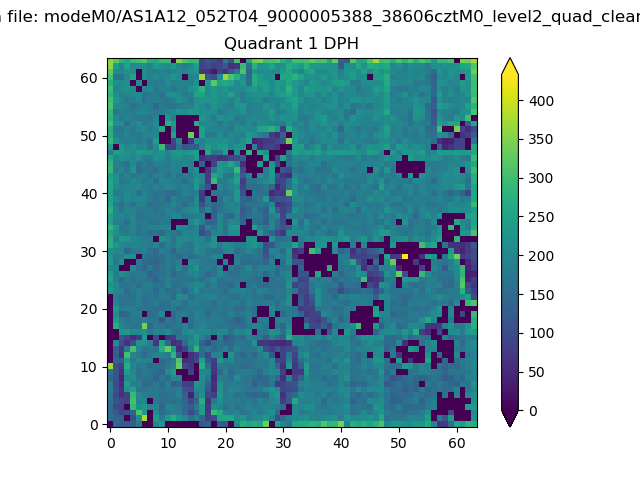 |
Quadrant B |
|---|---|---|---|
| Quadrant D | 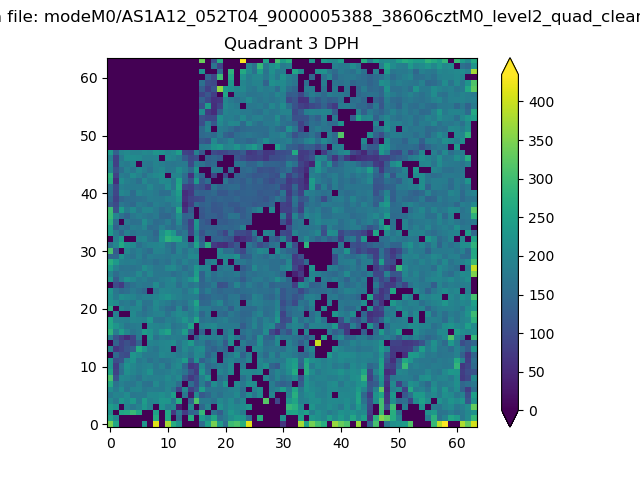 |
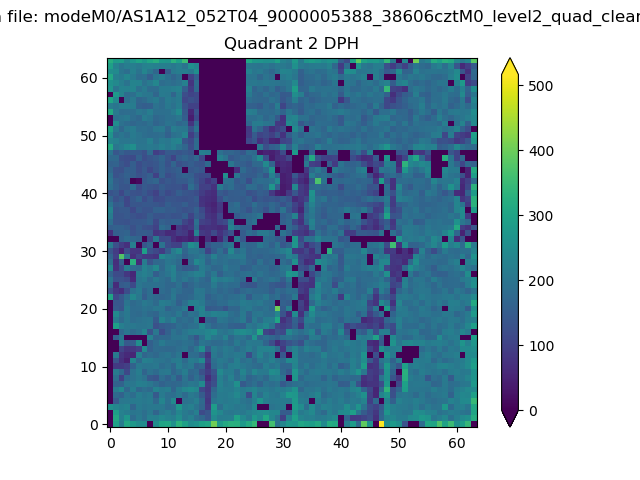 |
Quadrant C |
| Plot type | Count rate plots | Images |
|---|---|---|
| Comparison with Poisson distribution Blue bars denote a histogram of data divided into 1 sec bins. Red curve is a Poisson curve with rate = median count rate of data. |
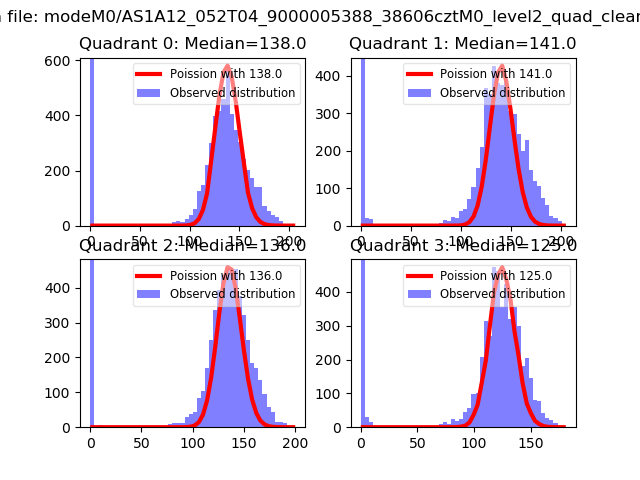 |
 |
| Quadrant-wise count rates Data is divided into 100 sec bins |
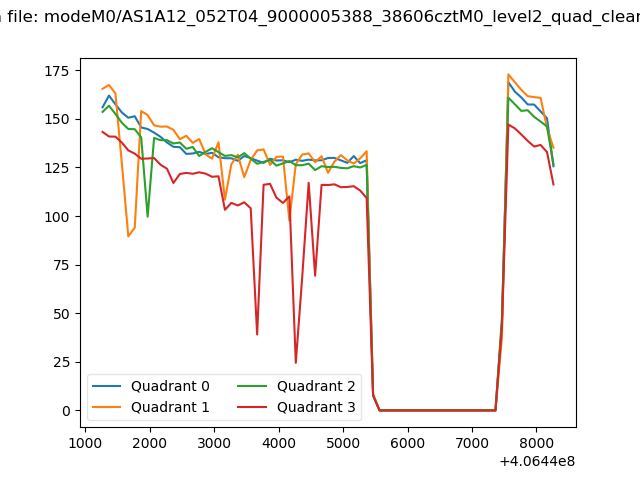 |
|
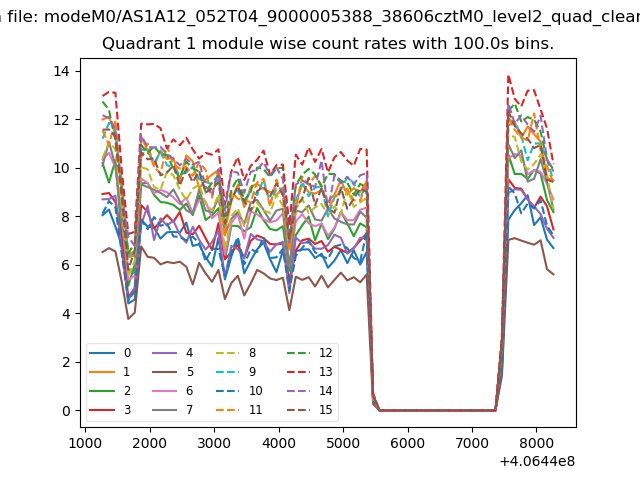
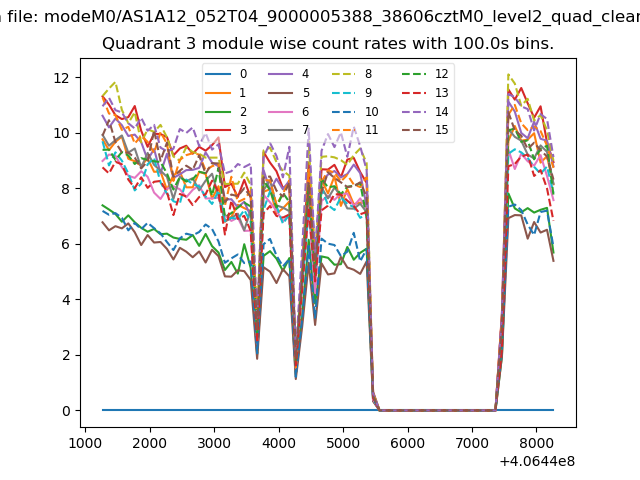
| Module-wise count rates for Quadrant A Data is divided into 100 sec bins |
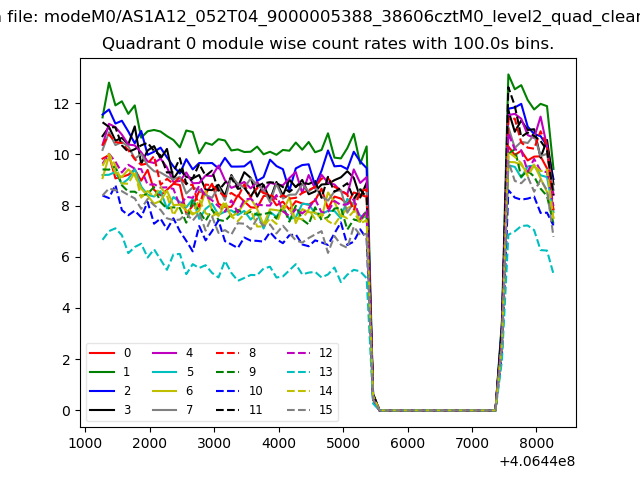 |
 |
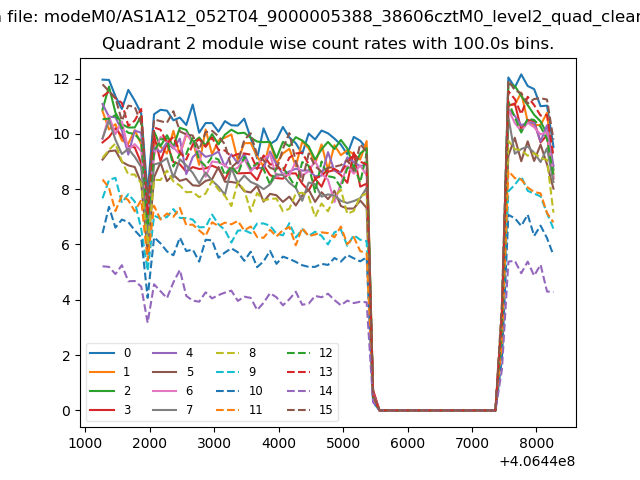
| Module-wise count rates for Quadrant B Data is divided into 100 sec bins |
 |
 |
| Module-wise count rates for Quadrant C Data is divided into 100 sec bins |
 |
 |
| Module-wise count rates for Quadrant D Data is divided into 100 sec bins |
 |
 |
| Parameter | Plot |
|---|---|
| CZT HV Monitor |  |
| D_VDD | 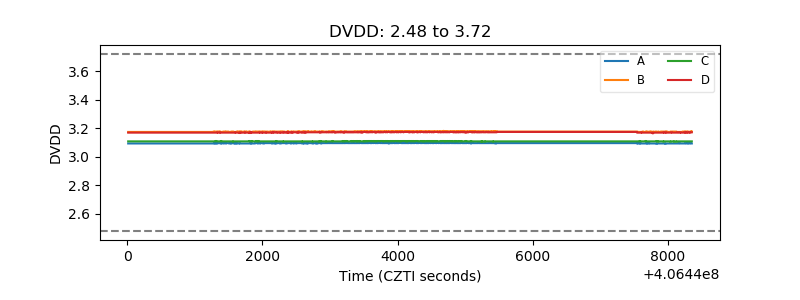 |
| Temperature 1 | 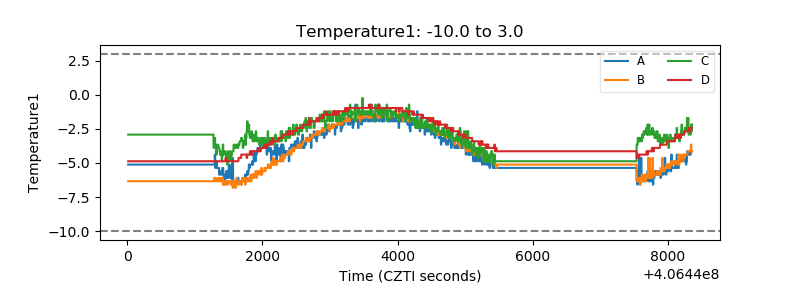 |
| Veto HV Monitor | 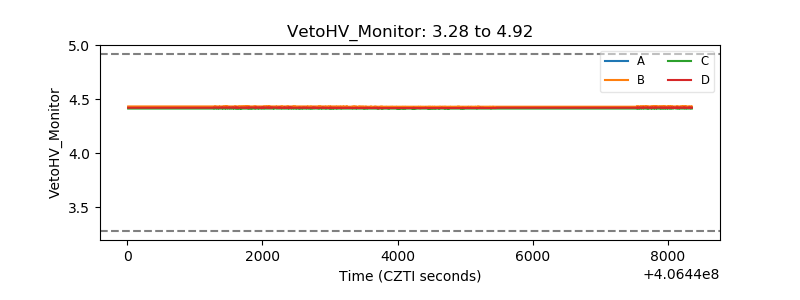 |
| Veto LLD | 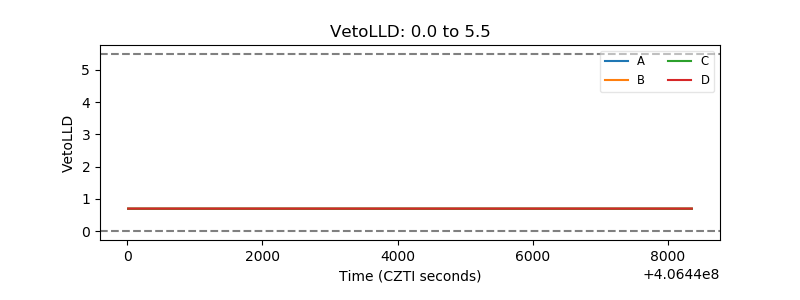 |
| Alpha Counter | 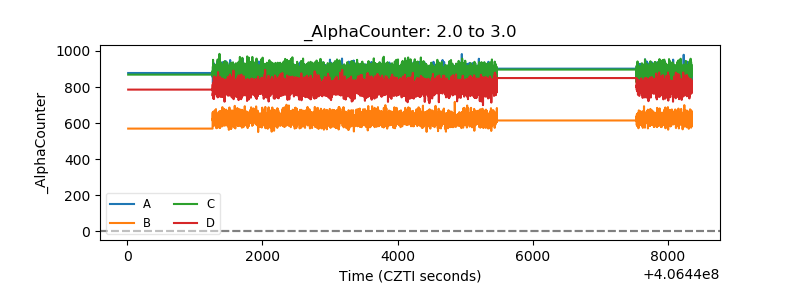 |
| _CPM_Rate | 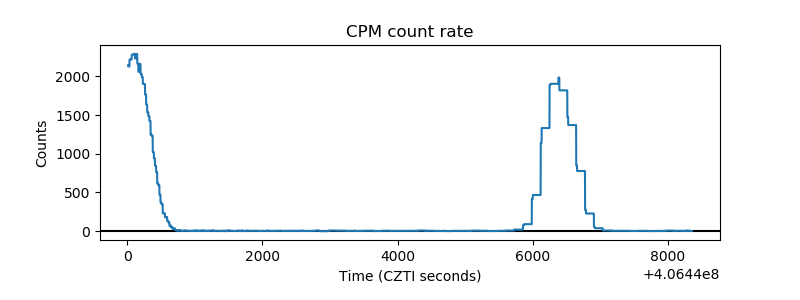 |
| CZT Counter | 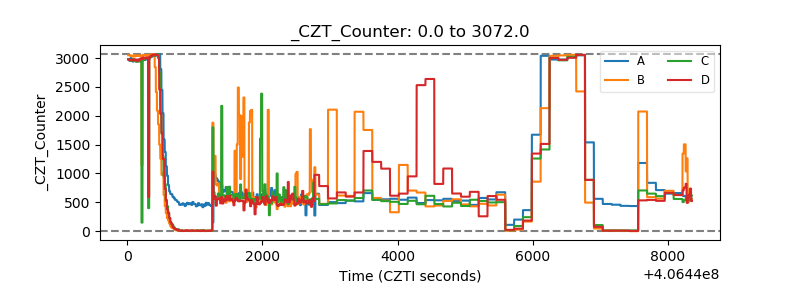 |
| +2.5 Volts monitor | 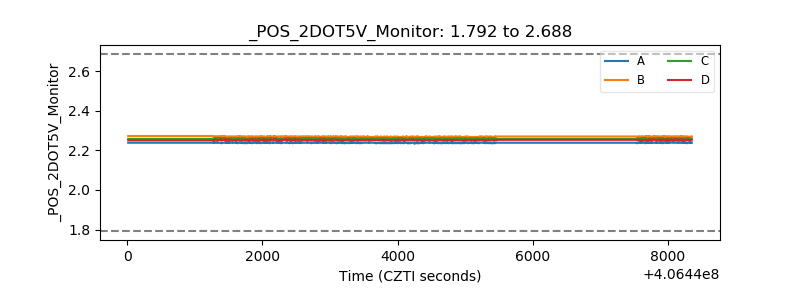 |
| +5 Volts monitor | 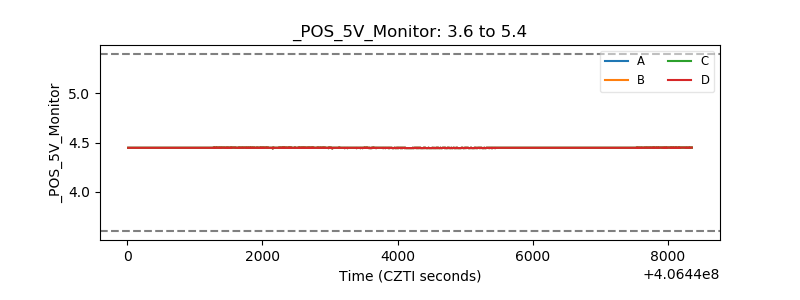 |
| _ROLL_ROT | 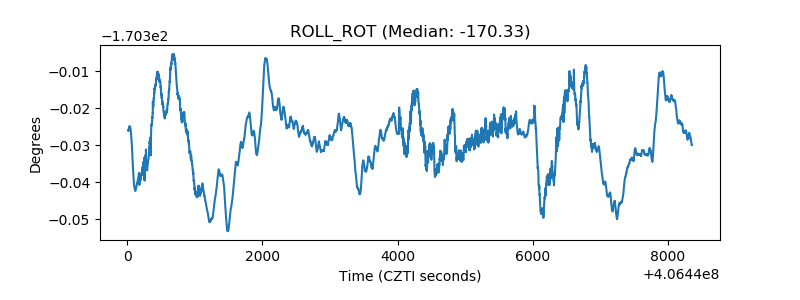 |
| _Roll_DEC | 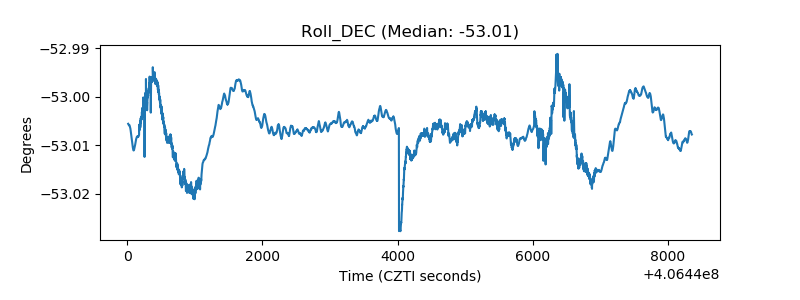 |
| _Roll_RA | 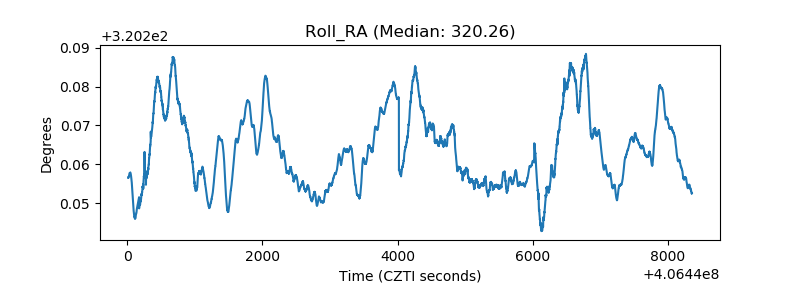 |
| Veto Counter | 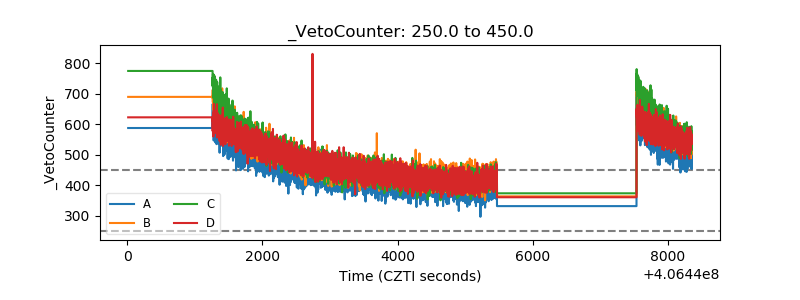 |