| Param | Original file | Final file |
|---|---|---|
| Filename | modeM0/AS1A12_052T04_9000005388_38607cztM0_level2.fits | modeM0/AS1A12_052T04_9000005388_38607cztM0_level2_quad_clean.evt |
| Size (bytes) | 368,769,600 | 98,556,480 |
| Size | 351.7 MB | 94.0 MB |
| Events in quadrant A | 2,896,652 | 684,028 |
| Events in quadrant B | 3,223,819 | 696,479 |
| Events in quadrant C | 2,701,744 | 671,091 |
| Events in quadrant D | 4,447,965 | 589,708 |
| Mode M0 | |||
|---|---|---|---|
| Quadrant | BADHDUFLAG | Total packets | Discarded packets |
| A | 0 | 11568 | 3 |
| B | 0 | 12715 | 2 |
| C | 0 | 10970 | 2 |
| D | 0 | 16472 | 2 |
| Mode SS | |||
|---|---|---|---|
| Quadrant | BADHDUFLAG | Total packets | Discarded packets |
| A | 0 | 100 | 0 |
| B | 0 | 100 | 0 |
| C | 0 | 100 | 0 |
| D | 0 | 100 | 0 |
| Mode M9 | |||
|---|---|---|---|
| Quadrant | BADHDUFLAG | Total packets | Discarded packets |
| A | 0 | 33 | 0 |
| B | 0 | 33 | 0 |
| C | 0 | 33 | 0 |
| D | 0 | 34 | 0 |
| Quadrant | Total seconds | Saturated seconds | Saturation percentage |
|---|---|---|---|
| A | 4894 | 14 | 0.286065% |
| B | 4894 | 76 | 1.552922% |
| C | 4894 | 16 | 0.326931% |
| D | 4894 | 340 | 6.947282% |
Noise dominated data is calculated using 1-second bins in cleaned event files. If a bin has >2000 counts, and if more than 50% of those come from <1% of pixels, then it is considered to be noise-dominated and hence unusable.
| Quadrant | # 1 sec bins | Bins with >0 counts | Bins with >2000 counts | High rate bins dominated by noise | Noise dominated (total time) | Noise dominated (detector-on time) | Marked lightcurve |
|---|---|---|---|---|---|---|---|
| A | 7047 | 4895 | 7 | 7 | 0.10% | 0.14% | 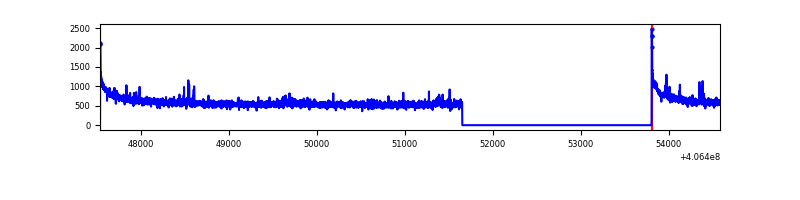 |
| B | 7047 | 4895 | 39 | 39 | 0.55% | 0.80% | 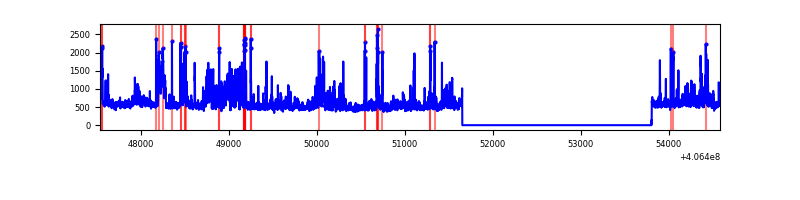 |
| C | 7047 | 4895 | 10 | 10 | 0.14% | 0.20% | 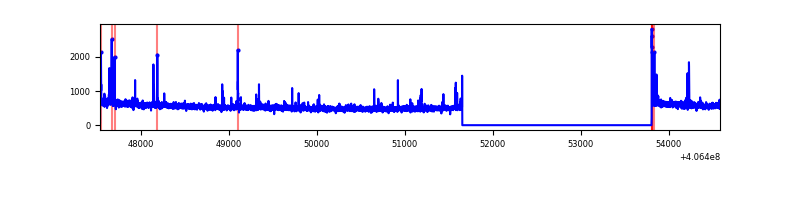 |
| D | 7047 | 4895 | 374 | 374 | 5.31% | 7.64% | 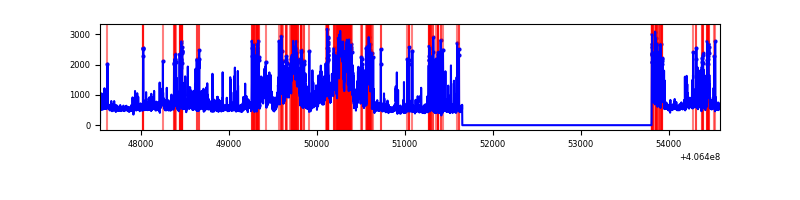 |
Top three noisy pixels from each quadrant. If the there are fewer than three noisy pixels in the level2.evt file, extra rows are filled as -1
| Pixel properties | Quadrant properties | ||||||
|---|---|---|---|---|---|---|---|
| Quadrant | DetID | PixID | Counts | Sigma | Mean | Median | Sigma |
| A | 10 | 83 | 403032 | 3208.3 | 627 | 618 | 125.4 |
| A | 13 | 248 | 33294 | 260.51 | 627 | 618 | 125.4 |
| A | 13 | 6 | 18455 | 142.21 | 627 | 618 | 125.4 |
| B | 5 | 184 | 264179 | 2293.6 | 616 | 604 | 114.9 |
| B | 0 | 183 | 224693 | 1950.0 | 616 | 604 | 114.9 |
| B | 5 | 200 | 69217 | 597.06 | 616 | 604 | 114.9 |
| C | 15 | 214 | 204017 | 1484.45 | 605 | 612 | 137.0 |
| C | 14 | 254 | 94573 | 685.73 | 605 | 612 | 137.0 |
| C | 0 | 10 | 20560 | 145.58 | 605 | 612 | 137.0 |
| D | 12 | 235 | 1174439 | 8122.73 | 598 | 585 | 144.5 |
| D | 1 | 47 | 402041 | 2777.96 | 598 | 585 | 144.5 |
| D | 10 | 118 | 200430 | 1382.87 | 598 | 585 | 144.5 |
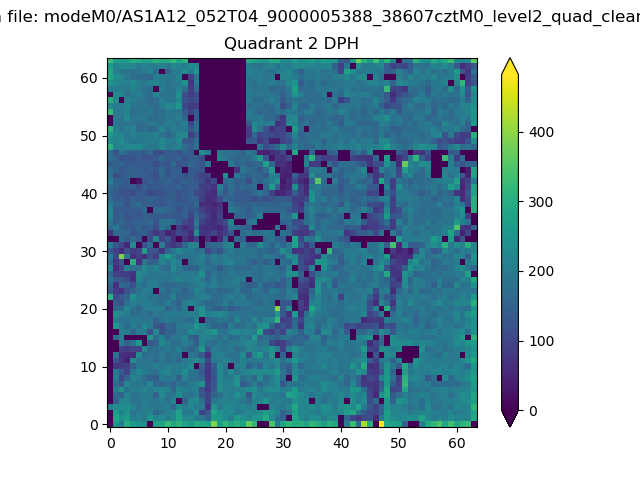
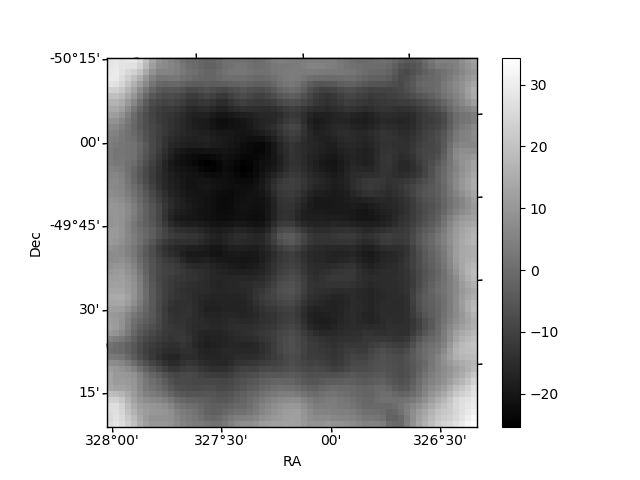
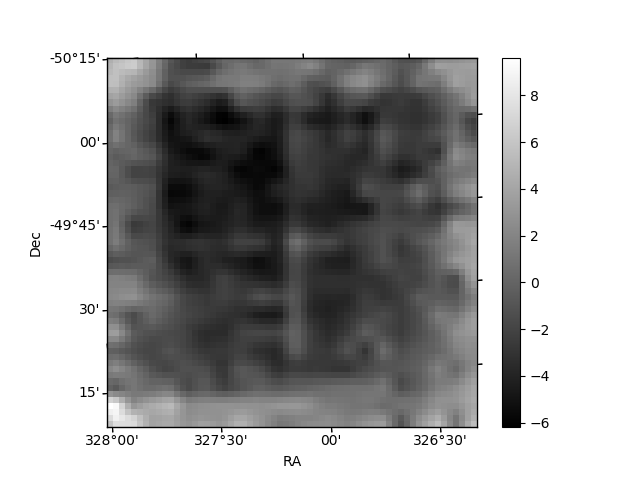
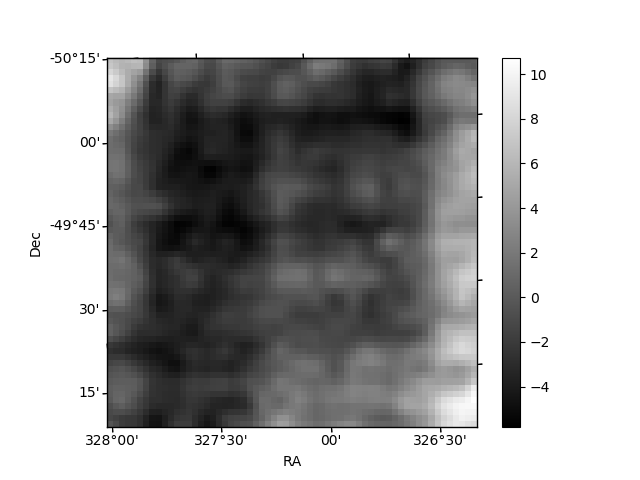
Histogram calculated using DETX and DETY for each event in the final _common_clean file
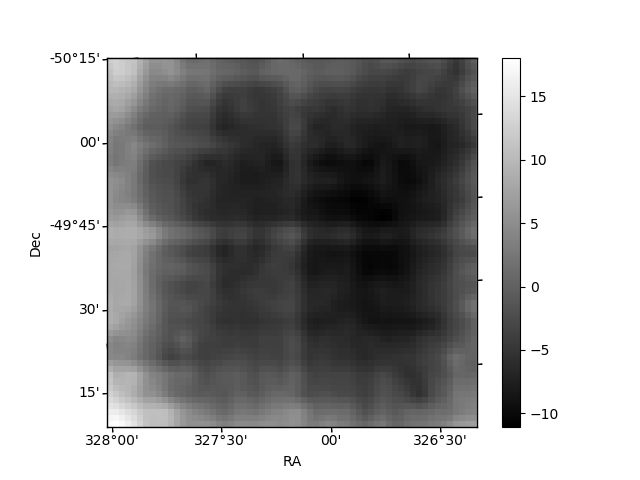
| Quadrant A | 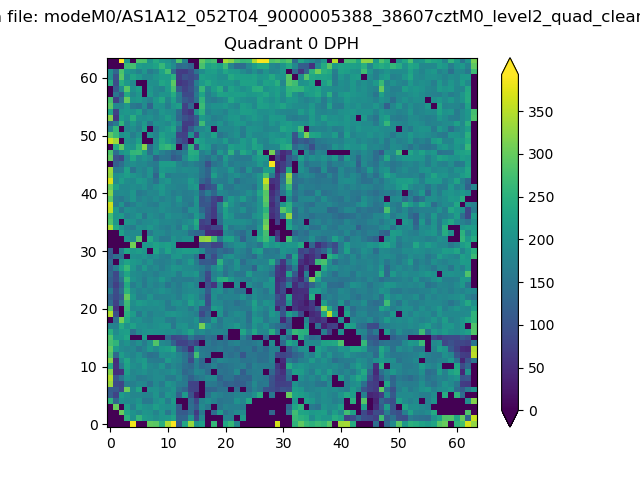 |
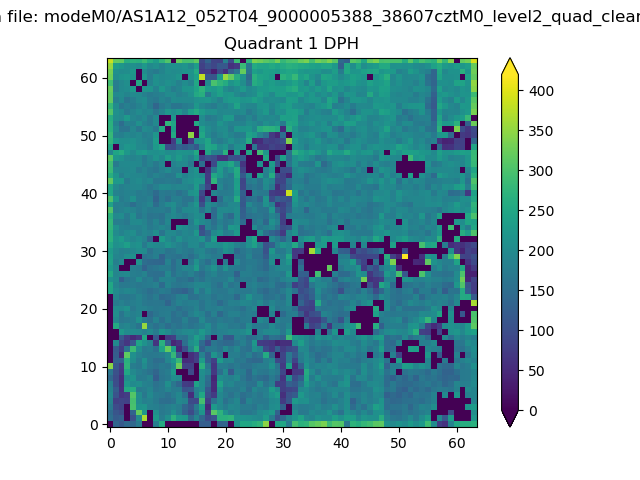 |
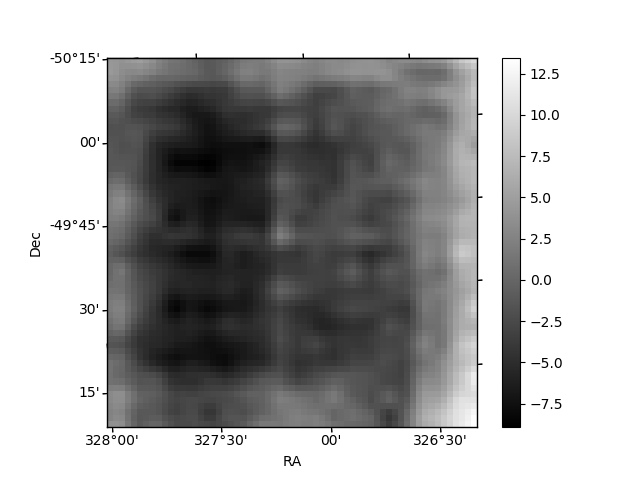
Quadrant B |
|---|---|---|---|
| Quadrant D | 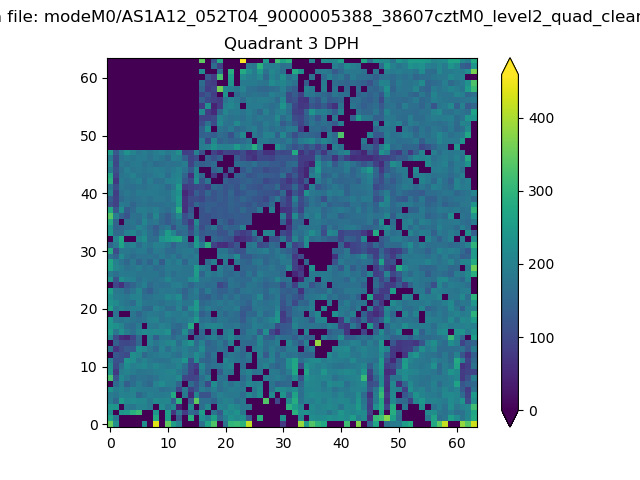 |
 |
Quadrant C |
| Plot type | Count rate plots | Images |
|---|---|---|
| Comparison with Poisson distribution Blue bars denote a histogram of data divided into 1 sec bins. Red curve is a Poisson curve with rate = median count rate of data. |
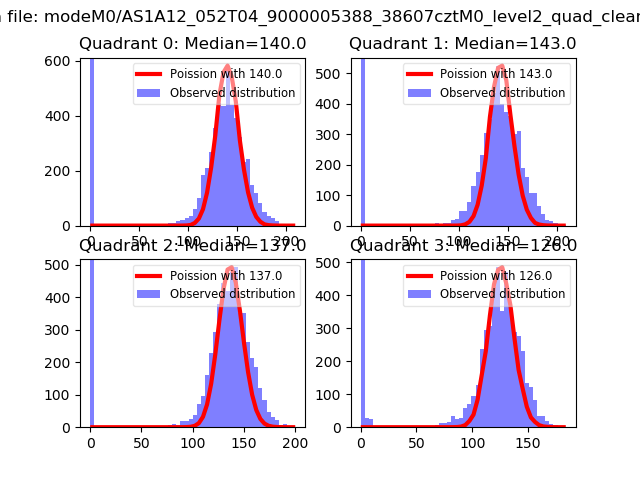 |
 |
| Quadrant-wise count rates Data is divided into 100 sec bins |
 |
|
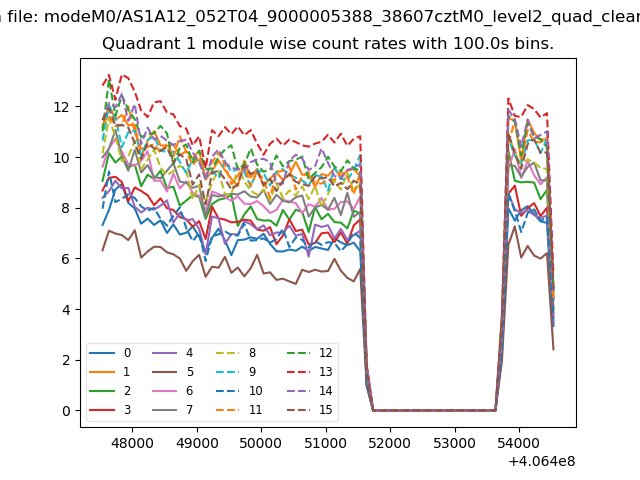
| Module-wise count rates for Quadrant A Data is divided into 100 sec bins |
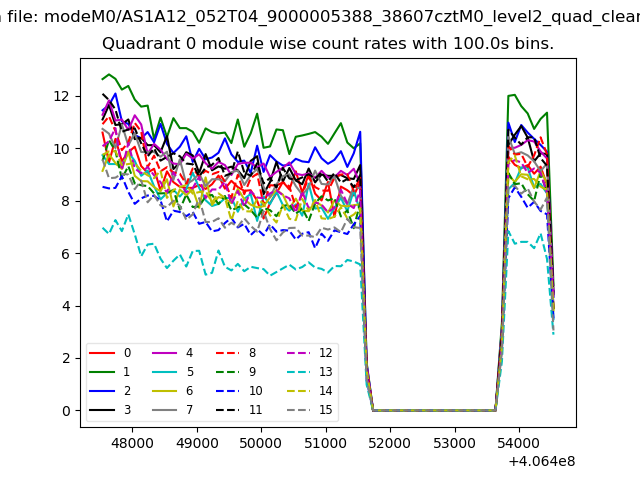 |
 |
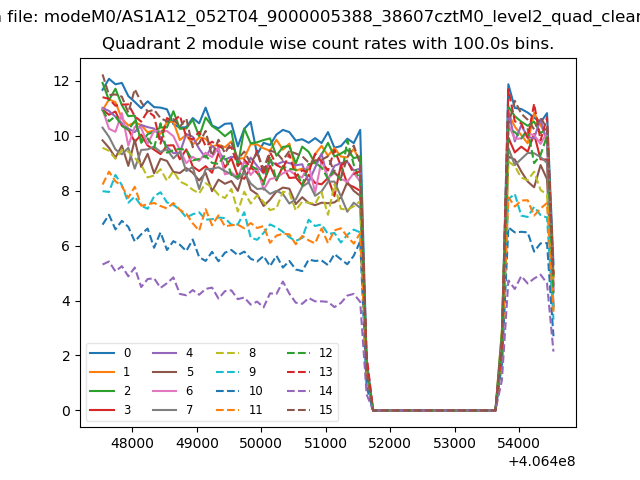
| Module-wise count rates for Quadrant B Data is divided into 100 sec bins |
 |
 |
| Module-wise count rates for Quadrant C Data is divided into 100 sec bins |
 |
 |
| Module-wise count rates for Quadrant D Data is divided into 100 sec bins |
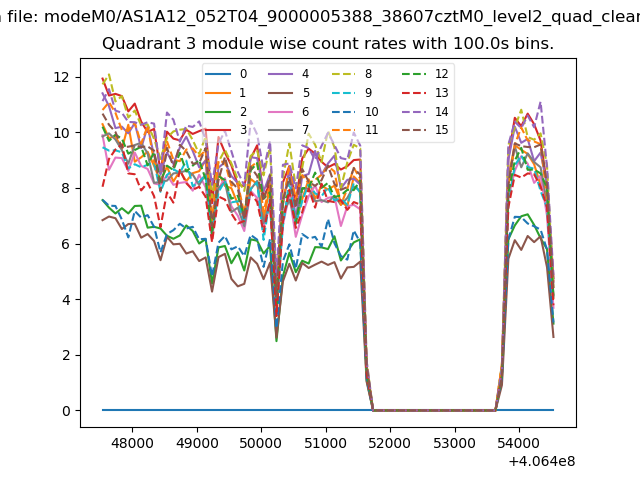 |
 |
| Parameter | Plot |
|---|---|
| CZT HV Monitor | 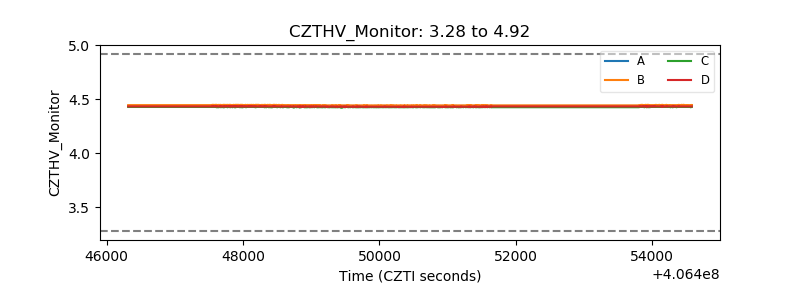 |
| D_VDD | 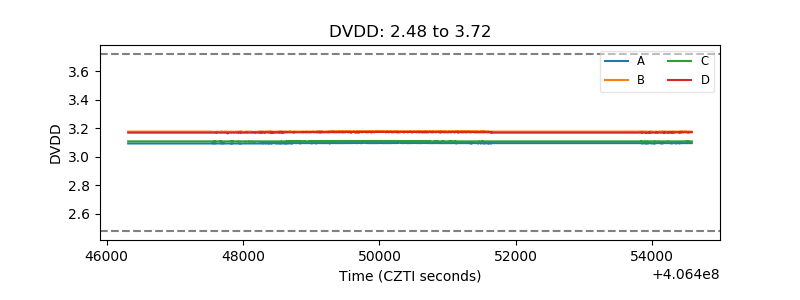 |
| Temperature 1 | 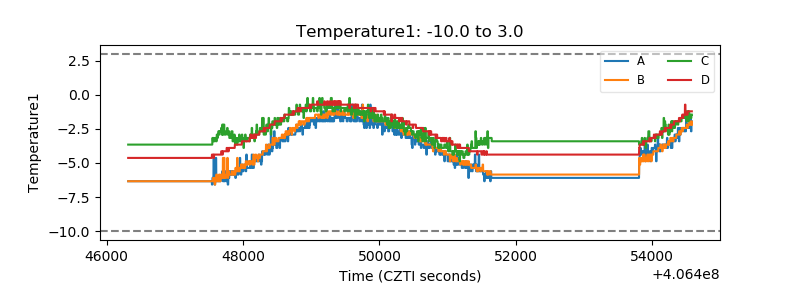 |
| Veto HV Monitor | 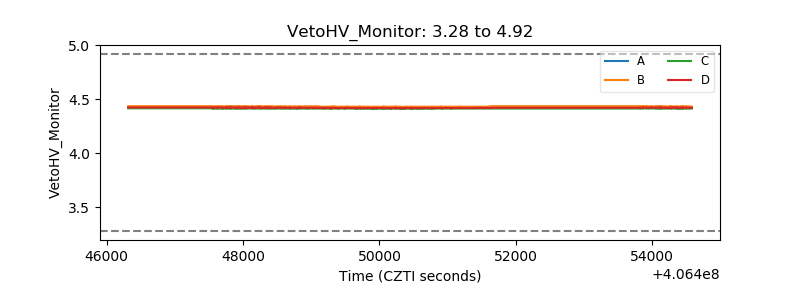 |
| Veto LLD | 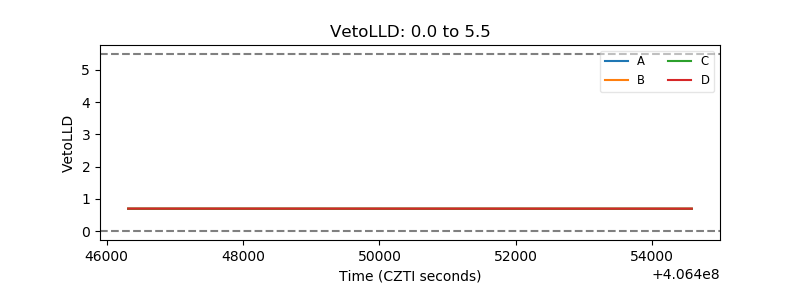 |
| Alpha Counter | 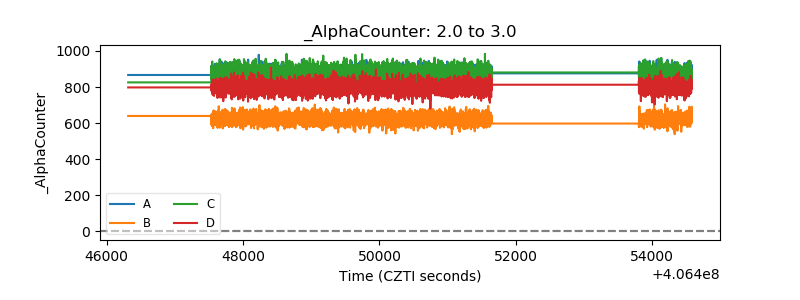 |
| _CPM_Rate | 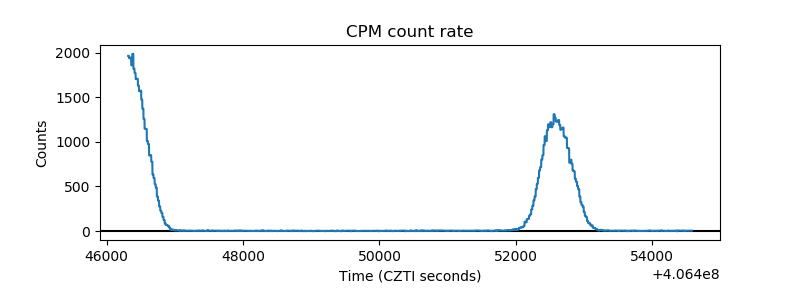 |
| CZT Counter | 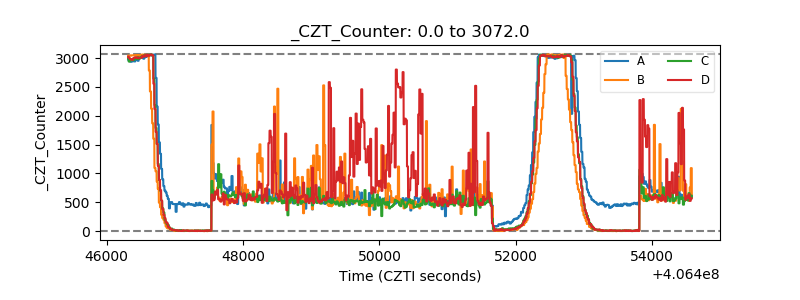 |
| +2.5 Volts monitor | 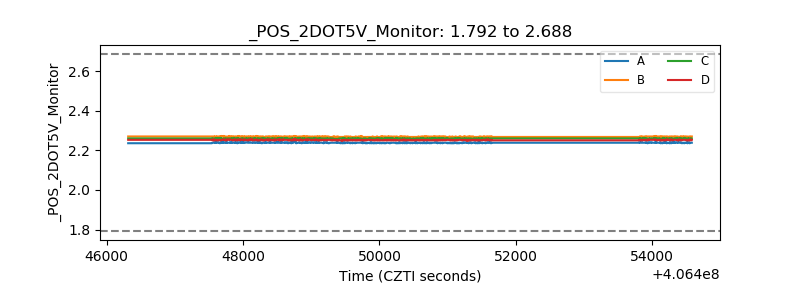 |
| +5 Volts monitor |  |
| _ROLL_ROT | 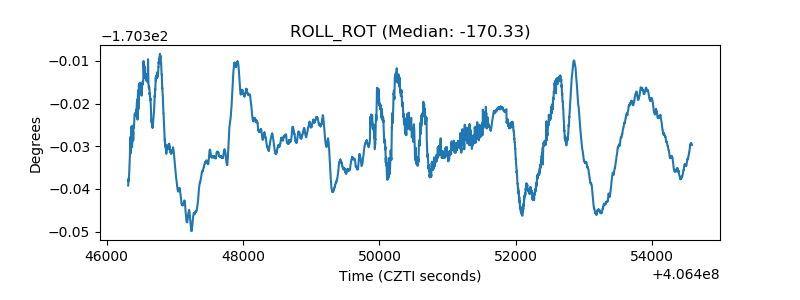 |
| _Roll_DEC | 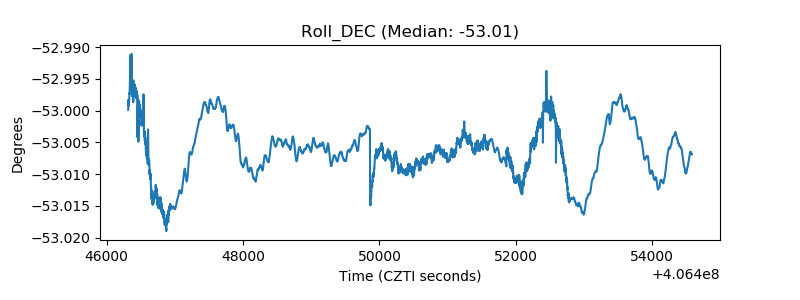 |
| _Roll_RA | 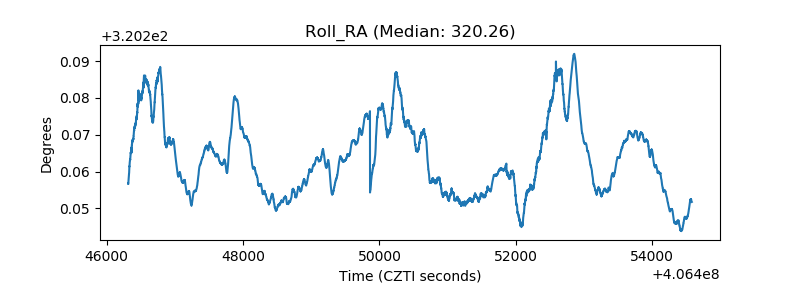 |
| Veto Counter | 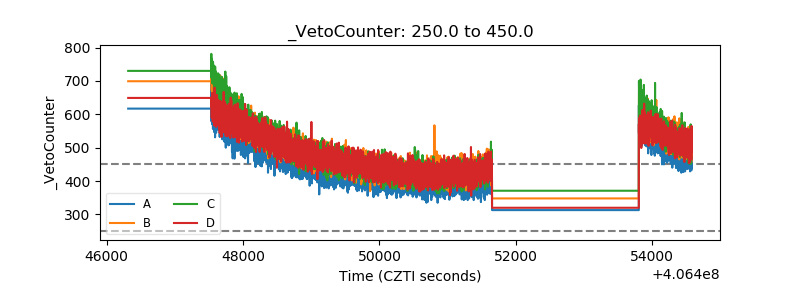 |