| Param | Original file | Final file |
|---|---|---|
| Filename | modeM0/AS1A12_052T04_9000005388_38608cztM0_level2.fits | modeM0/AS1A12_052T04_9000005388_38608cztM0_level2_quad_clean.evt |
| Size (bytes) | 369,449,280 | 94,567,680 |
| Size | 352.3 MB | 90.2 MB |
| Events in quadrant A | 2,919,609 | 656,517 |
| Events in quadrant B | 3,105,301 | 663,956 |
| Events in quadrant C | 2,749,172 | 638,351 |
| Events in quadrant D | 4,517,358 | 558,133 |
| Mode M0 | |||
|---|---|---|---|
| Quadrant | BADHDUFLAG | Total packets | Discarded packets |
| A | 0 | 11686 | 3 |
| B | 0 | 12378 | 2 |
| C | 0 | 11111 | 2 |
| D | 0 | 16791 | 2 |
| Mode SS | |||
|---|---|---|---|
| Quadrant | BADHDUFLAG | Total packets | Discarded packets |
| A | 0 | 102 | 0 |
| B | 0 | 102 | 0 |
| C | 0 | 102 | 0 |
| D | 0 | 102 | 0 |
| Mode M9 | |||
|---|---|---|---|
| Quadrant | BADHDUFLAG | Total packets | Discarded packets |
| A | 0 | 32 | 0 |
| B | 0 | 32 | 0 |
| C | 0 | 32 | 0 |
| D | 0 | 33 | 0 |
| Quadrant | Total seconds | Saturated seconds | Saturation percentage |
|---|---|---|---|
| A | 4941 | 14 | 0.283343% |
| B | 4941 | 88 | 1.781016% |
| C | 4941 | 41 | 0.829792% |
| D | 4941 | 417 | 8.439587% |
Noise dominated data is calculated using 1-second bins in cleaned event files. If a bin has >2000 counts, and if more than 50% of those come from <1% of pixels, then it is considered to be noise-dominated and hence unusable.
| Quadrant | # 1 sec bins | Bins with >0 counts | Bins with >2000 counts | High rate bins dominated by noise | Noise dominated (total time) | Noise dominated (detector-on time) | Marked lightcurve |
|---|---|---|---|---|---|---|---|
| A | 7095 | 4942 | 6 | 6 | 0.08% | 0.12% | 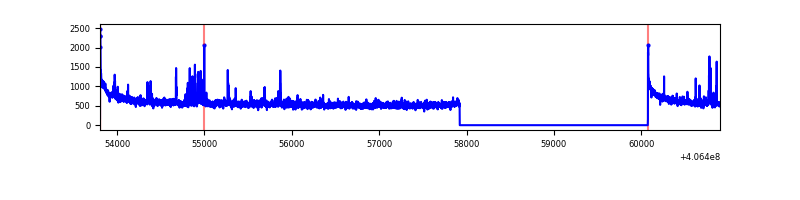 |
| B | 7095 | 4942 | 52 | 52 | 0.73% | 1.05% | 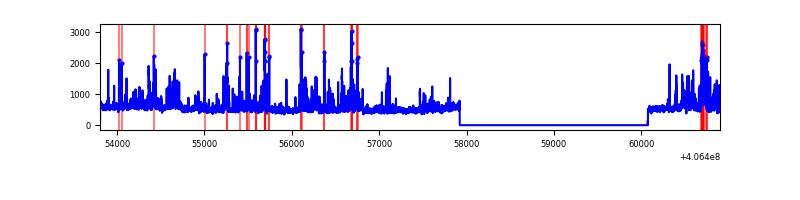 |
| C | 7095 | 4942 | 30 | 30 | 0.42% | 0.61% | 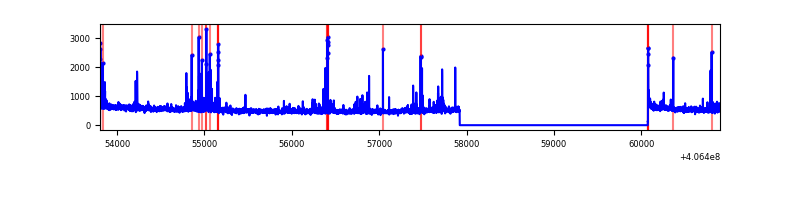 |
| D | 7095 | 4942 | 403 | 403 | 5.68% | 8.15% | 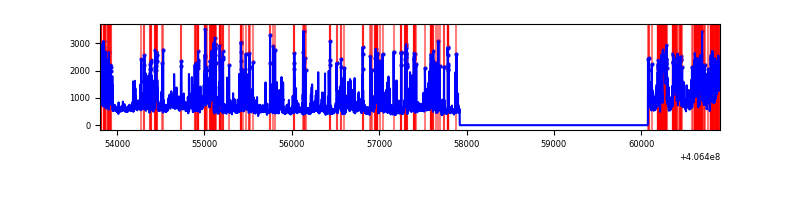 |
Top three noisy pixels from each quadrant. If the there are fewer than three noisy pixels in the level2.evt file, extra rows are filled as -1
| Pixel properties | Quadrant properties | ||||||
|---|---|---|---|---|---|---|---|
| Quadrant | DetID | PixID | Counts | Sigma | Mean | Median | Sigma |
| A | 10 | 83 | 429123 | 3505.11 | 609 | 597 | 122.3 |
| A | 13 | 248 | 78801 | 639.66 | 609 | 597 | 122.3 |
| A | 12 | 189 | 35767 | 287.67 | 609 | 597 | 122.3 |
| B | 0 | 183 | 345996 | 3062.33 | 598 | 584 | 112.8 |
| B | 5 | 184 | 204119 | 1804.49 | 598 | 584 | 112.8 |
| B | 0 | 229 | 61513 | 540.18 | 598 | 584 | 112.8 |
| C | 15 | 214 | 205845 | 1536.13 | 583 | 589 | 133.6 |
| C | 14 | 254 | 195531 | 1458.94 | 583 | 589 | 133.6 |
| C | 0 | 10 | 33097 | 243.29 | 583 | 589 | 133.6 |
| D | 2 | 250 | 517408 | 3714.42 | 572 | 557 | 139.1 |
| D | 12 | 235 | 423038 | 3036.22 | 572 | 557 | 139.1 |
| D | 12 | 227 | 357830 | 2567.59 | 572 | 557 | 139.1 |
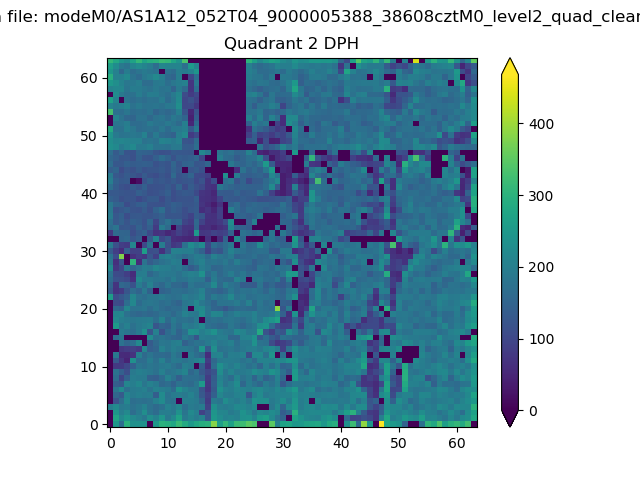
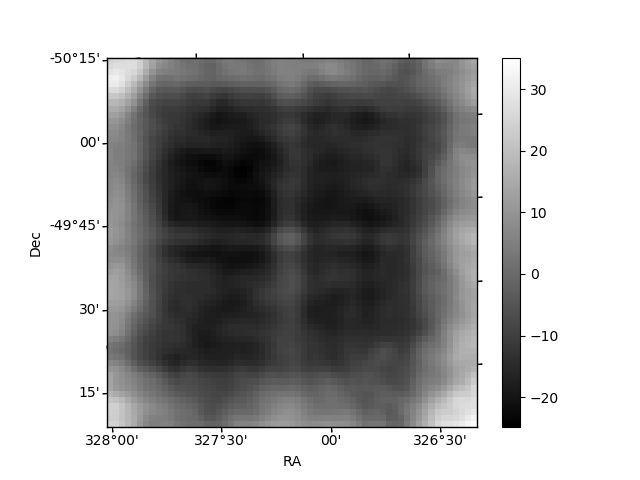
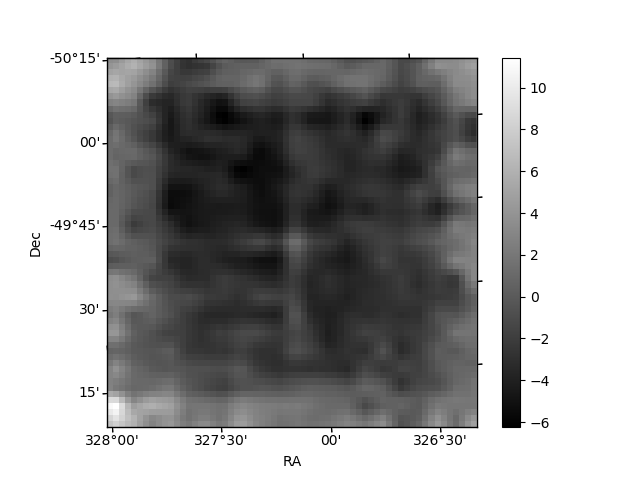
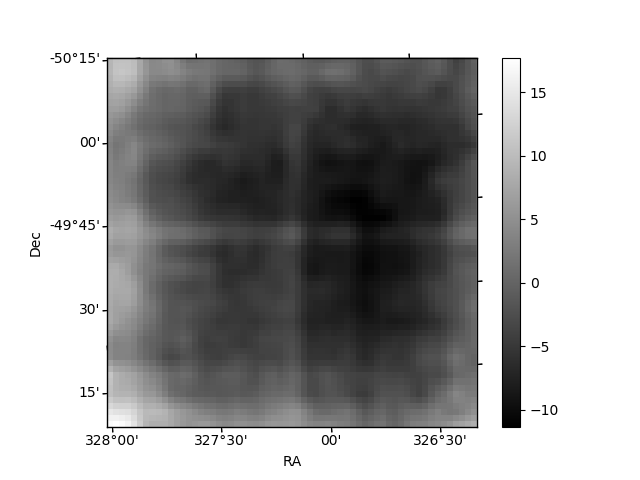
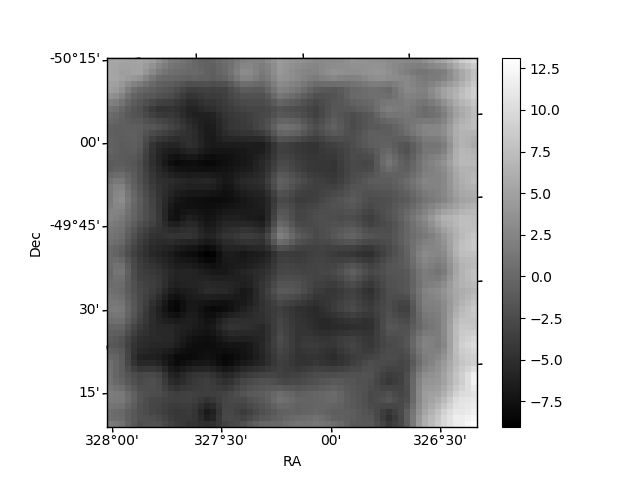
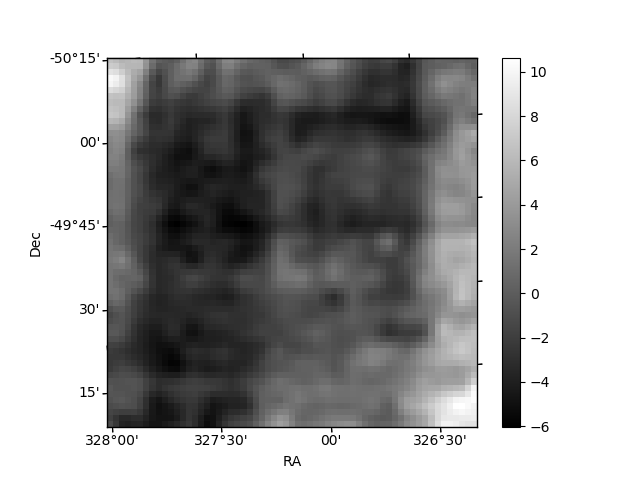
Histogram calculated using DETX and DETY for each event in the final _common_clean file
| Quadrant A | 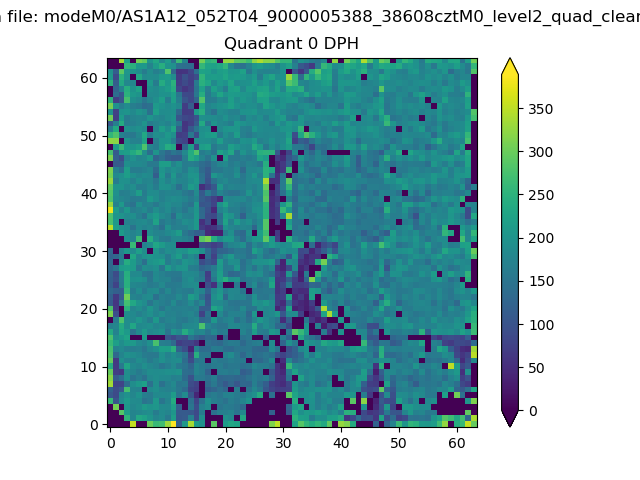 |
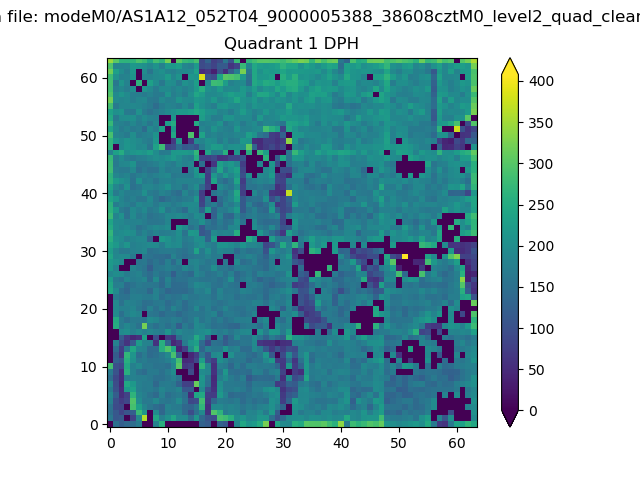 |
Quadrant B |
|---|---|---|---|
| Quadrant D | 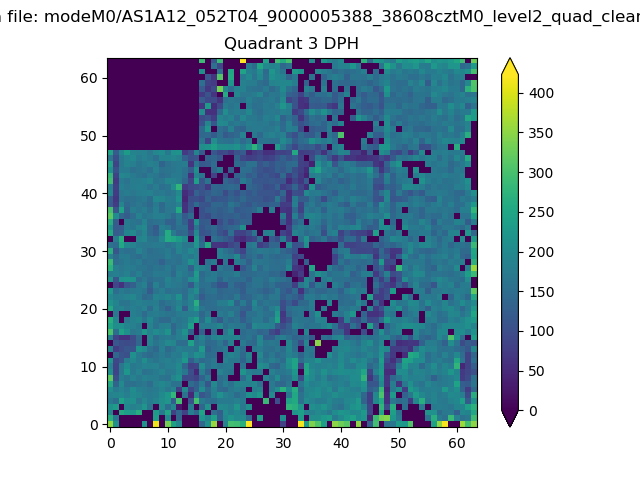 |
 |
Quadrant C |
| Plot type | Count rate plots | Images |
|---|---|---|
| Comparison with Poisson distribution Blue bars denote a histogram of data divided into 1 sec bins. Red curve is a Poisson curve with rate = median count rate of data. |
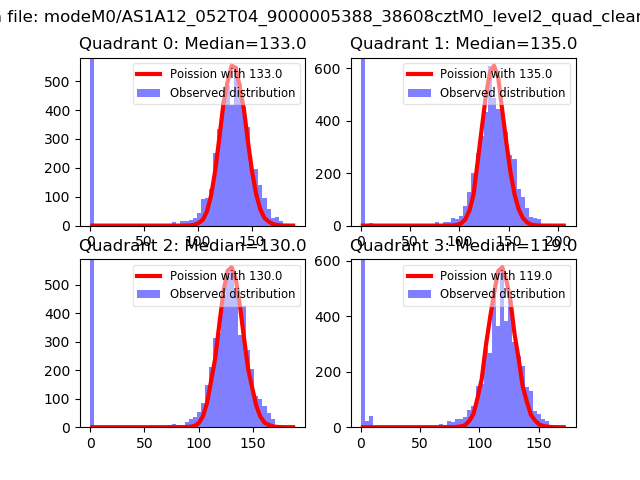 |
 |
| Quadrant-wise count rates Data is divided into 100 sec bins |
 |
|
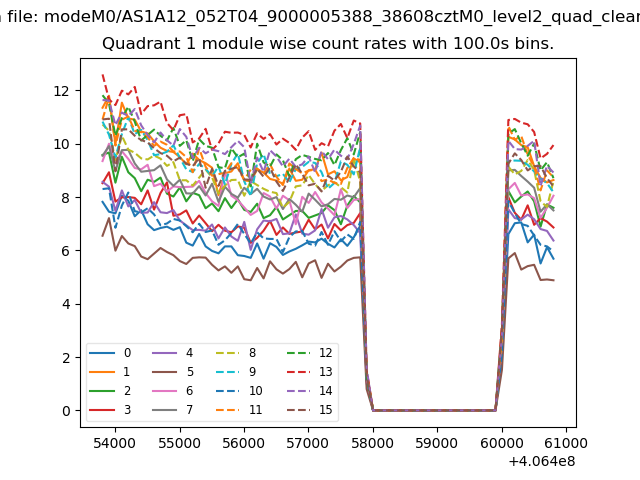
| Module-wise count rates for Quadrant A Data is divided into 100 sec bins |
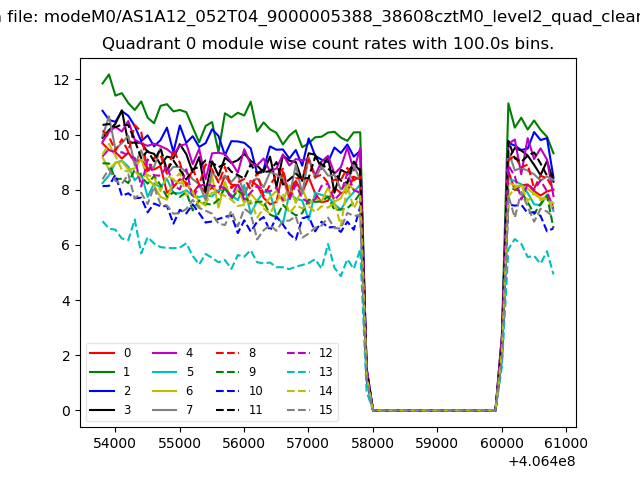 |
 |
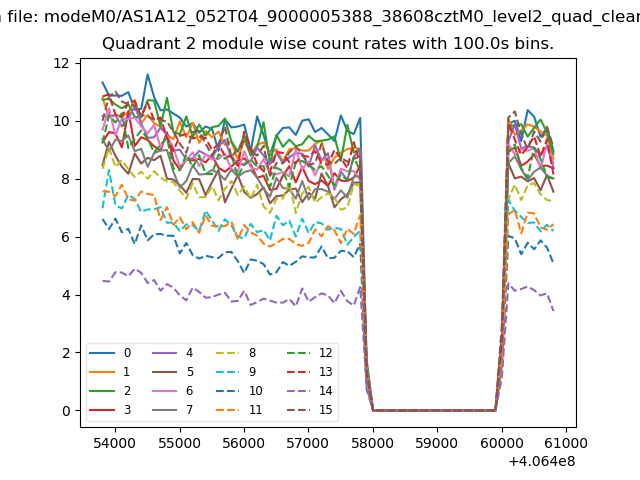
| Module-wise count rates for Quadrant B Data is divided into 100 sec bins |
 |
 |
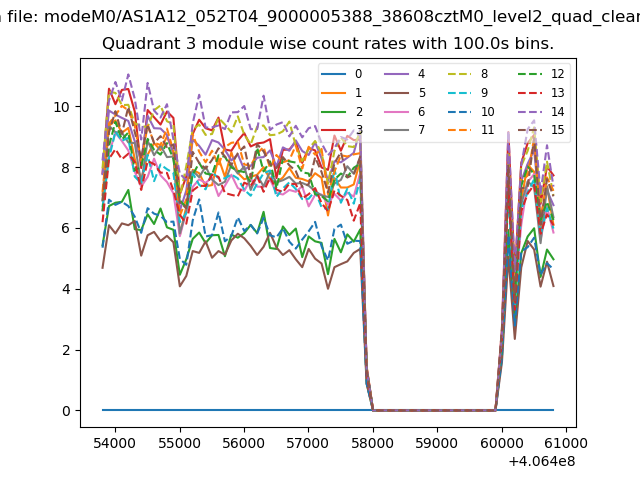
| Module-wise count rates for Quadrant C Data is divided into 100 sec bins |
 |
 |
| Module-wise count rates for Quadrant D Data is divided into 100 sec bins |
 |
 |
| Parameter | Plot |
|---|---|
| CZT HV Monitor | 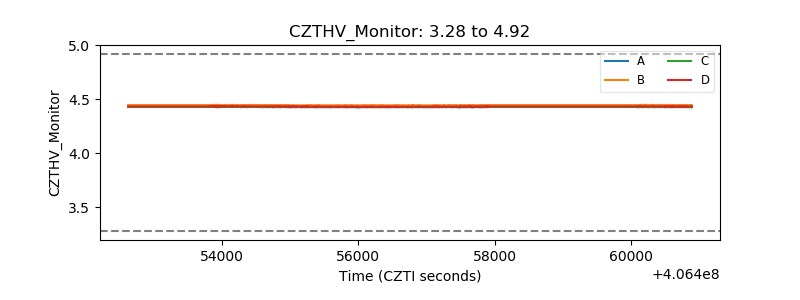 |
| D_VDD |  |
| Temperature 1 | 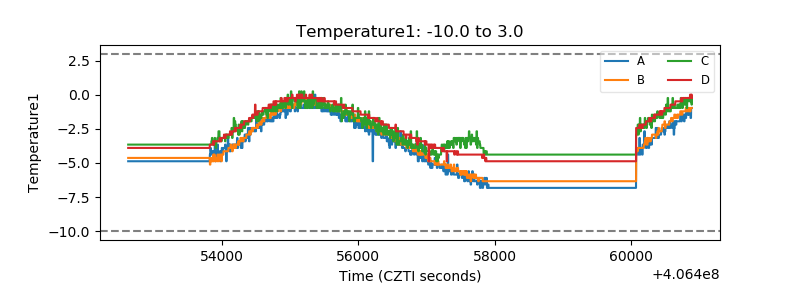 |
| Veto HV Monitor | 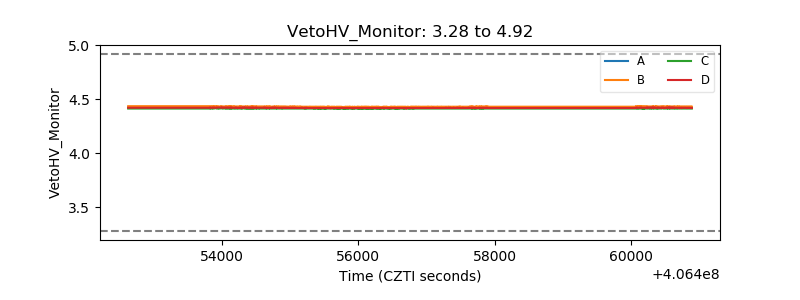 |
| Veto LLD | 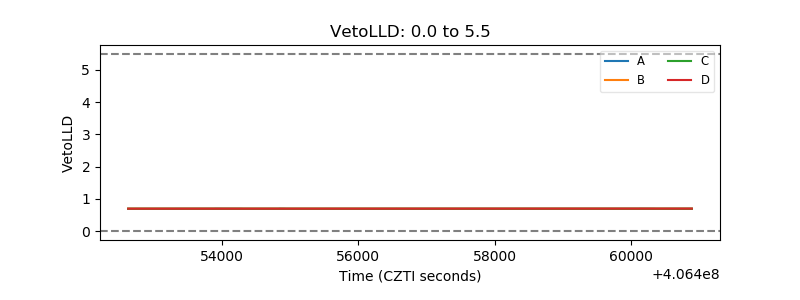 |
| Alpha Counter | 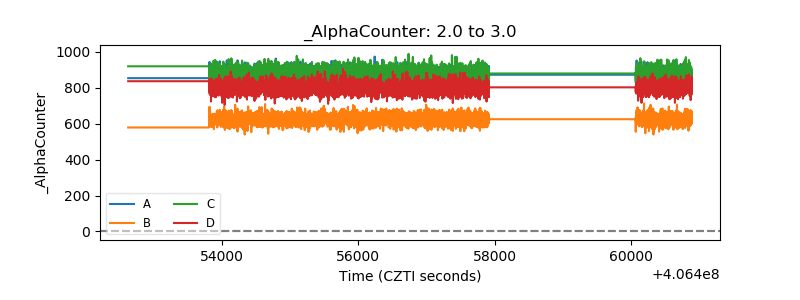 |
| _CPM_Rate | 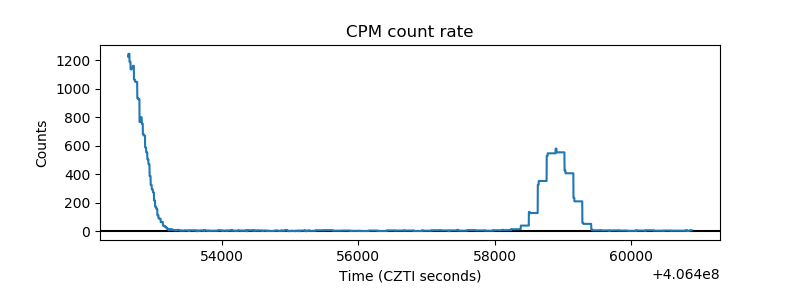 |
| CZT Counter | 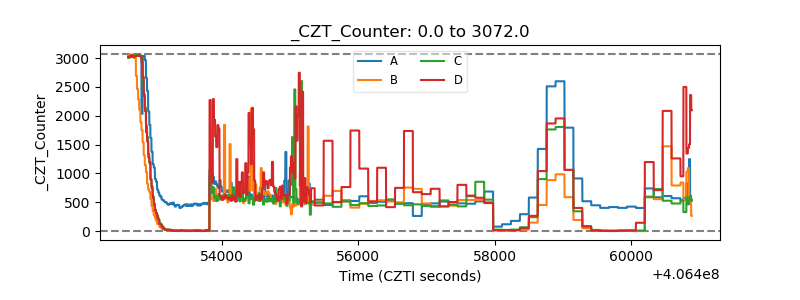 |
| +2.5 Volts monitor | 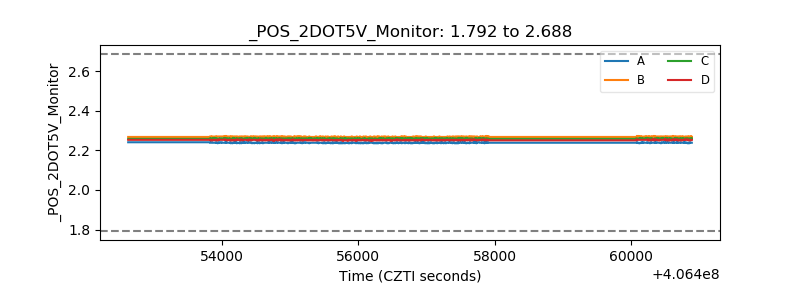 |
| +5 Volts monitor |  |
| _ROLL_ROT | 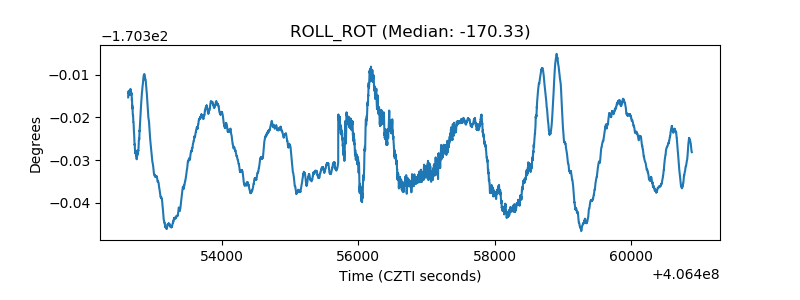 |
| _Roll_DEC | 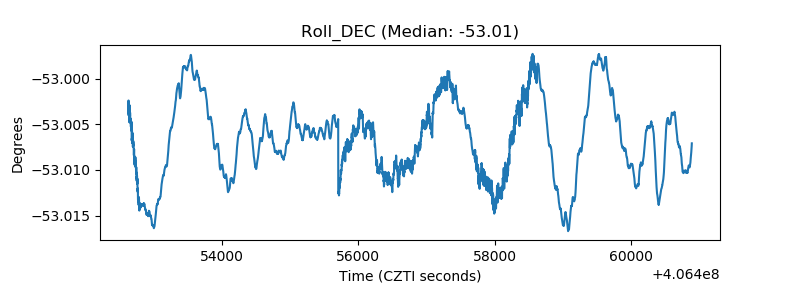 |
| _Roll_RA | 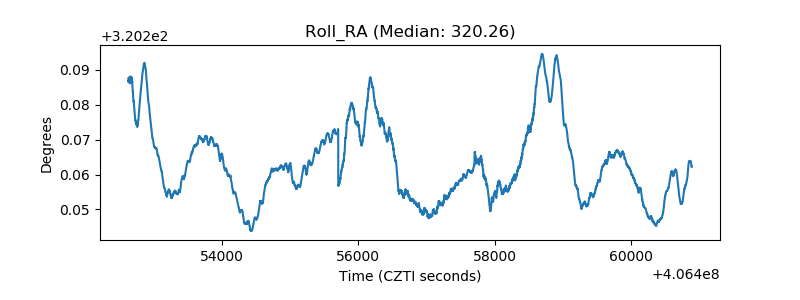 |
| Veto Counter | 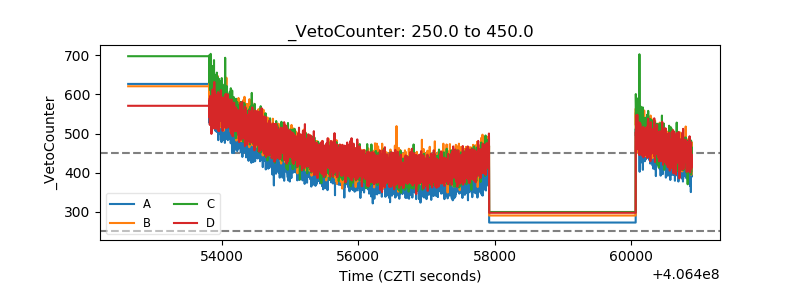 |