| Param | Original file | Final file |
|---|---|---|
| Filename | modeM0/AS1A12_052T04_9000005388_38609cztM0_level2.fits | modeM0/AS1A12_052T04_9000005388_38609cztM0_level2_quad_clean.evt |
| Size (bytes) | 454,504,320 | 92,856,960 |
| Size | 433.4 MB | 88.6 MB |
| Events in quadrant A | 3,237,860 | 656,802 |
| Events in quadrant B | 3,462,194 | 657,353 |
| Events in quadrant C | 2,840,065 | 642,617 |
| Events in quadrant D | 6,868,488 | 480,121 |
| Mode M0 | |||
|---|---|---|---|
| Quadrant | BADHDUFLAG | Total packets | Discarded packets |
| A | 0 | 12883 | 3 |
| B | 0 | 13681 | 2 |
| C | 0 | 11601 | 2 |
| D | 0 | 24093 | 2 |
| Mode SS | |||
|---|---|---|---|
| Quadrant | BADHDUFLAG | Total packets | Discarded packets |
| A | 0 | 110 | 0 |
| B | 0 | 110 | 0 |
| C | 0 | 110 | 0 |
| D | 0 | 110 | 0 |
| Mode M9 | |||
|---|---|---|---|
| Quadrant | BADHDUFLAG | Total packets | Discarded packets |
| A | 0 | 21 | 0 |
| B | 0 | 21 | 0 |
| C | 0 | 21 | 0 |
| D | 0 | 22 | 0 |
| Quadrant | Total seconds | Saturated seconds | Saturation percentage |
|---|---|---|---|
| A | 5349 | 40 | 0.747803% |
| B | 5349 | 171 | 3.196859% |
| C | 5349 | 26 | 0.486072% |
| D | 5349 | 1234 | 23.069733% |
Noise dominated data is calculated using 1-second bins in cleaned event files. If a bin has >2000 counts, and if more than 50% of those come from <1% of pixels, then it is considered to be noise-dominated and hence unusable.
| Quadrant | # 1 sec bins | Bins with >0 counts | Bins with >2000 counts | High rate bins dominated by noise | Noise dominated (total time) | Noise dominated (detector-on time) | Marked lightcurve |
|---|---|---|---|---|---|---|---|
| A | 7351 | 5349 | 34 | 34 | 0.46% | 0.64% | 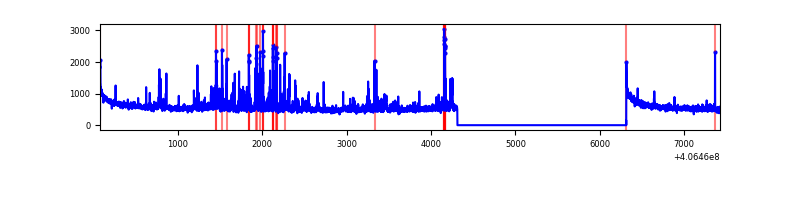 |
| B | 7351 | 5349 | 131 | 131 | 1.78% | 2.45% | 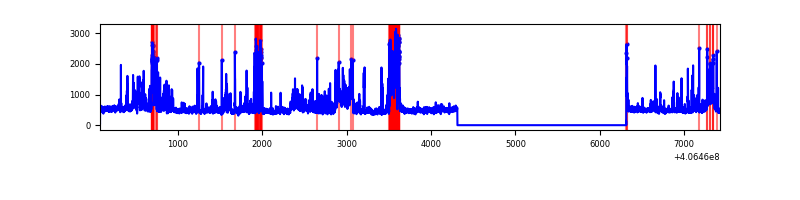 |
| C | 7351 | 5349 | 25 | 25 | 0.34% | 0.47% | 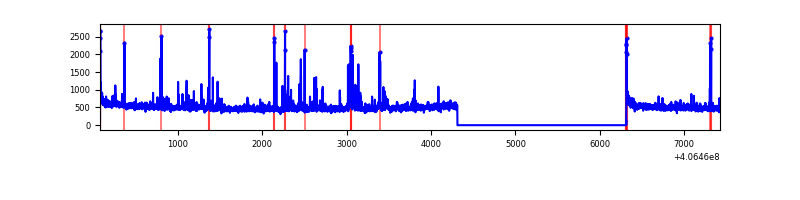 |
| D | 7351 | 5350 | 1324 | 1324 | 18.01% | 24.75% | 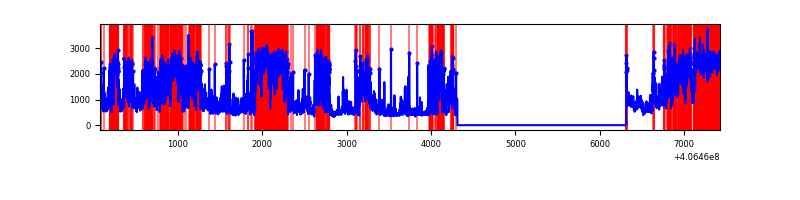 |
Top three noisy pixels from each quadrant. If the there are fewer than three noisy pixels in the level2.evt file, extra rows are filled as -1
| Pixel properties | Quadrant properties | ||||||
|---|---|---|---|---|---|---|---|
| Quadrant | DetID | PixID | Counts | Sigma | Mean | Median | Sigma |
| A | 10 | 83 | 441834 | 3478.11 | 622 | 611 | 126.9 |
| A | 13 | 248 | 330079 | 2597.16 | 622 | 611 | 126.9 |
| A | 9 | 254 | 30011 | 231.76 | 622 | 611 | 126.9 |
| B | 0 | 183 | 428155 | 3687.58 | 609 | 593 | 115.9 |
| B | 5 | 184 | 388772 | 3347.92 | 609 | 593 | 115.9 |
| B | 0 | 186 | 46765 | 398.22 | 609 | 593 | 115.9 |
| C | 15 | 214 | 223265 | 1605.37 | 599 | 603 | 138.7 |
| C | 14 | 254 | 180521 | 1297.19 | 599 | 603 | 138.7 |
| C | 0 | 10 | 40019 | 284.18 | 599 | 603 | 138.7 |
| D | 12 | 227 | 2188217 | 16088.8 | 557 | 541 | 136.0 |
| D | 12 | 235 | 1123056 | 8255.3 | 557 | 541 | 136.0 |
| D | 13 | 249 | 335785 | 2465.48 | 557 | 541 | 136.0 |
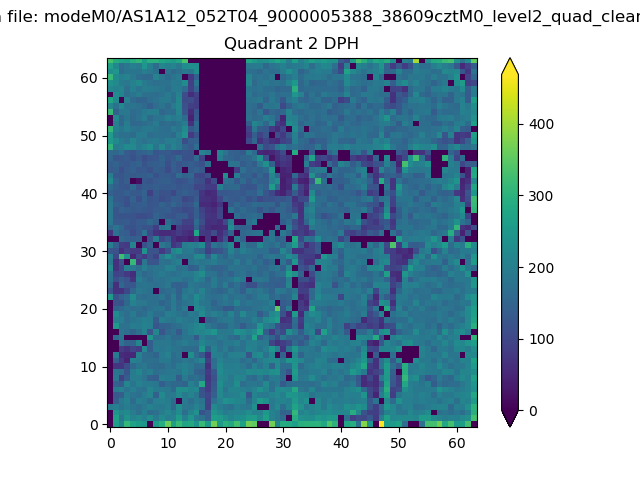
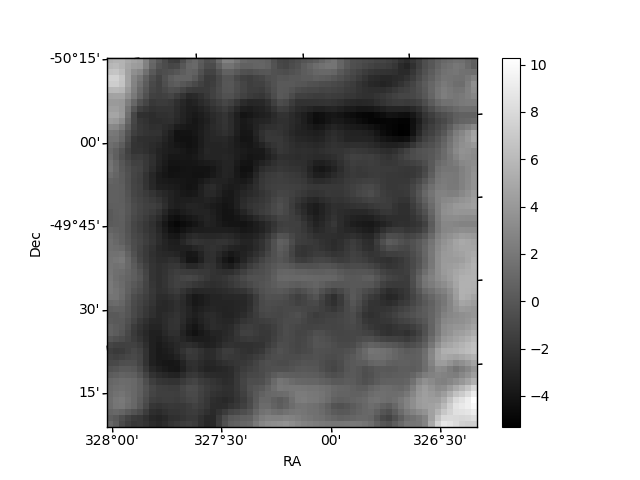
Histogram calculated using DETX and DETY for each event in the final _common_clean file
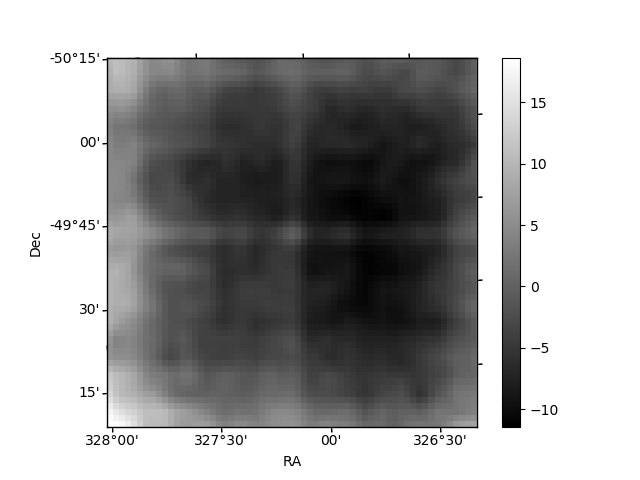
| Quadrant A | 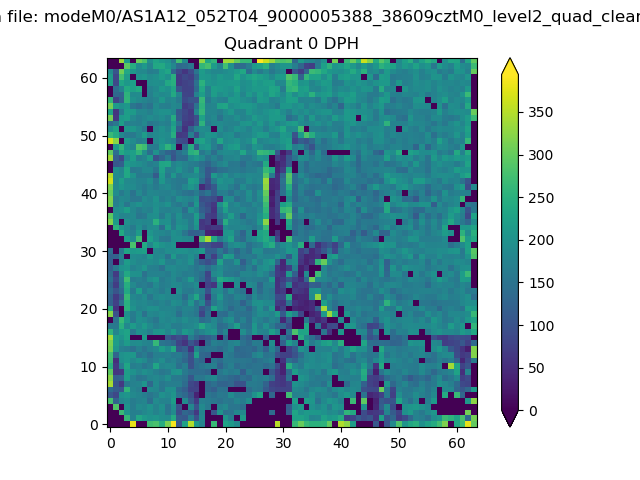 |
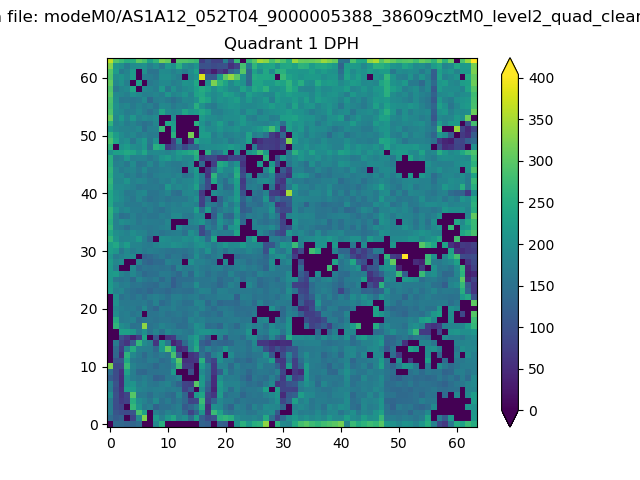 |
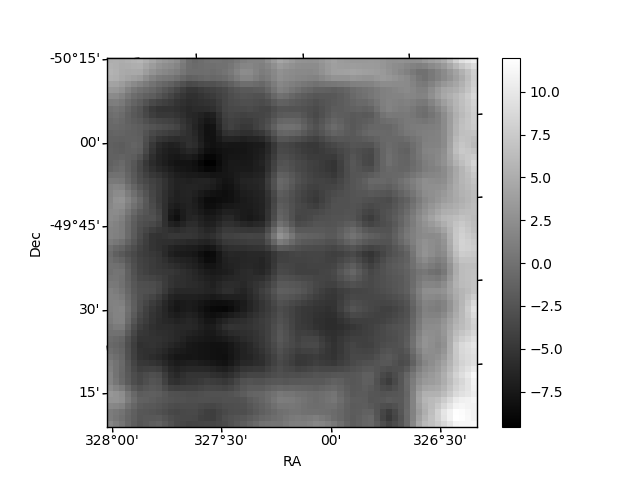
Quadrant B |
|---|---|---|---|
| Quadrant D | 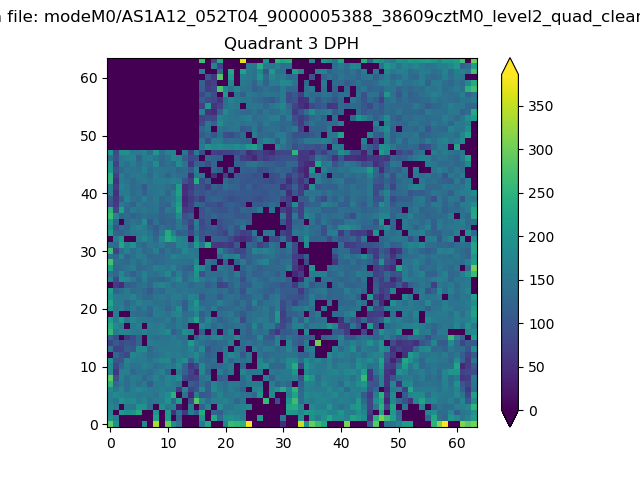 |
 |
Quadrant C |
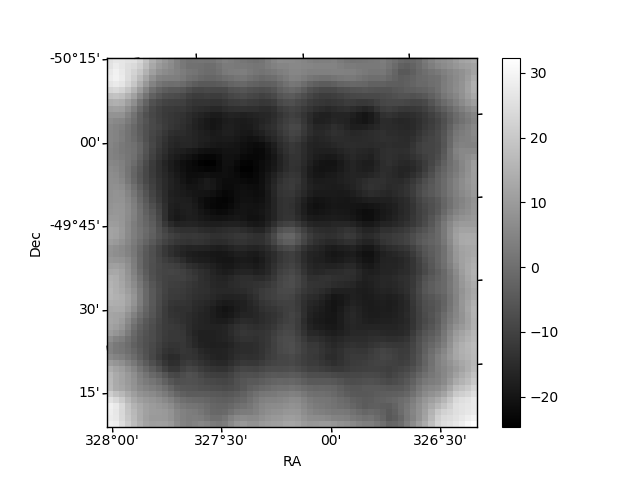
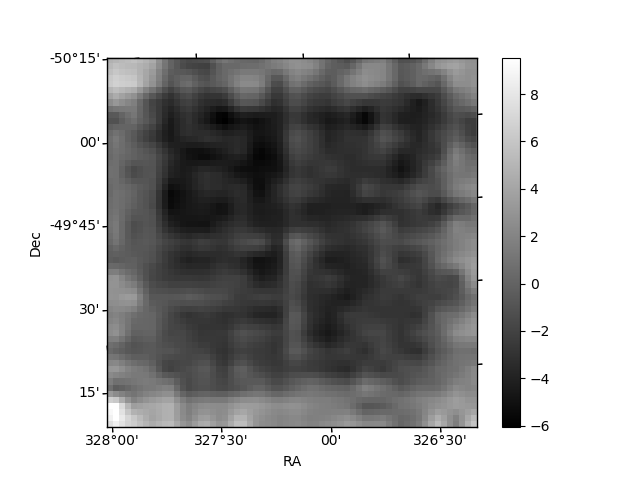
| Plot type | Count rate plots | Images |
|---|---|---|
| Comparison with Poisson distribution Blue bars denote a histogram of data divided into 1 sec bins. Red curve is a Poisson curve with rate = median count rate of data. |
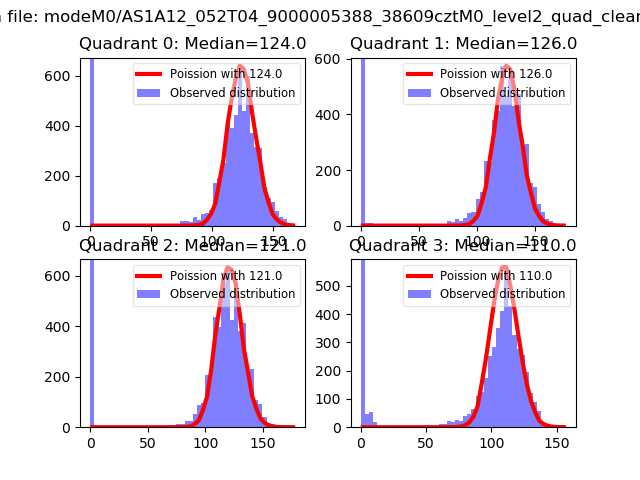 |
 |
| Quadrant-wise count rates Data is divided into 100 sec bins |
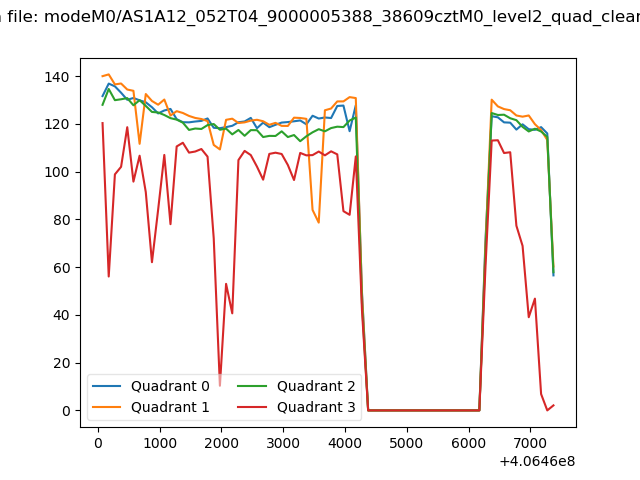 |
|
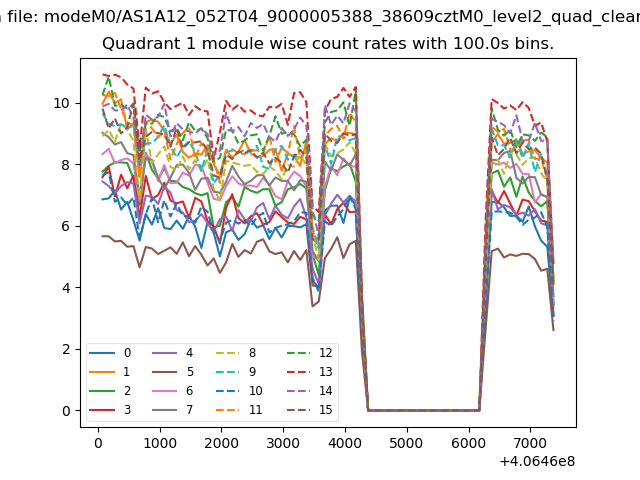
| Module-wise count rates for Quadrant A Data is divided into 100 sec bins |
 |
 |
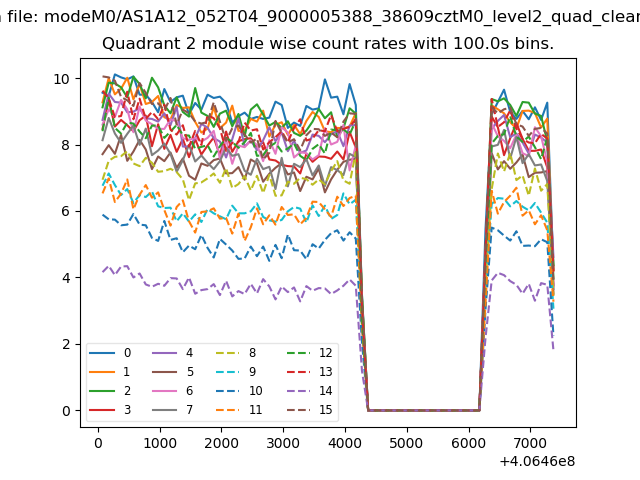
| Module-wise count rates for Quadrant B Data is divided into 100 sec bins |
 |
 |
| Module-wise count rates for Quadrant C Data is divided into 100 sec bins |
 |
 |
| Module-wise count rates for Quadrant D Data is divided into 100 sec bins |
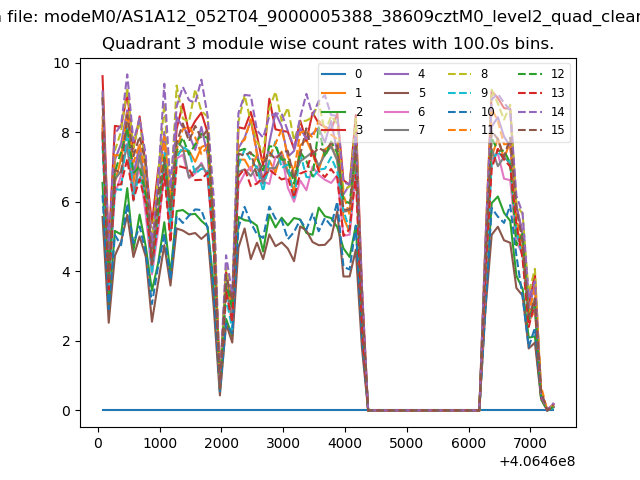 |
 |
| Parameter | Plot |
|---|---|
| CZT HV Monitor | 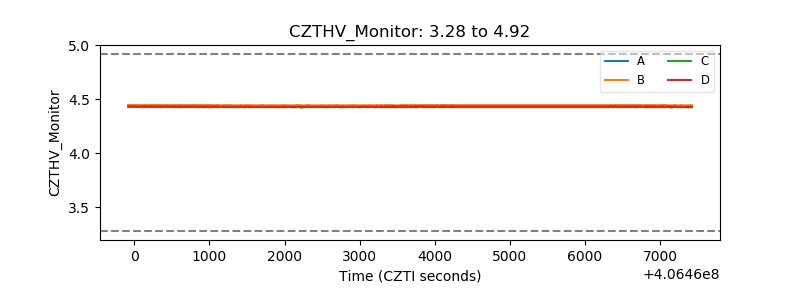 |
| D_VDD |  |
| Temperature 1 | 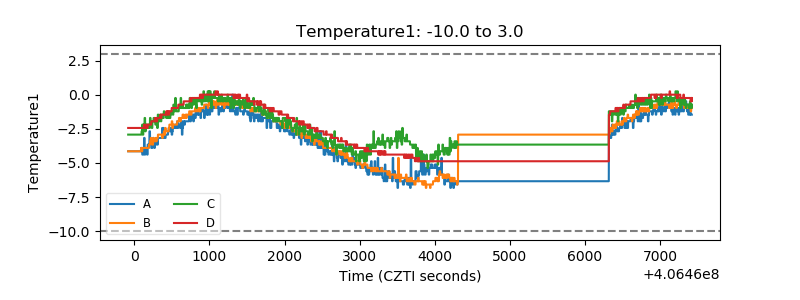 |
| Veto HV Monitor | 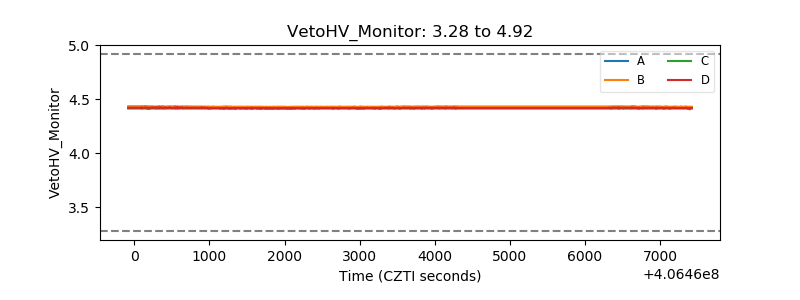 |
| Veto LLD | 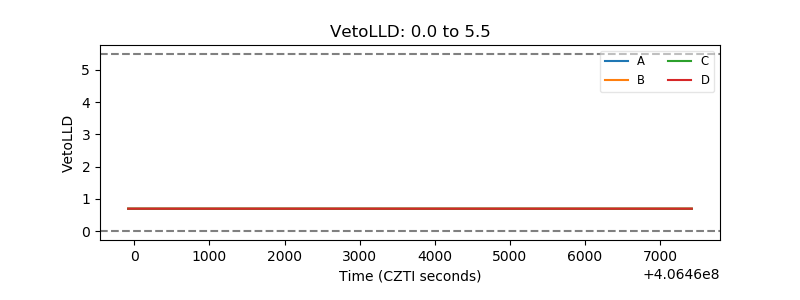 |
| Alpha Counter | 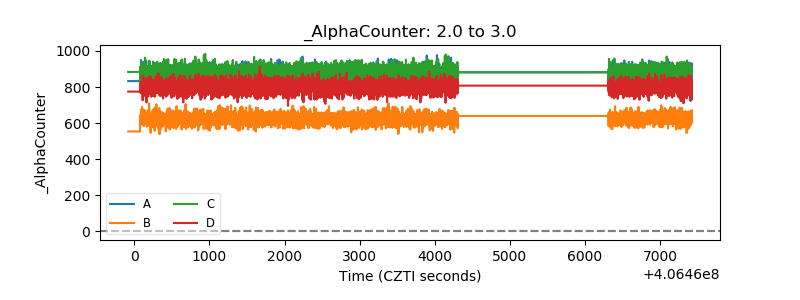 |
| _CPM_Rate | 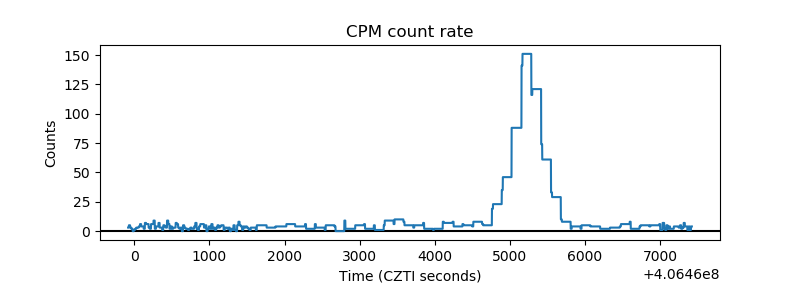 |
| CZT Counter | 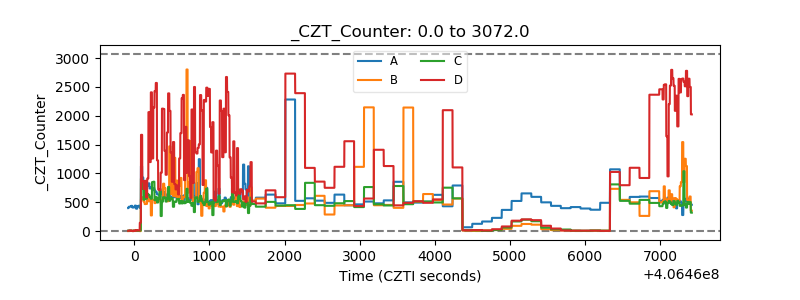 |
| +2.5 Volts monitor | 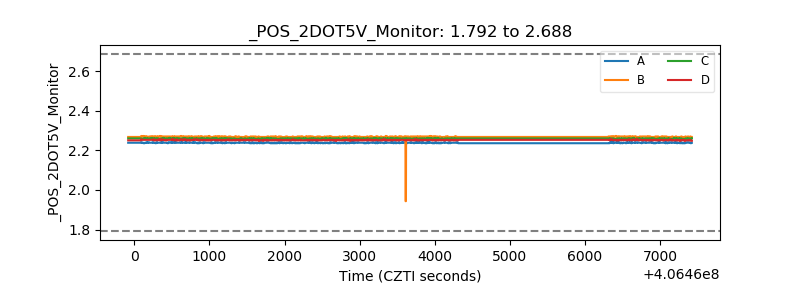 |
| +5 Volts monitor |  |
| _ROLL_ROT | 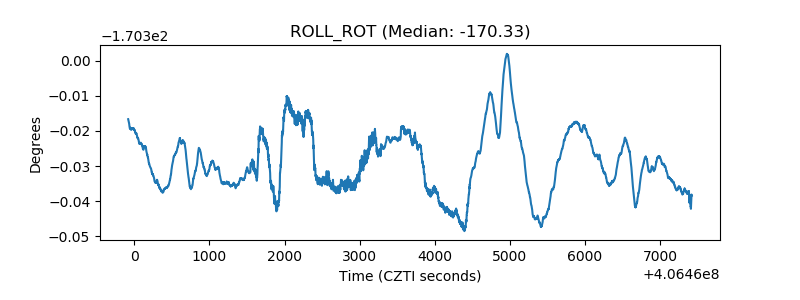 |
| _Roll_DEC | 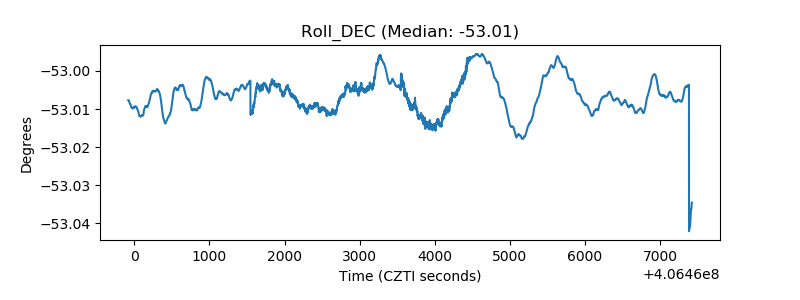 |
| _Roll_RA | 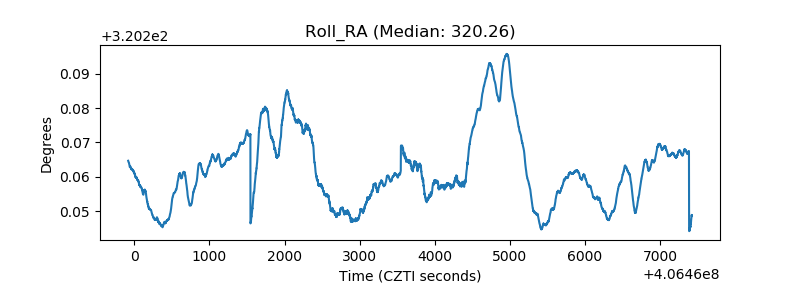 |
| Veto Counter | 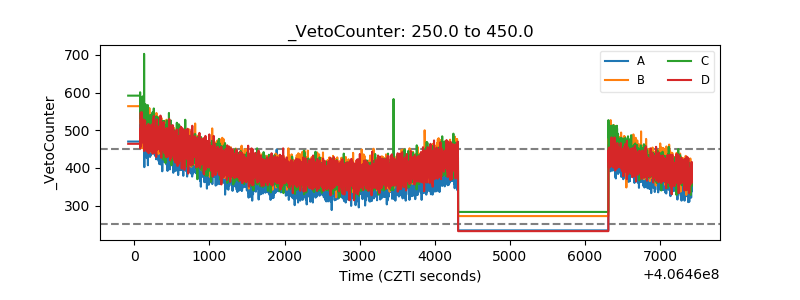 |