| Param | Original file | Final file |
|---|---|---|
| Filename | modeM0/AS1A12_052T04_9000005388_38610cztM0_level2.fits | modeM0/AS1A12_052T04_9000005388_38610cztM0_level2_quad_clean.evt |
| Size (bytes) | 478,618,560 | 94,161,600 |
| Size | 456.4 MB | 89.8 MB |
| Events in quadrant A | 3,029,269 | 666,627 |
| Events in quadrant B | 3,212,330 | 672,207 |
| Events in quadrant C | 2,780,092 | 646,886 |
| Events in quadrant D | 8,253,451 | 467,582 |
| Mode M0 | |||
|---|---|---|---|
| Quadrant | BADHDUFLAG | Total packets | Discarded packets |
| A | 0 | 12367 | 3 |
| B | 0 | 13188 | 2 |
| C | 0 | 11798 | 2 |
| D | 0 | 28445 | 2 |
| Mode SS | |||
|---|---|---|---|
| Quadrant | BADHDUFLAG | Total packets | Discarded packets |
| A | 0 | 116 | 0 |
| B | 0 | 116 | 0 |
| C | 0 | 116 | 0 |
| D | 0 | 116 | 0 |
| Mode M9 | |||
|---|---|---|---|
| Quadrant | BADHDUFLAG | Total packets | Discarded packets |
| A | 0 | 17 | 0 |
| B | 0 | 17 | 0 |
| C | 0 | 17 | 0 |
| D | 0 | 17 | 0 |
| Quadrant | Total seconds | Saturated seconds | Saturation percentage |
|---|---|---|---|
| A | 5687 | 17 | 0.298927% |
| B | 5687 | 87 | 1.529805% |
| C | 5687 | 22 | 0.386847% |
| D | 5688 | 1483 | 26.072433% |
Noise dominated data is calculated using 1-second bins in cleaned event files. If a bin has >2000 counts, and if more than 50% of those come from <1% of pixels, then it is considered to be noise-dominated and hence unusable.
| Quadrant | # 1 sec bins | Bins with >0 counts | Bins with >2000 counts | High rate bins dominated by noise | Noise dominated (total time) | Noise dominated (detector-on time) | Marked lightcurve |
|---|---|---|---|---|---|---|---|
| A | 7390 | 5687 | 7 | 7 | 0.09% | 0.12% | 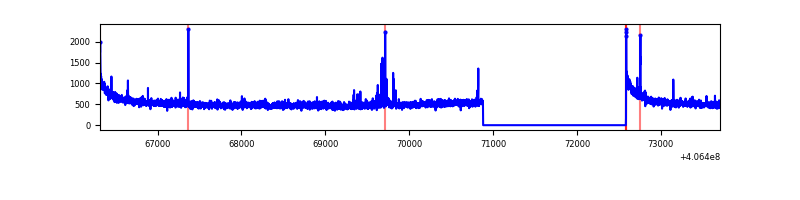 |
| B | 7390 | 5687 | 56 | 56 | 0.76% | 0.98% | 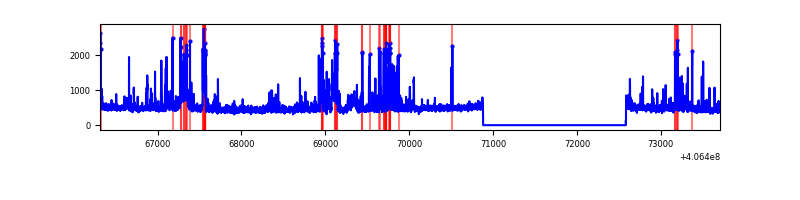 |
| C | 7390 | 5687 | 17 | 17 | 0.23% | 0.30% | 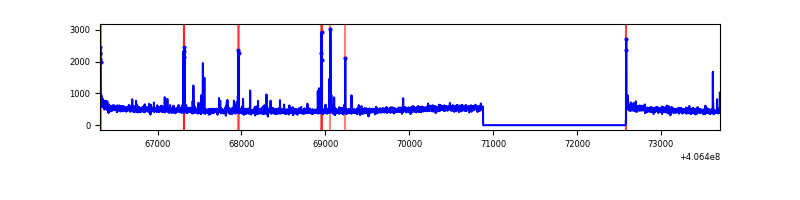 |
| D | 7392 | 5689 | 1706 | 1706 | 23.08% | 29.99% | 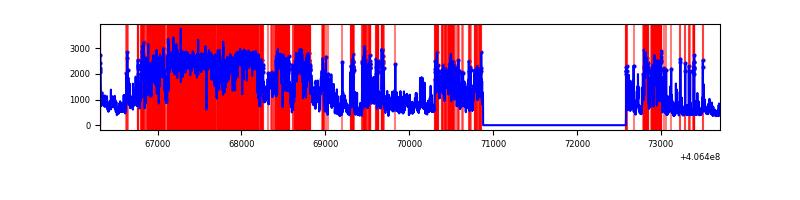 |
Top three noisy pixels from each quadrant. If the there are fewer than three noisy pixels in the level2.evt file, extra rows are filled as -1
| Pixel properties | Quadrant properties | ||||||
|---|---|---|---|---|---|---|---|
| Quadrant | DetID | PixID | Counts | Sigma | Mean | Median | Sigma |
| A | 10 | 83 | 464579 | 3566.66 | 642 | 632 | 130.1 |
| A | 13 | 248 | 49320 | 374.3 | 642 | 632 | 130.1 |
| A | 13 | 6 | 18771 | 139.45 | 642 | 632 | 130.1 |
| B | 0 | 183 | 409709 | 3349.4 | 637 | 621 | 122.1 |
| B | 5 | 184 | 100508 | 817.82 | 637 | 621 | 122.1 |
| B | 5 | 172 | 73886 | 599.86 | 637 | 621 | 122.1 |
| C | 15 | 214 | 235181 | 1653.37 | 617 | 620 | 141.9 |
| C | 14 | 254 | 40808 | 283.28 | 617 | 620 | 141.9 |
| C | 0 | 10 | 34285 | 237.3 | 617 | 620 | 141.9 |
| D | 12 | 227 | 4300619 | 30686.95 | 573 | 556 | 140.1 |
| D | 12 | 235 | 674950 | 4812.74 | 573 | 556 | 140.1 |
| D | 13 | 249 | 368260 | 2624.08 | 573 | 556 | 140.1 |
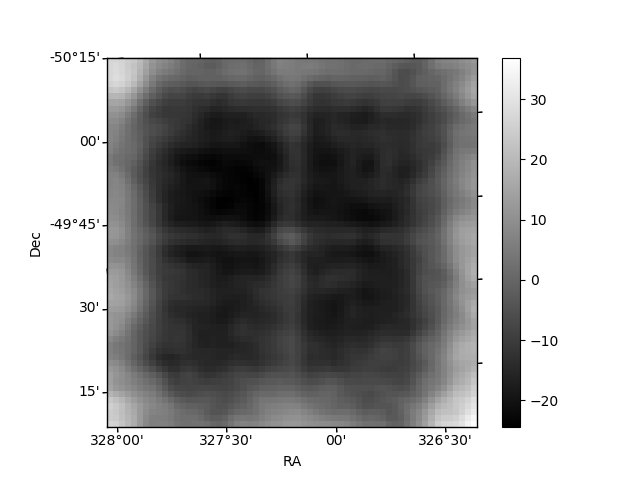
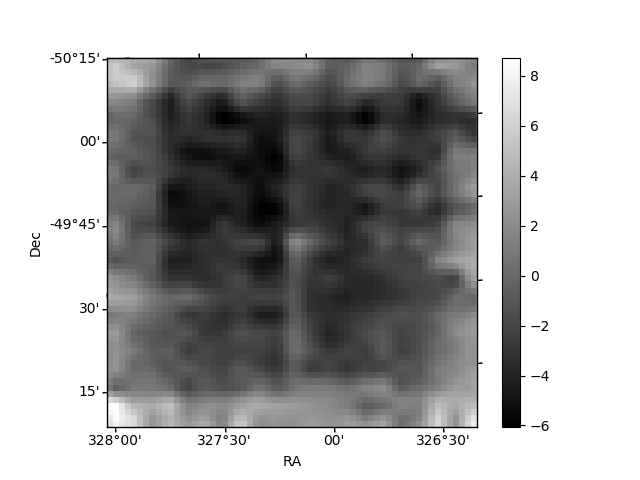
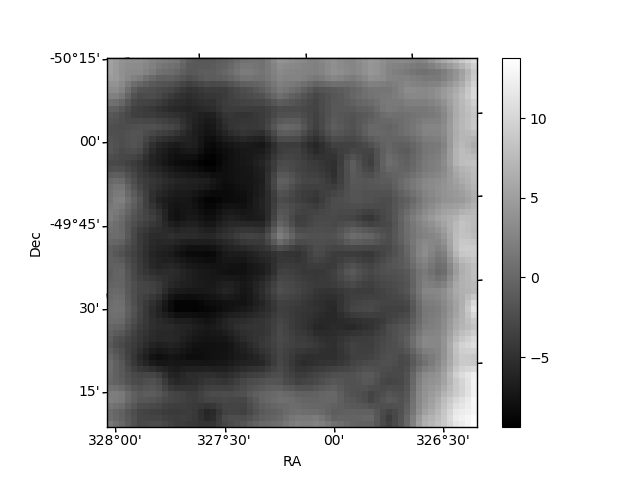
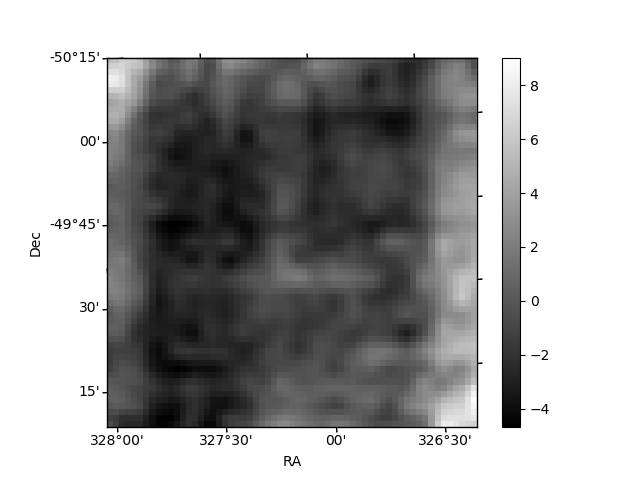
Histogram calculated using DETX and DETY for each event in the final _common_clean file
| Quadrant A | 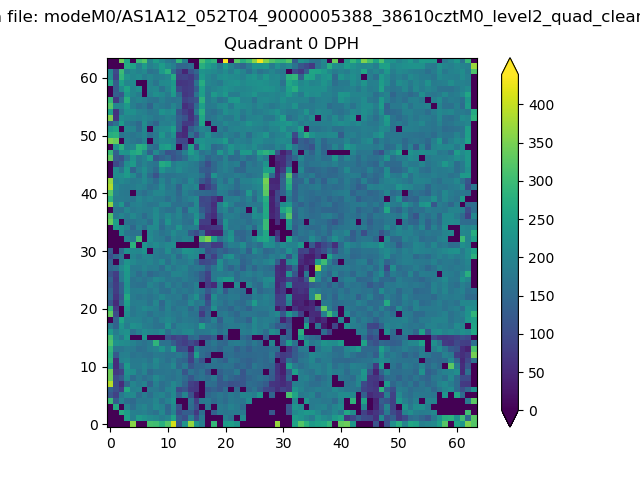 |
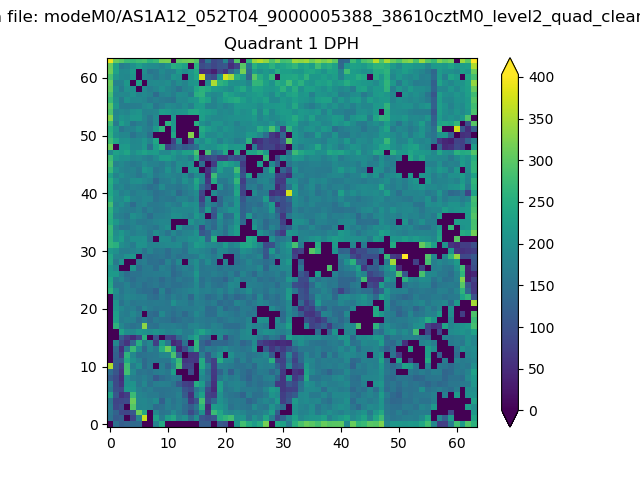 |
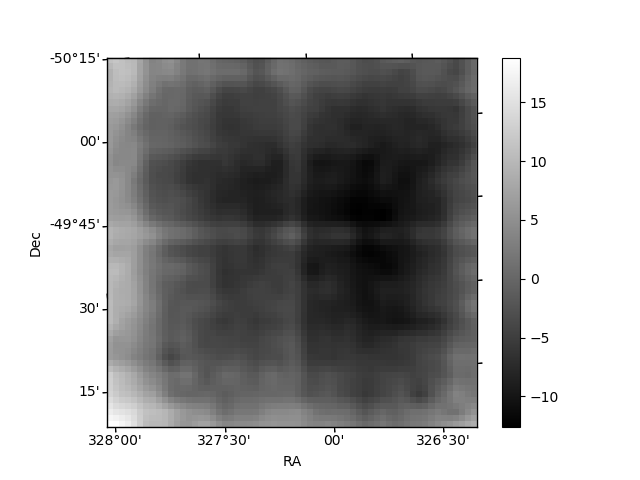
Quadrant B |
|---|---|---|---|
| Quadrant D | 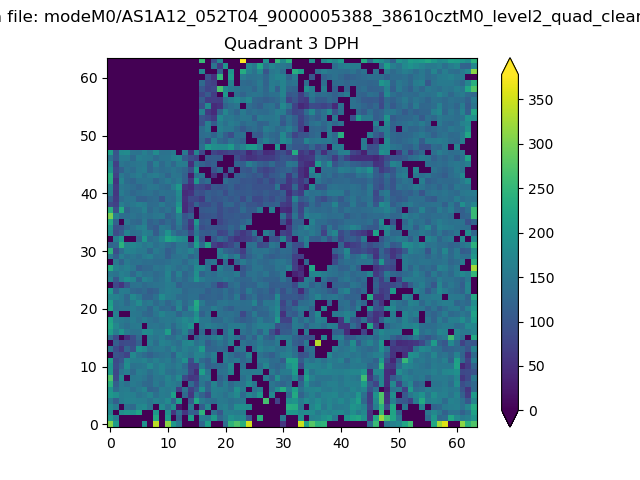 |
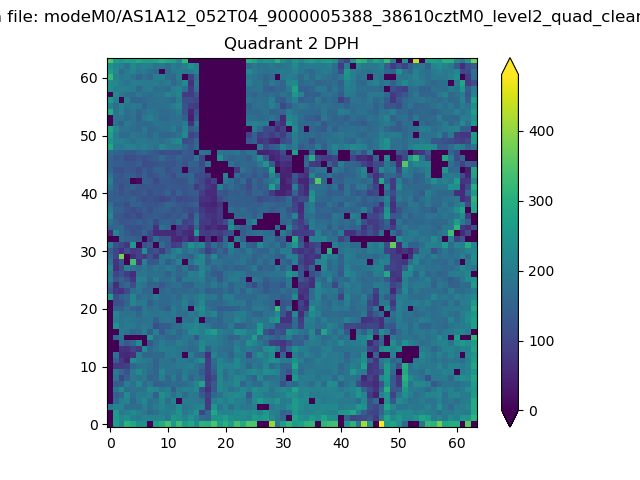 |
Quadrant C |
| Plot type | Count rate plots | Images |
|---|---|---|
| Comparison with Poisson distribution Blue bars denote a histogram of data divided into 1 sec bins. Red curve is a Poisson curve with rate = median count rate of data. |
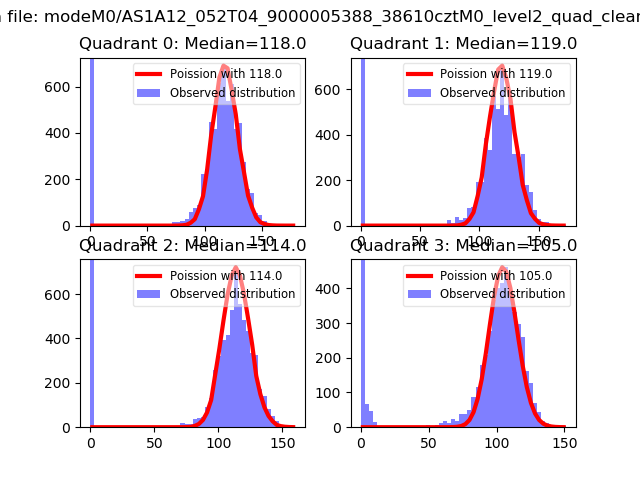 |
 |
| Quadrant-wise count rates Data is divided into 100 sec bins |
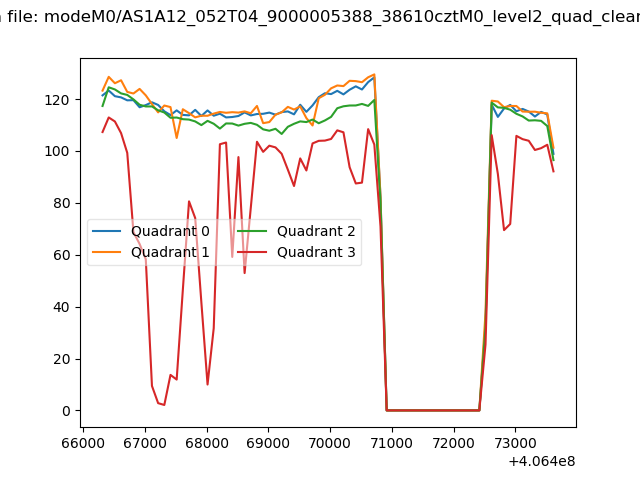 |
|
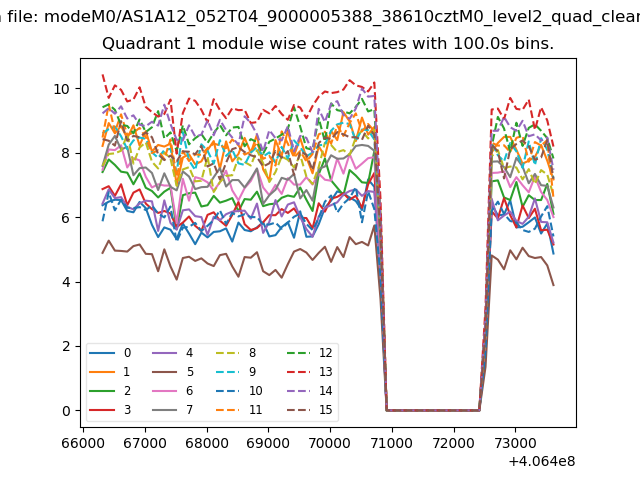
| Module-wise count rates for Quadrant A Data is divided into 100 sec bins |
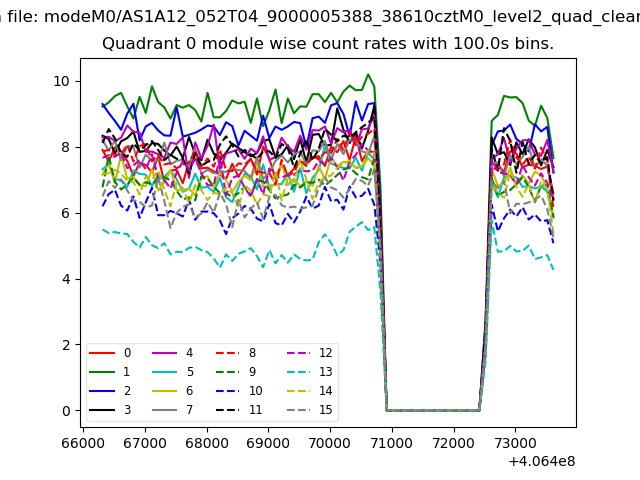 |
 |
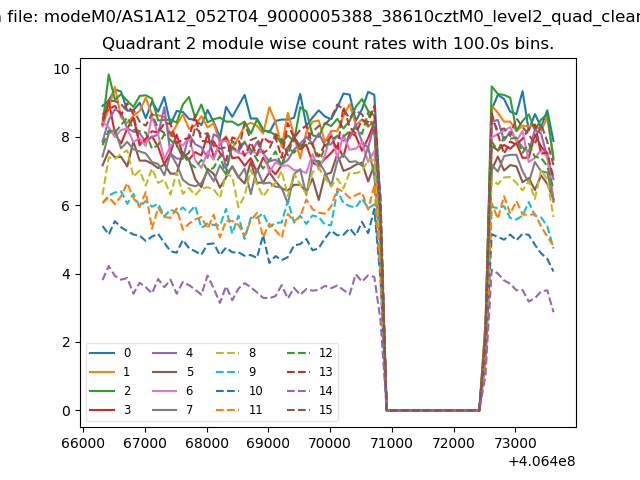
| Module-wise count rates for Quadrant B Data is divided into 100 sec bins |
 |
 |
| Module-wise count rates for Quadrant C Data is divided into 100 sec bins |
 |
 |
| Module-wise count rates for Quadrant D Data is divided into 100 sec bins |
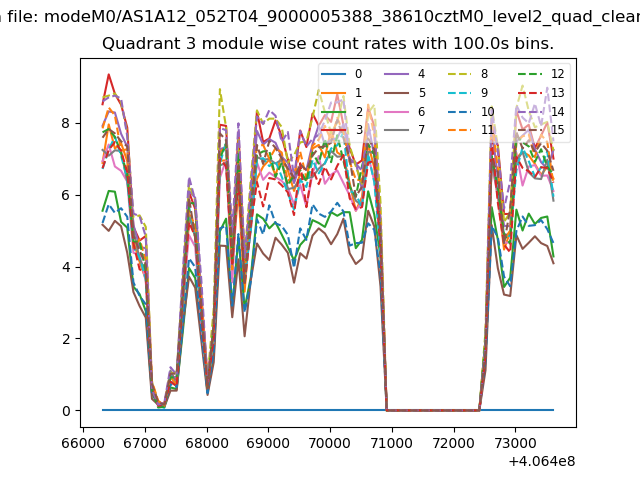 |
 |
| Parameter | Plot |
|---|---|
| CZT HV Monitor | 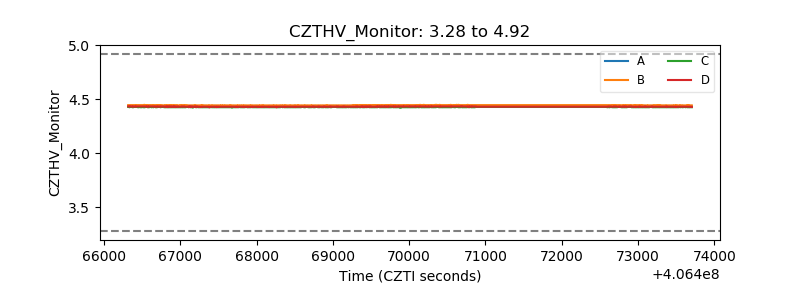 |
| D_VDD | 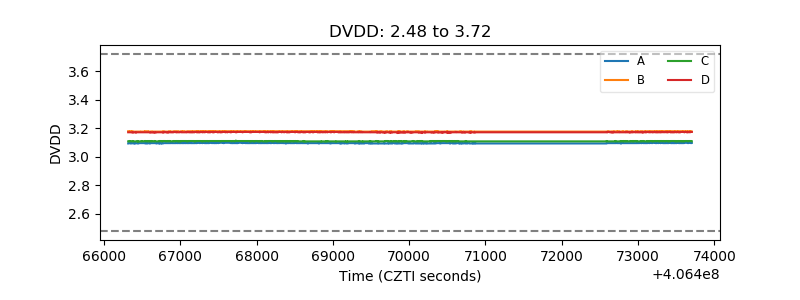 |
| Temperature 1 | 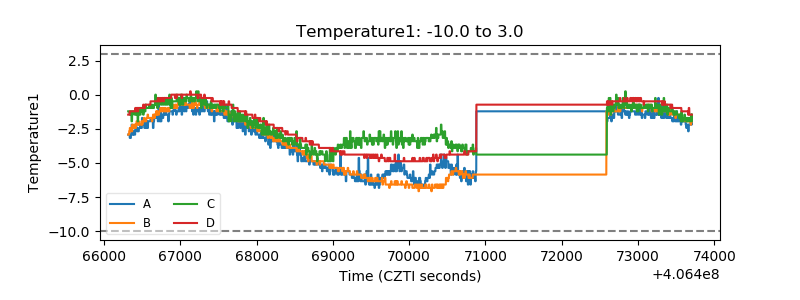 |
| Veto HV Monitor | 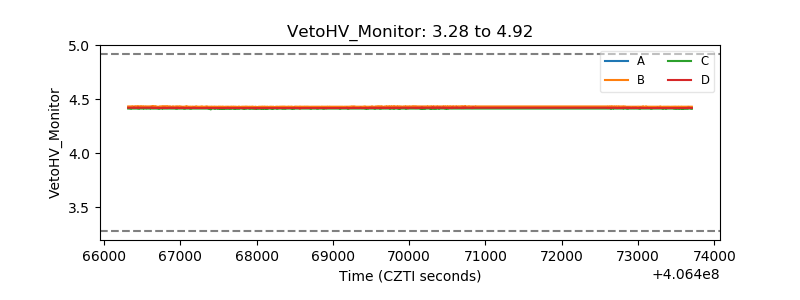 |
| Veto LLD | 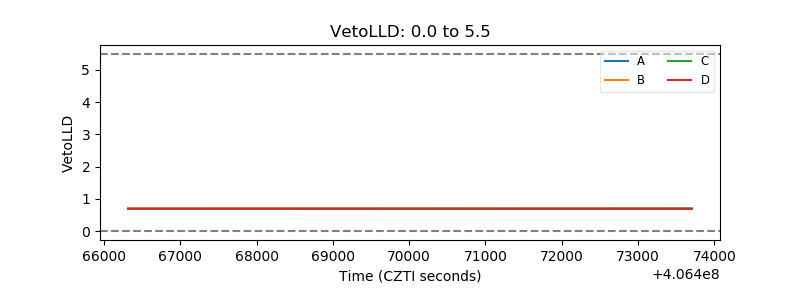 |
| Alpha Counter | 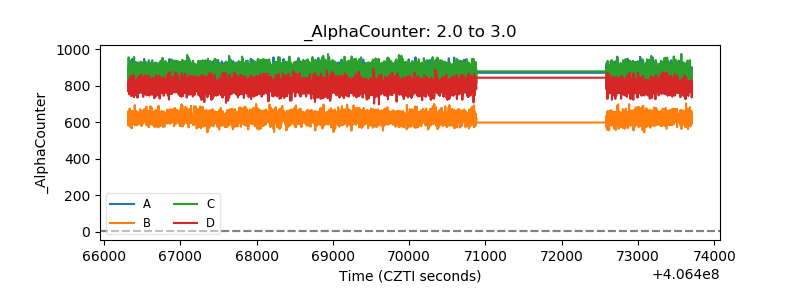 |
| _CPM_Rate | 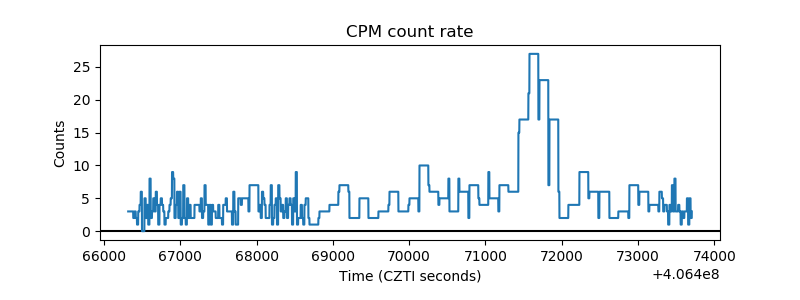 |
| CZT Counter | 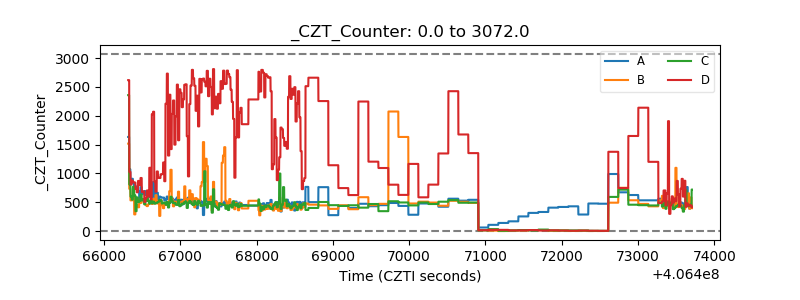 |
| +2.5 Volts monitor | 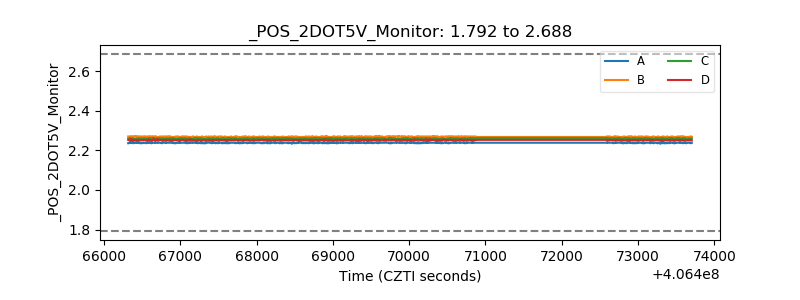 |
| +5 Volts monitor | 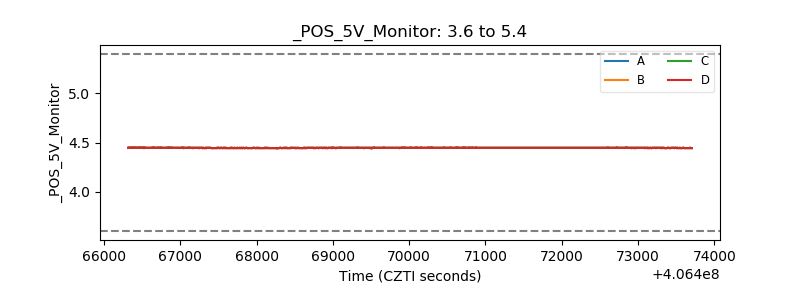 |
| _ROLL_ROT | 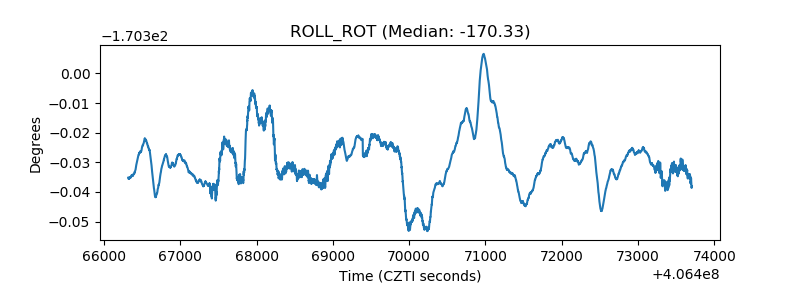 |
| _Roll_DEC | 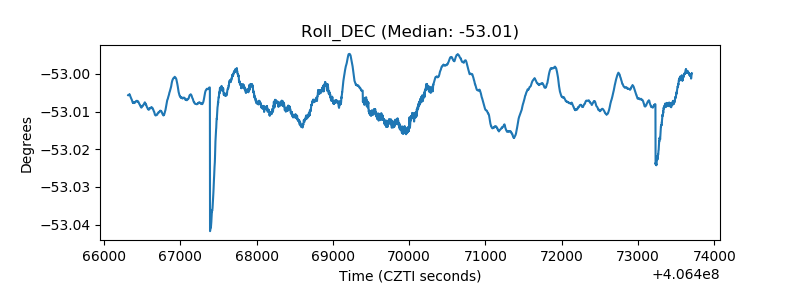 |
| _Roll_RA | 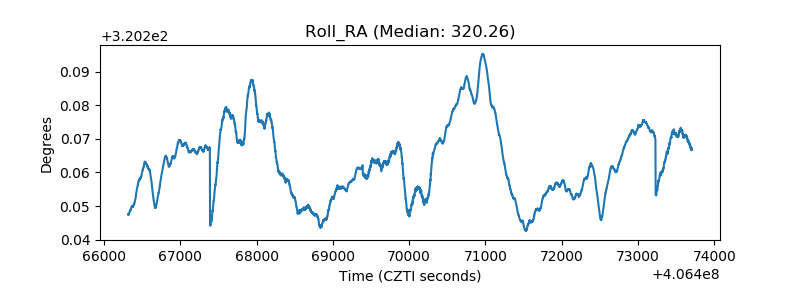 |
| Veto Counter | 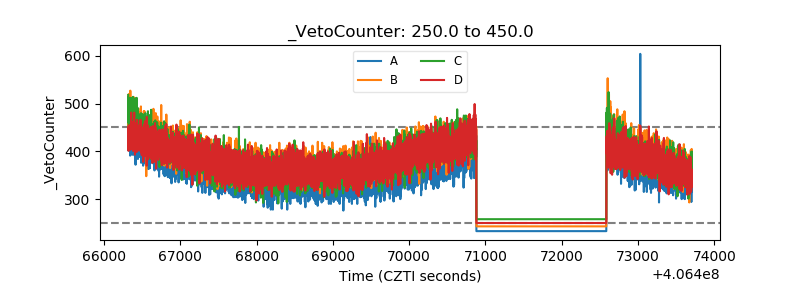 |