| Param | Original file | Final file |
|---|---|---|
| Filename | modeM0/AS1A12_052T04_9000005388_38611cztM0_level2.fits | modeM0/AS1A12_052T04_9000005388_38611cztM0_level2_quad_clean.evt |
| Size (bytes) | 379,149,120 | 99,385,920 |
| Size | 361.6 MB | 94.8 MB |
| Events in quadrant A | 3,250,809 | 673,420 |
| Events in quadrant B | 3,231,635 | 684,989 |
| Events in quadrant C | 3,047,442 | 654,223 |
| Events in quadrant D | 4,047,525 | 585,614 |
| Mode M0 | |||
|---|---|---|---|
| Quadrant | BADHDUFLAG | Total packets | Discarded packets |
| A | 0 | 13273 | 3 |
| B | 0 | 13363 | 2 |
| C | 0 | 12915 | 2 |
| D | 0 | 16058 | 2 |
| Mode SS | |||
|---|---|---|---|
| Quadrant | BADHDUFLAG | Total packets | Discarded packets |
| A | 0 | 120 | 0 |
| B | 0 | 120 | 0 |
| C | 0 | 120 | 0 |
| D | 0 | 120 | 0 |
| Mode M9 | |||
|---|---|---|---|
| Quadrant | BADHDUFLAG | Total packets | Discarded packets |
| A | 0 | 14 | 0 |
| B | 0 | 14 | 0 |
| C | 0 | 14 | 0 |
| D | 0 | 15 | 0 |
| Quadrant | Total seconds | Saturated seconds | Saturation percentage |
|---|---|---|---|
| A | 5881 | 44 | 0.748172% |
| B | 5881 | 39 | 0.663153% |
| C | 5881 | 28 | 0.476110% |
| D | 5881 | 275 | 4.676075% |
Noise dominated data is calculated using 1-second bins in cleaned event files. If a bin has >2000 counts, and if more than 50% of those come from <1% of pixels, then it is considered to be noise-dominated and hence unusable.
| Quadrant | # 1 sec bins | Bins with >0 counts | Bins with >2000 counts | High rate bins dominated by noise | Noise dominated (total time) | Noise dominated (detector-on time) | Marked lightcurve |
|---|---|---|---|---|---|---|---|
| A | 7284 | 5882 | 28 | 28 | 0.38% | 0.48% | 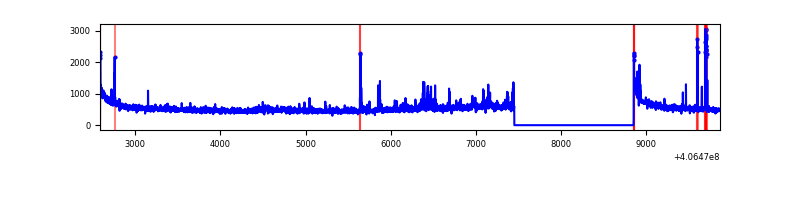 |
| B | 7284 | 5882 | 22 | 22 | 0.30% | 0.37% | 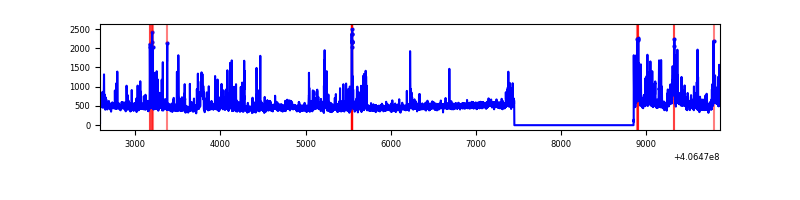 |
| C | 7284 | 5882 | 16 | 16 | 0.22% | 0.27% | 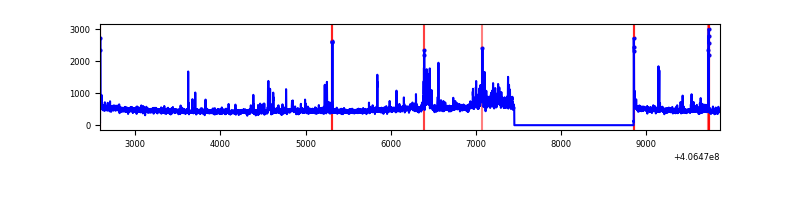 |
| D | 7284 | 5882 | 284 | 284 | 3.90% | 4.83% | 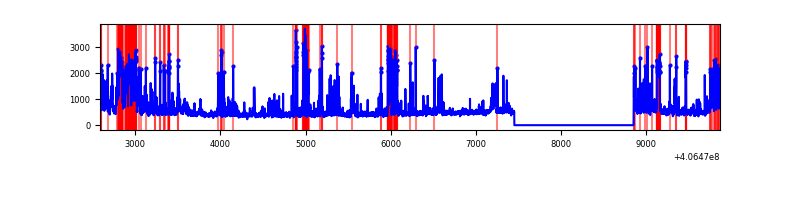 |
Top three noisy pixels from each quadrant. If the there are fewer than three noisy pixels in the level2.evt file, extra rows are filled as -1
| Pixel properties | Quadrant properties | ||||||
|---|---|---|---|---|---|---|---|
| Quadrant | DetID | PixID | Counts | Sigma | Mean | Median | Sigma |
| A | 10 | 83 | 479910 | 3570.05 | 662 | 649 | 134.2 |
| A | 13 | 248 | 110999 | 822.0 | 662 | 649 | 134.2 |
| A | 9 | 143 | 64164 | 473.13 | 662 | 649 | 134.2 |
| B | 0 | 183 | 344638 | 2693.11 | 659 | 643 | 127.7 |
| B | 4 | 251 | 68315 | 529.8 | 659 | 643 | 127.7 |
| B | 4 | 171 | 58380 | 452.02 | 659 | 643 | 127.7 |
| C | 14 | 254 | 260384 | 1752.22 | 638 | 642 | 148.2 |
| C | 15 | 214 | 239677 | 1612.53 | 638 | 642 | 148.2 |
| C | 0 | 10 | 25720 | 169.18 | 638 | 642 | 148.2 |
| D | 12 | 227 | 509337 | 3299.88 | 628 | 611 | 154.2 |
| D | 13 | 249 | 242049 | 1566.1 | 628 | 611 | 154.2 |
| D | 10 | 253 | 212369 | 1373.58 | 628 | 611 | 154.2 |
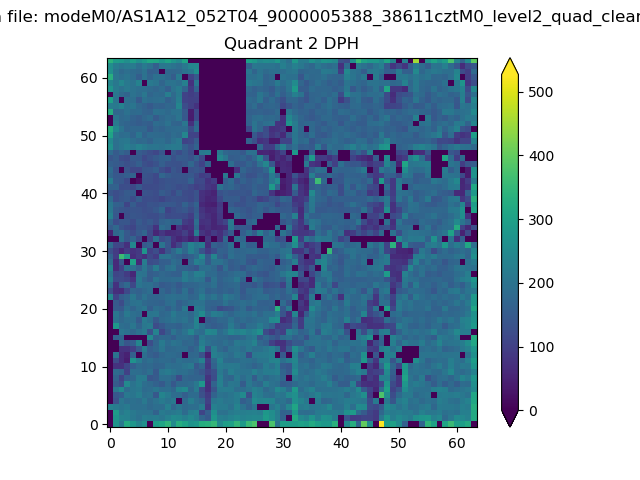
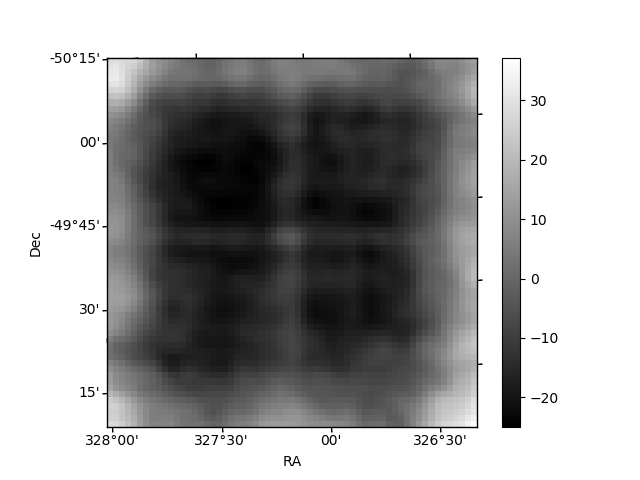
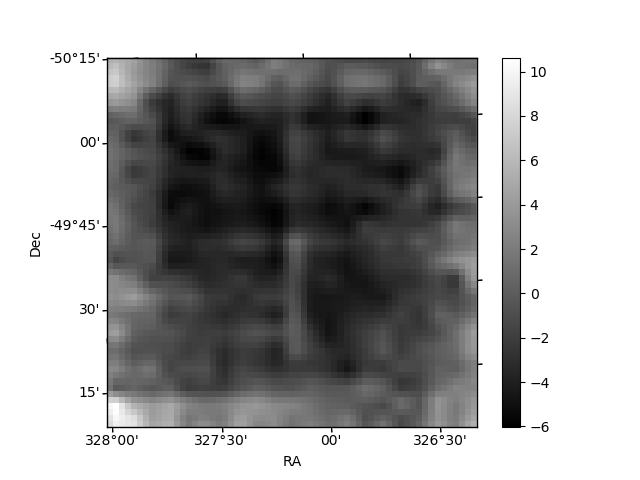
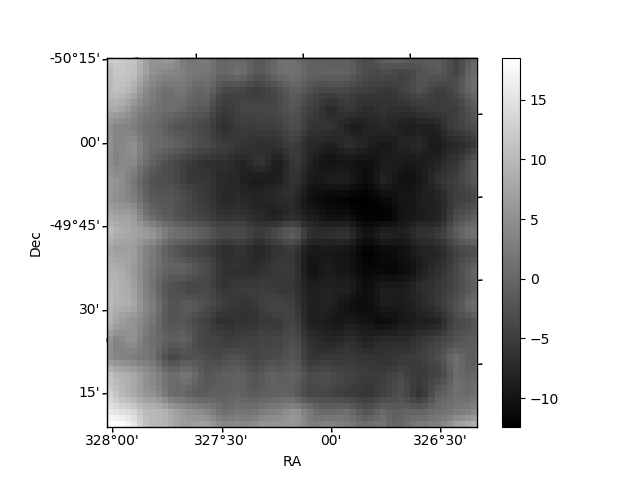
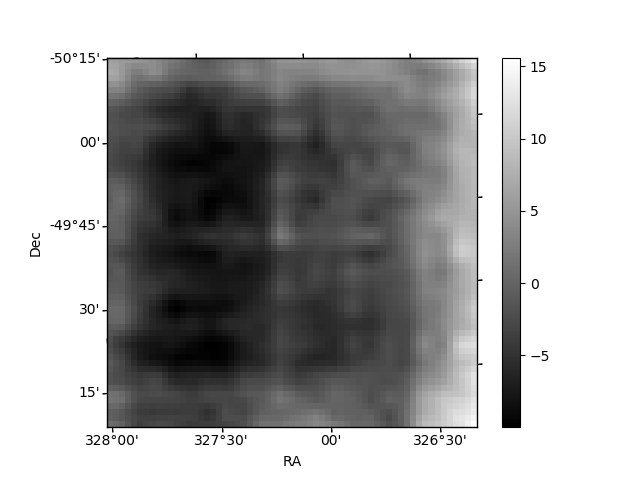
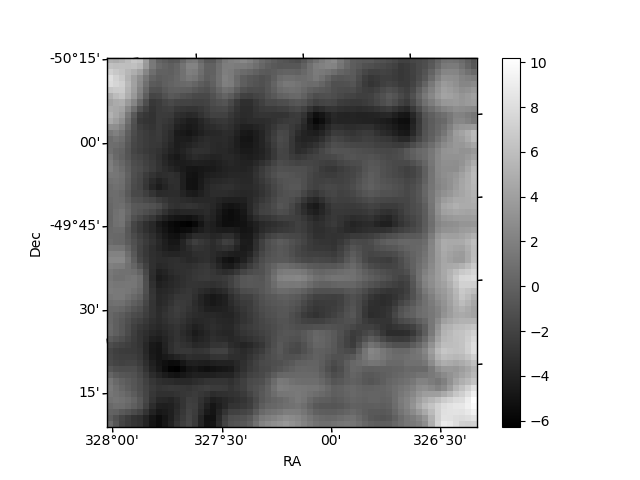
Histogram calculated using DETX and DETY for each event in the final _common_clean file
| Quadrant A | 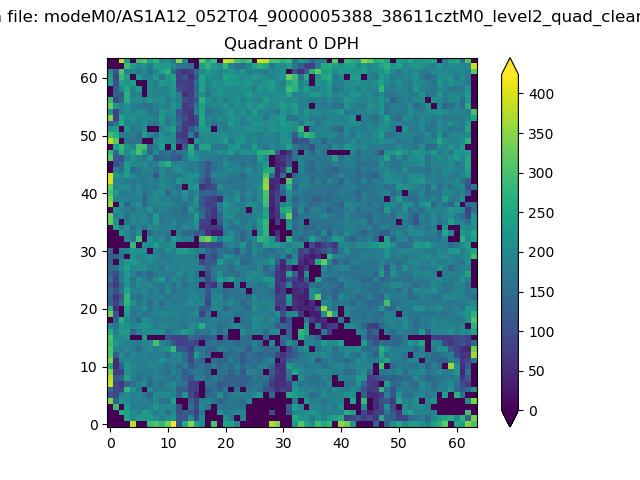 |
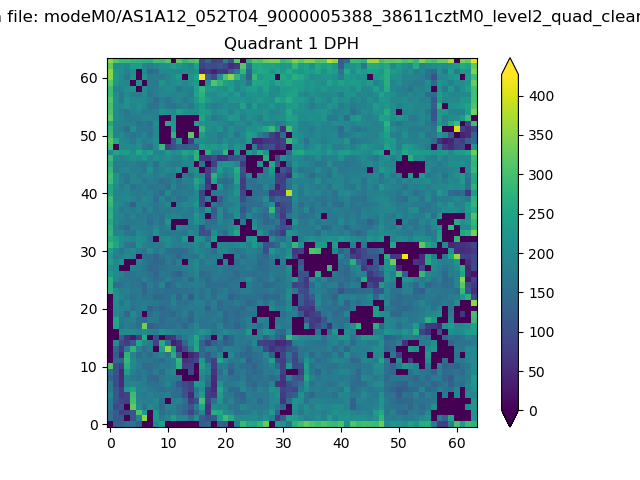 |
Quadrant B |
|---|---|---|---|
| Quadrant D | 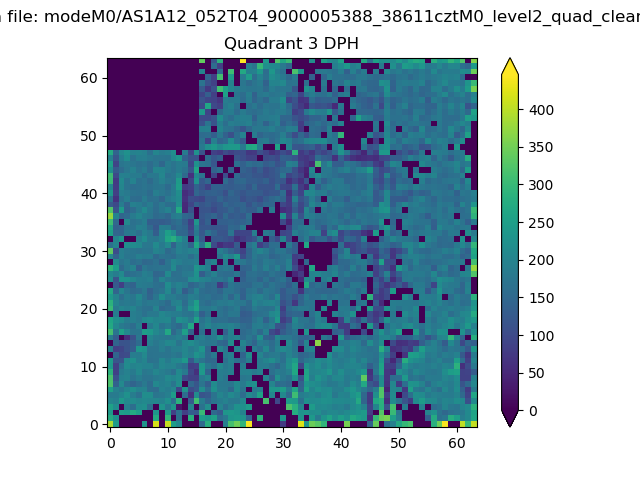 |
 |
Quadrant C |
| Plot type | Count rate plots | Images |
|---|---|---|
| Comparison with Poisson distribution Blue bars denote a histogram of data divided into 1 sec bins. Red curve is a Poisson curve with rate = median count rate of data. |
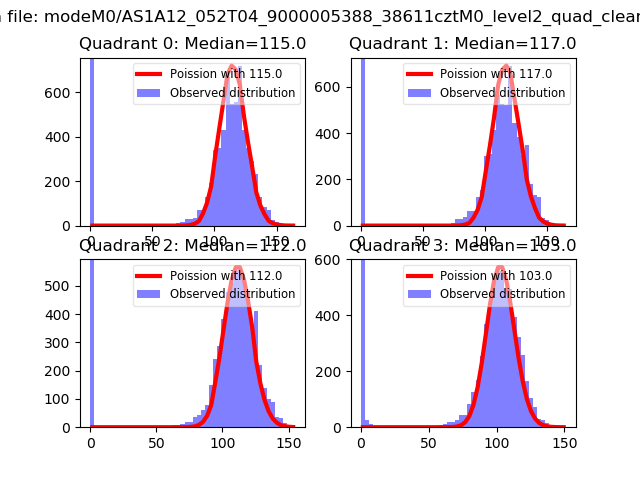 |
 |
| Quadrant-wise count rates Data is divided into 100 sec bins |
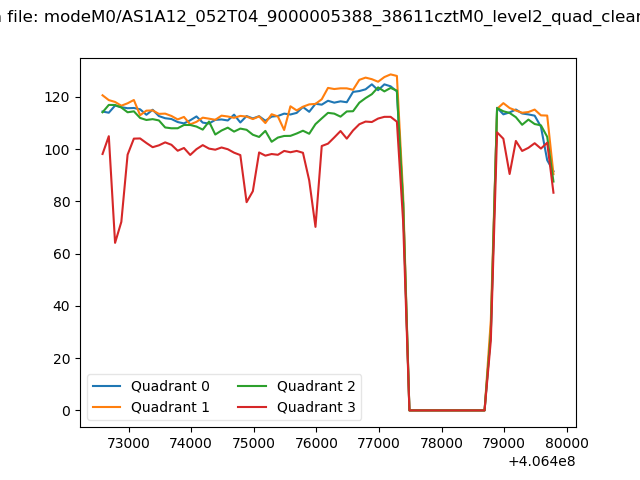 |
|
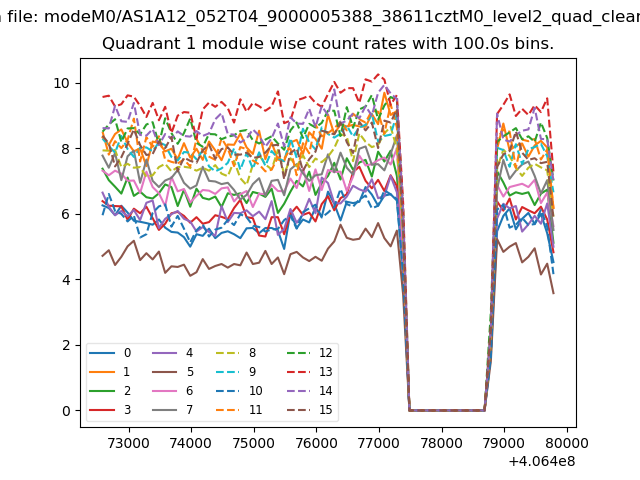
| Module-wise count rates for Quadrant A Data is divided into 100 sec bins |
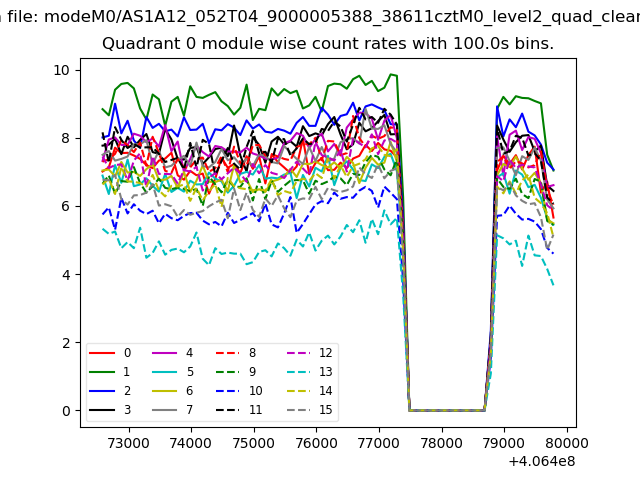 |
 |
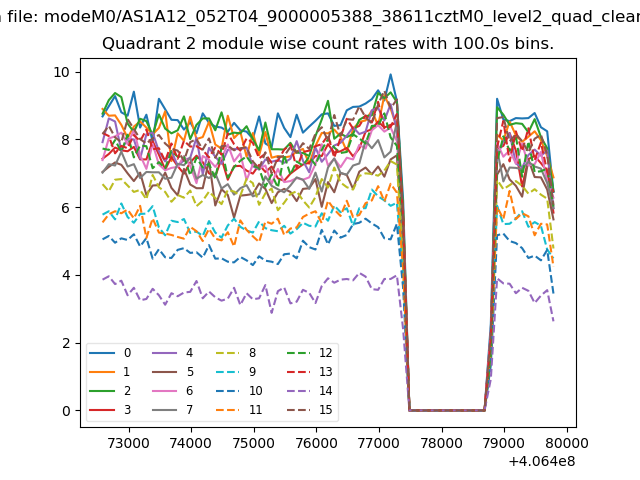
| Module-wise count rates for Quadrant B Data is divided into 100 sec bins |
 |
 |
| Module-wise count rates for Quadrant C Data is divided into 100 sec bins |
 |
 |
| Module-wise count rates for Quadrant D Data is divided into 100 sec bins |
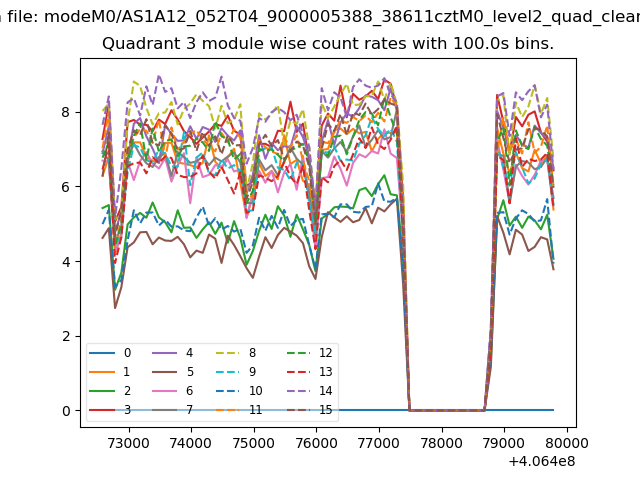 |
 |
| Parameter | Plot |
|---|---|
| CZT HV Monitor | 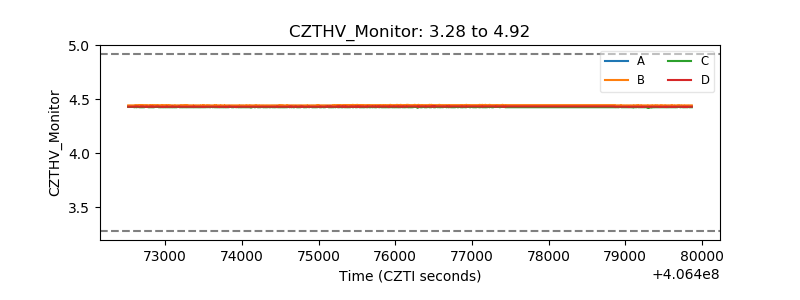 |
| D_VDD | 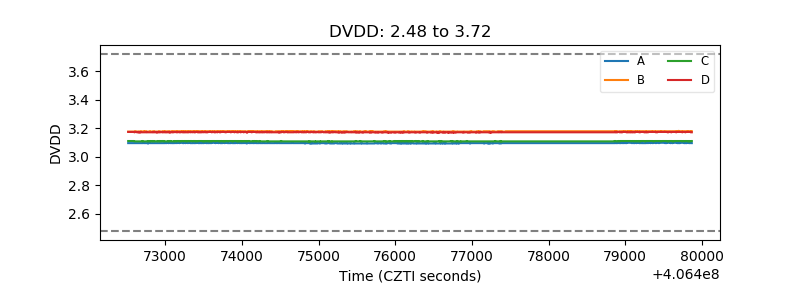 |
| Temperature 1 | 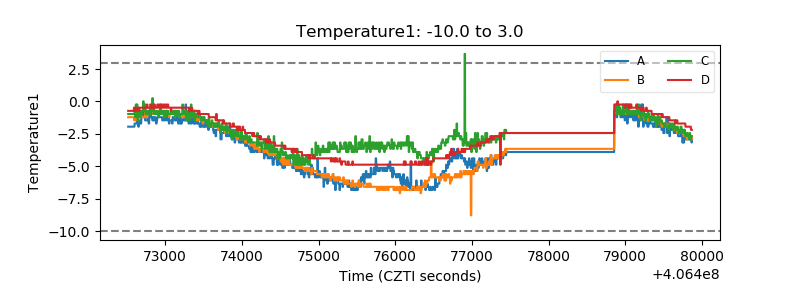 |
| Veto HV Monitor | 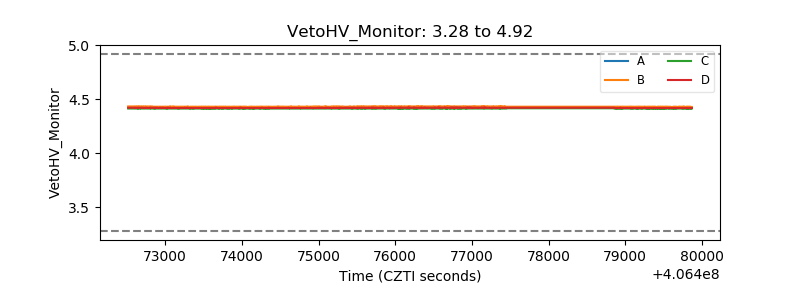 |
| Veto LLD | 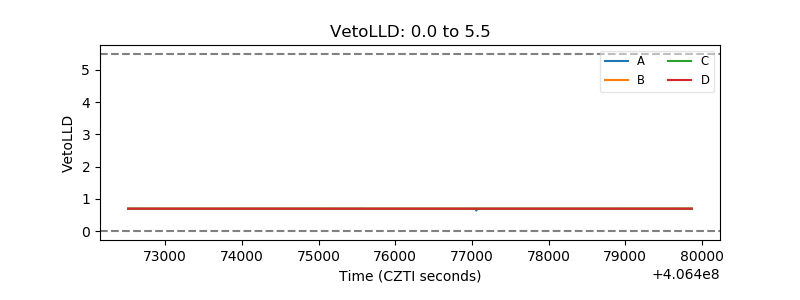 |
| Alpha Counter | 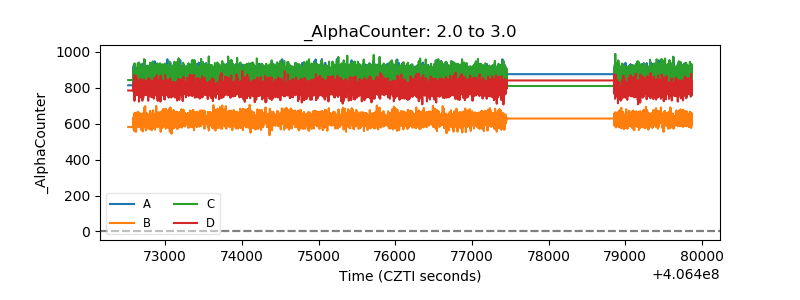 |
| _CPM_Rate | 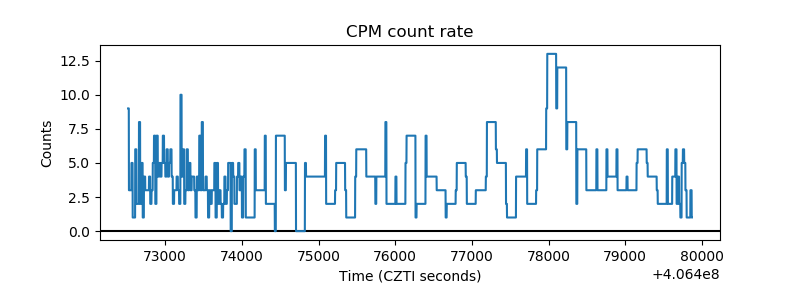 |
| CZT Counter | 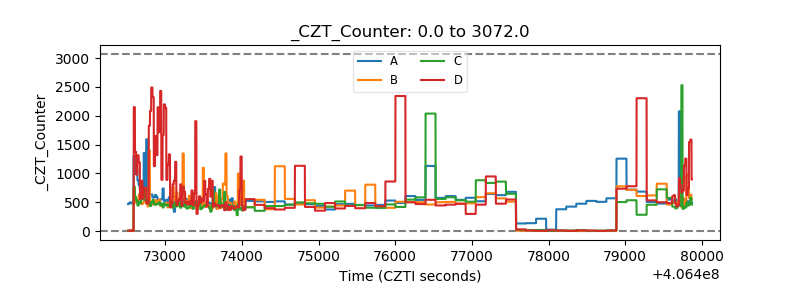 |
| +2.5 Volts monitor | 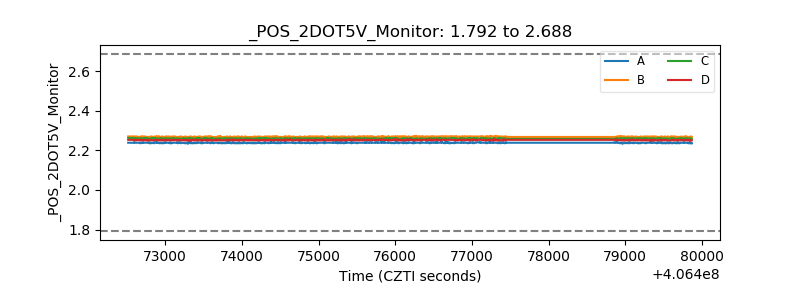 |
| +5 Volts monitor | 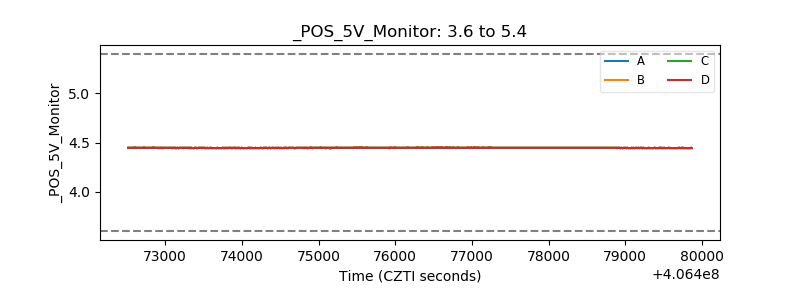 |
| _ROLL_ROT | 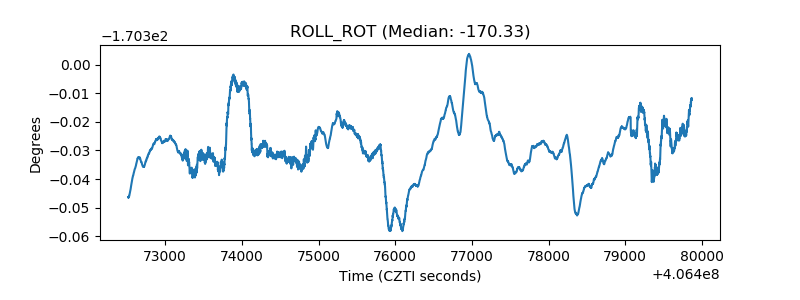 |
| _Roll_DEC | 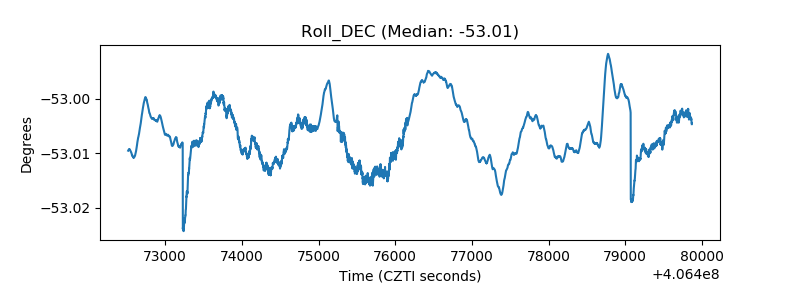 |
| _Roll_RA | 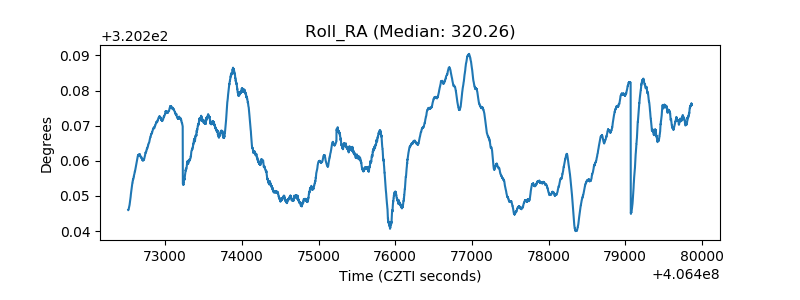 |
| Veto Counter | 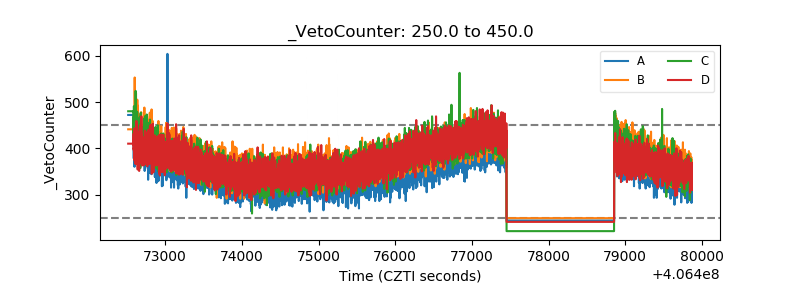 |