| Param | Original file | Final file |
|---|---|---|
| Filename | modeM0/AS1A12_052T04_9000005388_38612cztM0_level2.fits | modeM0/AS1A12_052T04_9000005388_38612cztM0_level2_quad_clean.evt |
| Size (bytes) | 422,104,320 | 96,264,000 |
| Size | 402.6 MB | 91.8 MB |
| Events in quadrant A | 3,082,336 | 654,365 |
| Events in quadrant B | 3,519,642 | 657,708 |
| Events in quadrant C | 2,955,117 | 630,752 |
| Events in quadrant D | 5,621,515 | 570,062 |
| Mode M0 | |||
|---|---|---|---|
| Quadrant | BADHDUFLAG | Total packets | Discarded packets |
| A | 0 | 12654 | 3 |
| B | 0 | 14141 | 2 |
| C | 0 | 12381 | 2 |
| D | 0 | 20627 | 2 |
| Mode SS | |||
|---|---|---|---|
| Quadrant | BADHDUFLAG | Total packets | Discarded packets |
| A | 0 | 116 | 0 |
| B | 0 | 116 | 0 |
| C | 0 | 116 | 0 |
| D | 0 | 116 | 0 |
| Mode M9 | |||
|---|---|---|---|
| Quadrant | BADHDUFLAG | Total packets | Discarded packets |
| A | 0 | 14 | 0 |
| B | 0 | 14 | 0 |
| C | 0 | 14 | 0 |
| D | 0 | 14 | 0 |
| Quadrant | Total seconds | Saturated seconds | Saturation percentage |
|---|---|---|---|
| A | 5748 | 37 | 0.643702% |
| B | 5748 | 117 | 2.035491% |
| C | 5748 | 25 | 0.434934% |
| D | 5748 | 310 | 5.393180% |
Noise dominated data is calculated using 1-second bins in cleaned event files. If a bin has >2000 counts, and if more than 50% of those come from <1% of pixels, then it is considered to be noise-dominated and hence unusable.
| Quadrant | # 1 sec bins | Bins with >0 counts | Bins with >2000 counts | High rate bins dominated by noise | Noise dominated (total time) | Noise dominated (detector-on time) | Marked lightcurve |
|---|---|---|---|---|---|---|---|
| A | 7058 | 5749 | 26 | 26 | 0.37% | 0.45% | 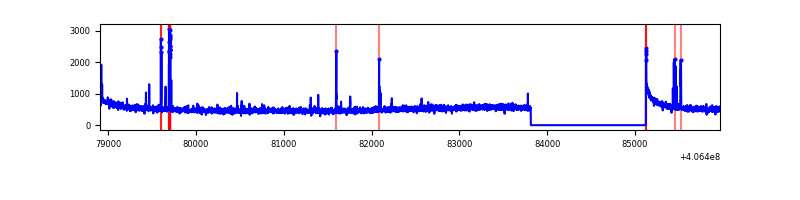 |
| B | 7058 | 5749 | 69 | 69 | 0.98% | 1.20% | 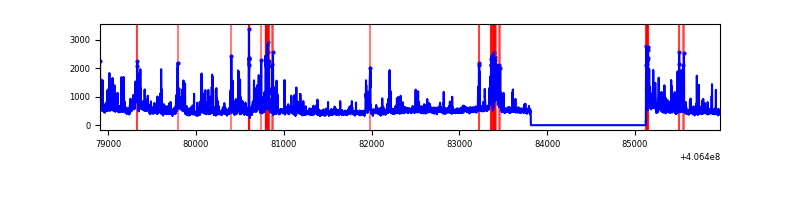 |
| C | 7058 | 5749 | 25 | 25 | 0.35% | 0.43% | 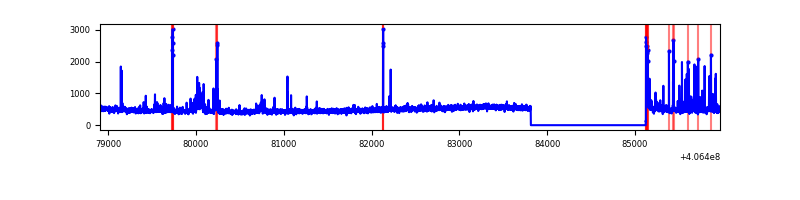 |
| D | 7058 | 5749 | 305 | 305 | 4.32% | 5.31% | 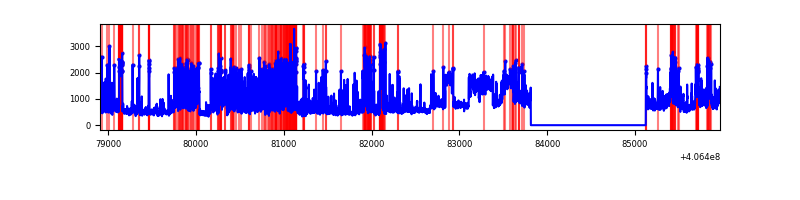 |
Top three noisy pixels from each quadrant. If the there are fewer than three noisy pixels in the level2.evt file, extra rows are filled as -1
| Pixel properties | Quadrant properties | ||||||
|---|---|---|---|---|---|---|---|
| Quadrant | DetID | PixID | Counts | Sigma | Mean | Median | Sigma |
| A | 10 | 83 | 440327 | 3348.61 | 645 | 632 | 131.3 |
| A | 9 | 143 | 60210 | 453.73 | 645 | 632 | 131.3 |
| A | 0 | 52 | 34017 | 254.25 | 645 | 632 | 131.3 |
| B | 0 | 183 | 293533 | 2377.49 | 641 | 625 | 123.2 |
| B | 5 | 172 | 261315 | 2115.98 | 641 | 625 | 123.2 |
| B | 4 | 251 | 114559 | 924.79 | 641 | 625 | 123.2 |
| C | 15 | 214 | 232993 | 1587.0 | 624 | 630 | 146.4 |
| C | 14 | 254 | 190189 | 1294.65 | 624 | 630 | 146.4 |
| C | 0 | 10 | 37263 | 250.2 | 624 | 630 | 146.4 |
| D | 2 | 16 | 1783972 | 11895.36 | 614 | 597 | 149.9 |
| D | 1 | 20 | 375053 | 2497.67 | 614 | 597 | 149.9 |
| D | 12 | 227 | 190704 | 1268.04 | 614 | 597 | 149.9 |
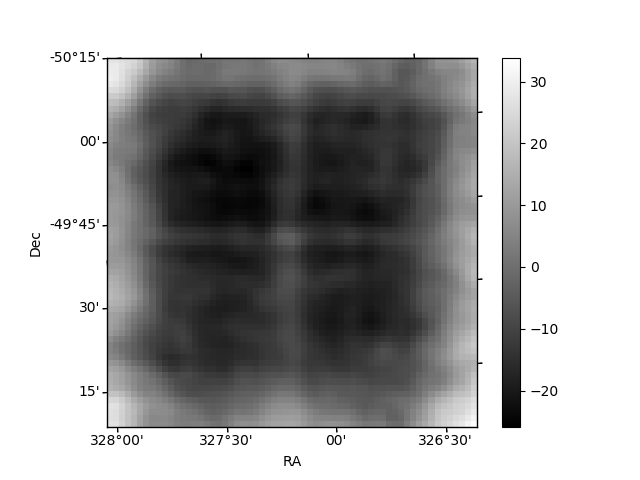
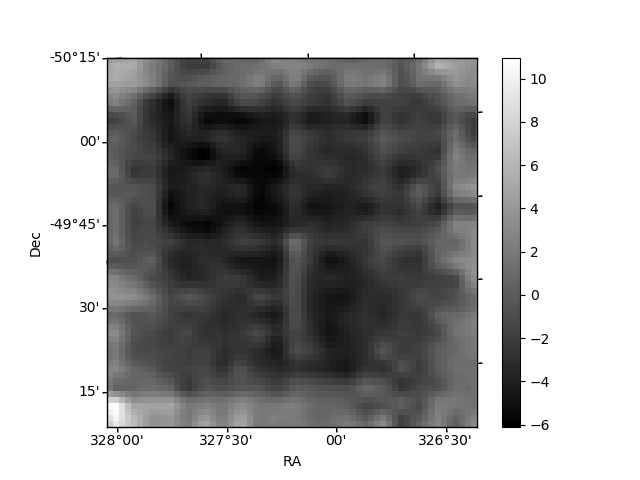
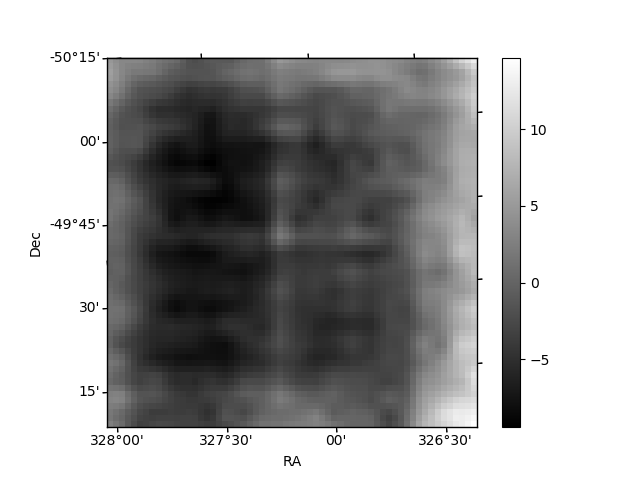
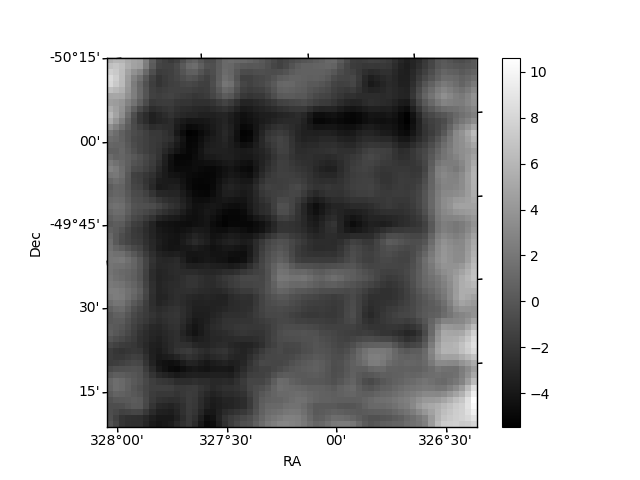
Histogram calculated using DETX and DETY for each event in the final _common_clean file
| Quadrant A | 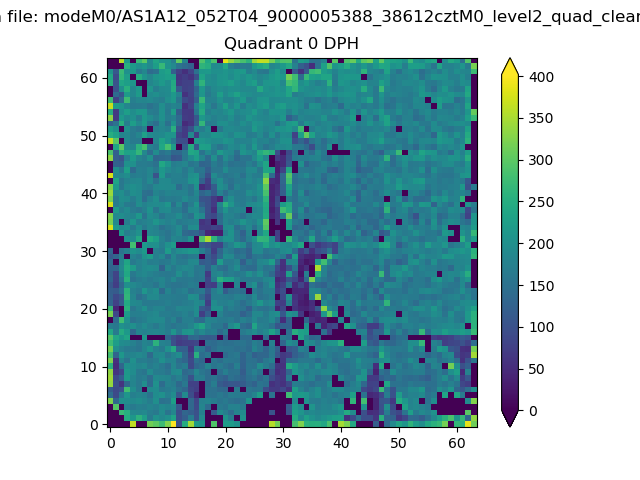 |
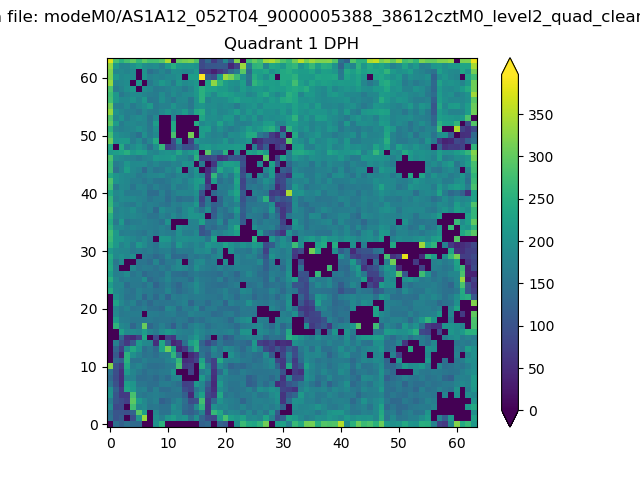 |
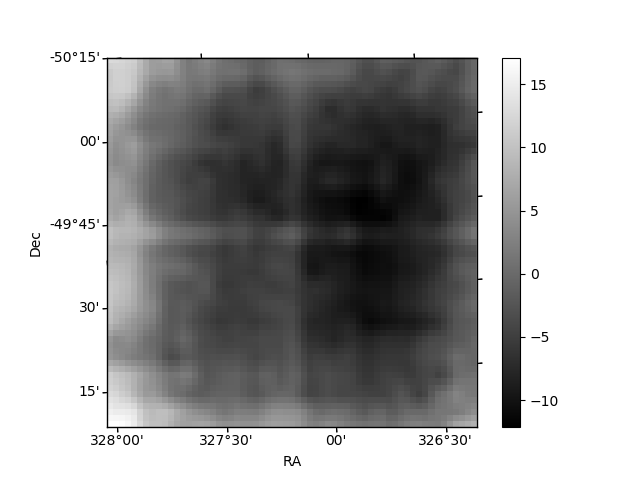
Quadrant B |
|---|---|---|---|
| Quadrant D | 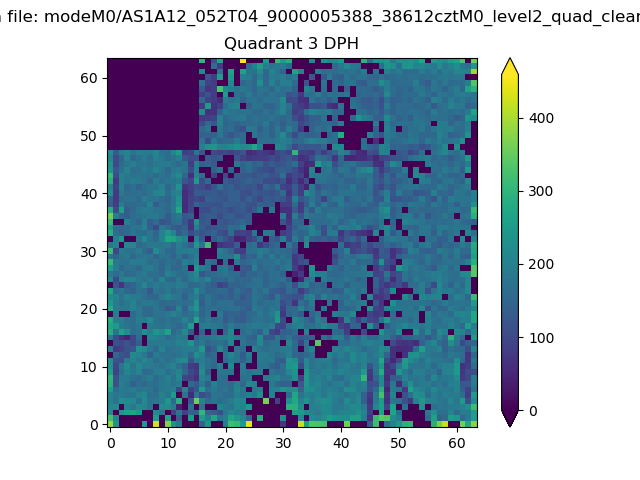 |
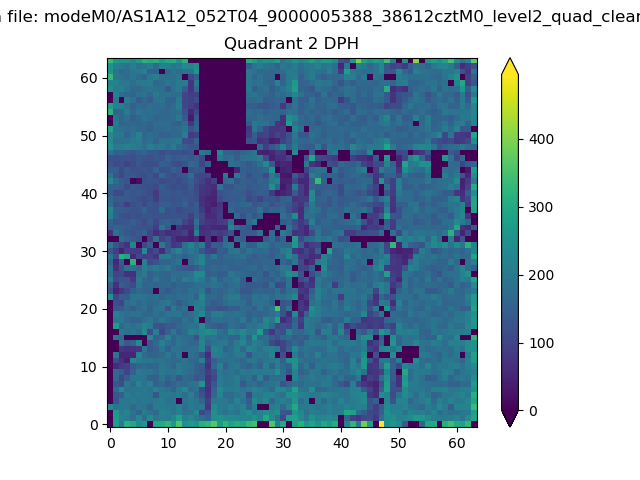 |
Quadrant C |
| Plot type | Count rate plots | Images |
|---|---|---|
| Comparison with Poisson distribution Blue bars denote a histogram of data divided into 1 sec bins. Red curve is a Poisson curve with rate = median count rate of data. |
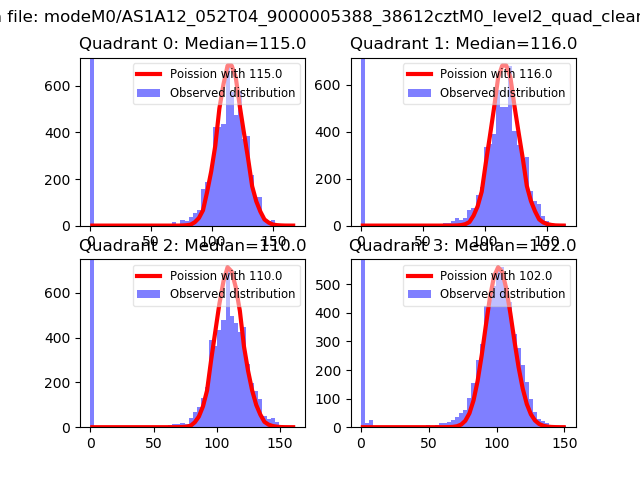 |
 |
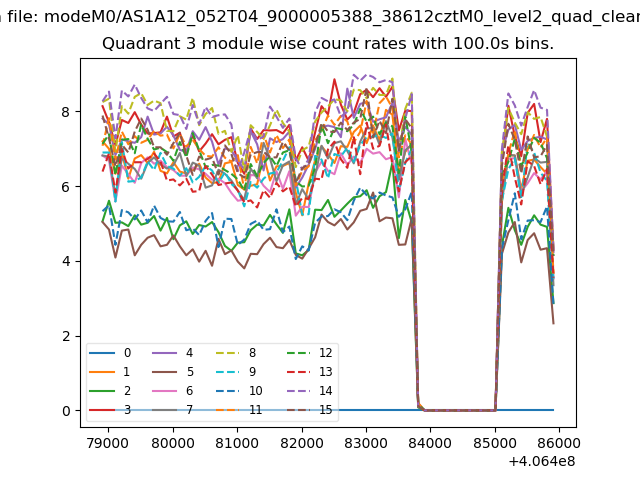
| Quadrant-wise count rates Data is divided into 100 sec bins |
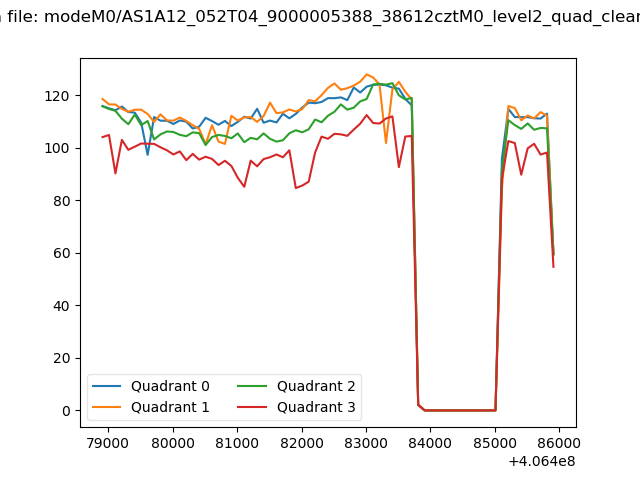 |
|
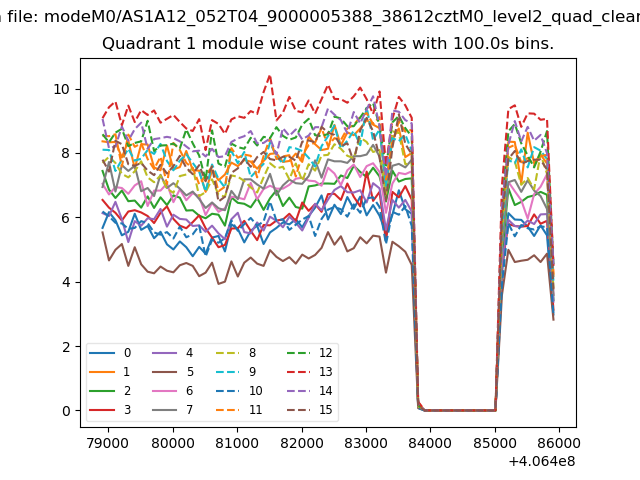
| Module-wise count rates for Quadrant A Data is divided into 100 sec bins |
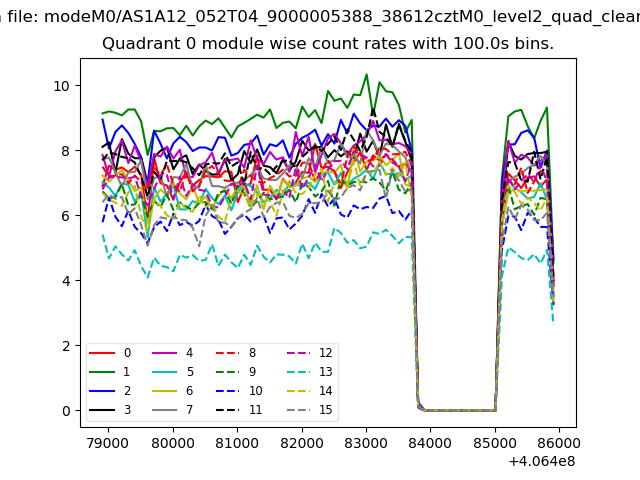 |
 |
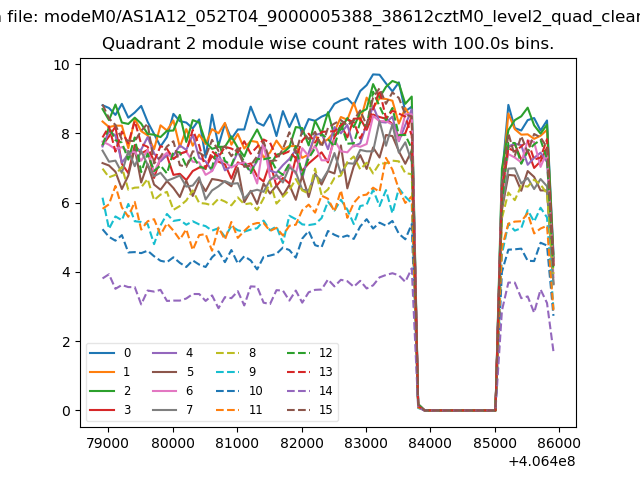
| Module-wise count rates for Quadrant B Data is divided into 100 sec bins |
 |
 |
| Module-wise count rates for Quadrant C Data is divided into 100 sec bins |
 |
 |
| Module-wise count rates for Quadrant D Data is divided into 100 sec bins |
 |
 |
| Parameter | Plot |
|---|---|
| CZT HV Monitor | 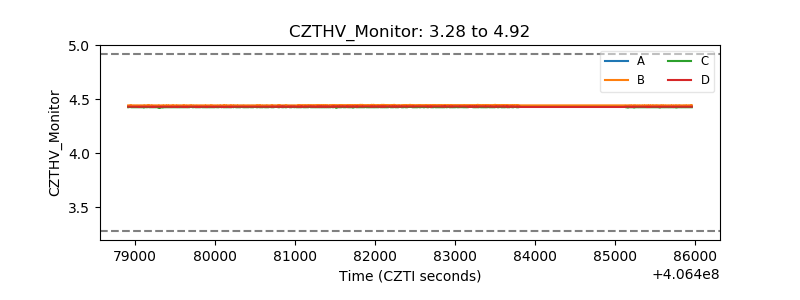 |
| D_VDD | 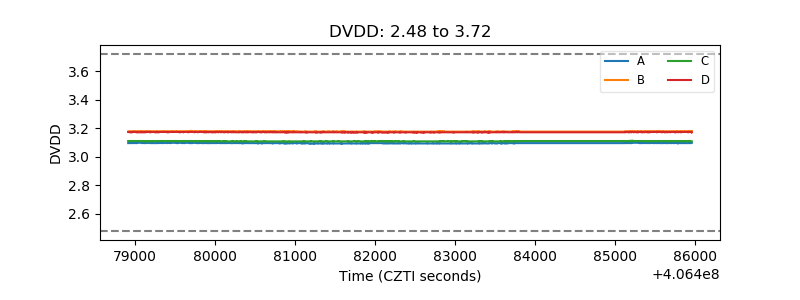 |
| Temperature 1 | 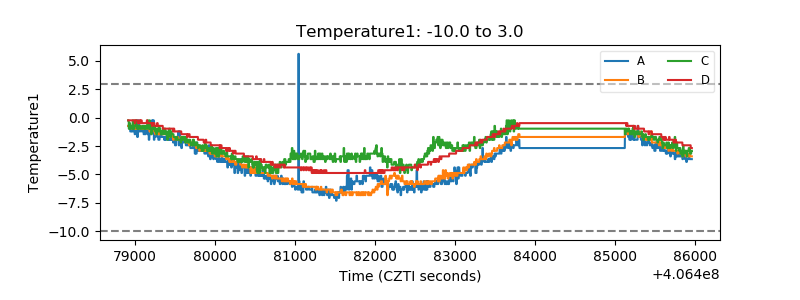 |
| Veto HV Monitor | 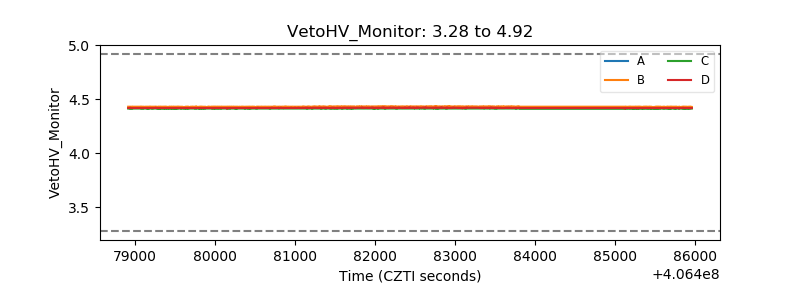 |
| Veto LLD | 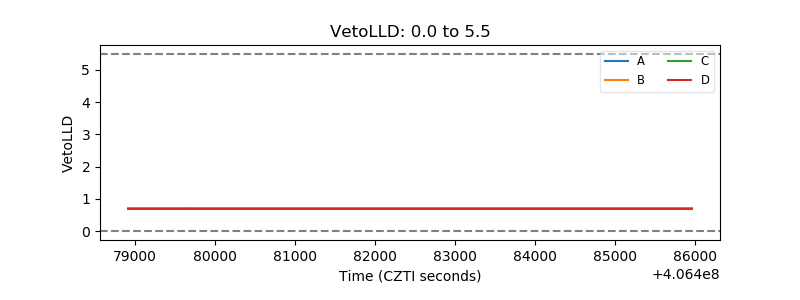 |
| Alpha Counter | 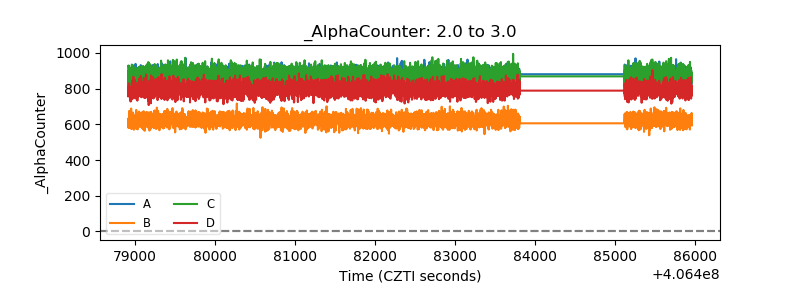 |
| _CPM_Rate | 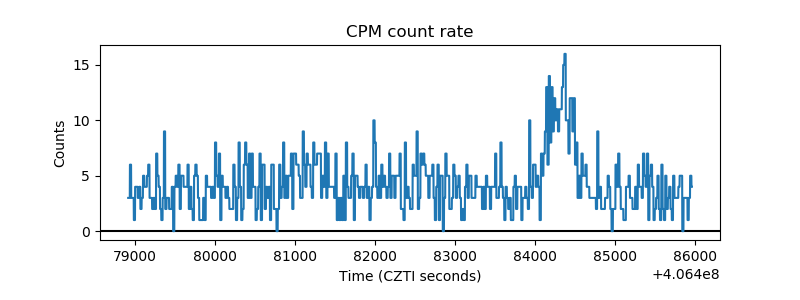 |
| CZT Counter | 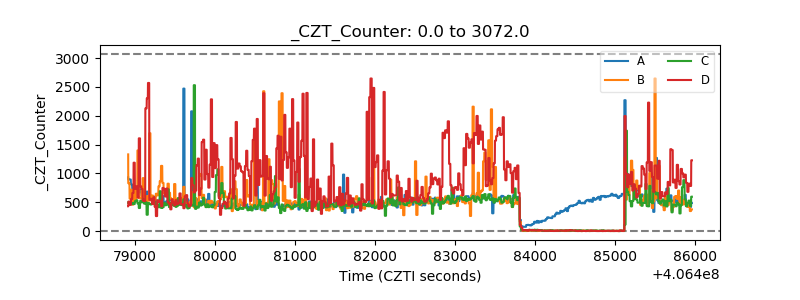 |
| +2.5 Volts monitor | 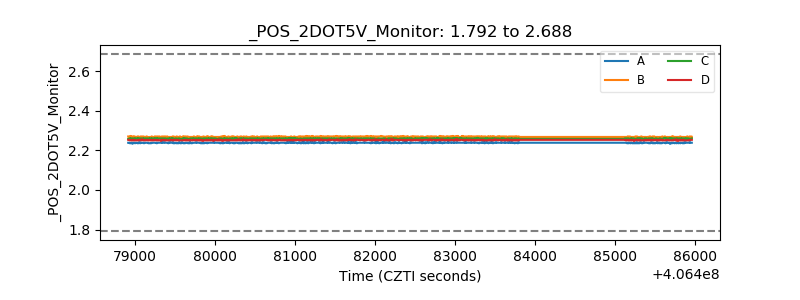 |
| +5 Volts monitor | 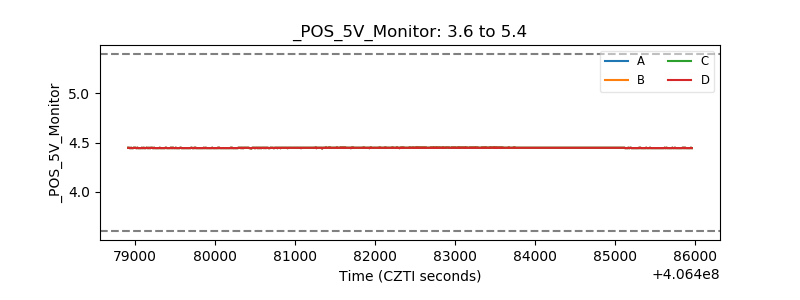 |
| _ROLL_ROT | 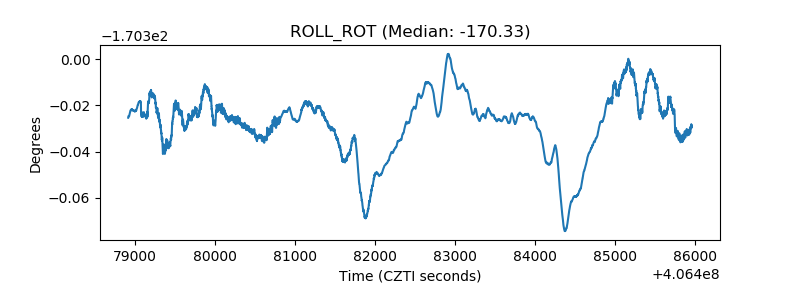 |
| _Roll_DEC | 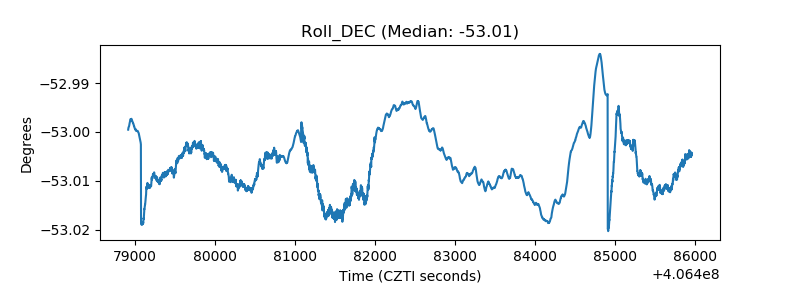 |
| _Roll_RA | 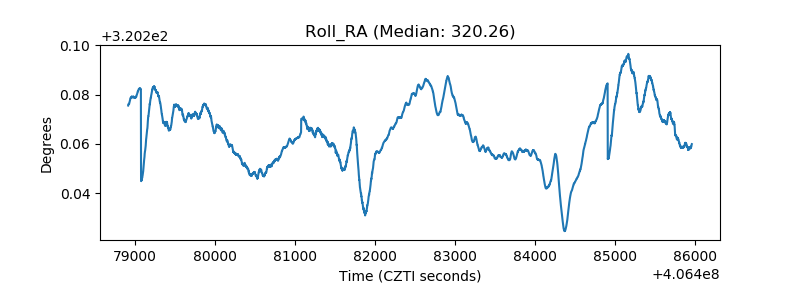 |
| Veto Counter | 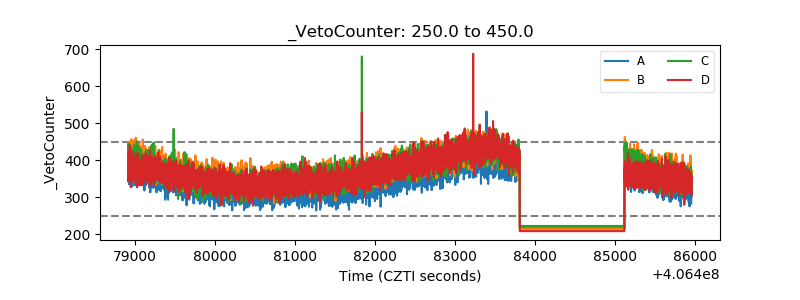 |