| Param | Original file | Final file |
|---|---|---|
| Filename | modeM0/AS1A12_052T04_9000005388_38615cztM0_level2.fits | modeM0/AS1A12_052T04_9000005388_38615cztM0_level2_quad_clean.evt |
| Size (bytes) | 689,973,120 | 160,692,480 |
| Size | 658.0 MB | 153.2 MB |
| Events in quadrant A | 5,072,657 | 1,094,056 |
| Events in quadrant B | 5,581,948 | 1,102,215 |
| Events in quadrant C | 5,369,955 | 1,050,952 |
| Events in quadrant D | 8,762,477 | 943,729 |
| Mode M0 | |||
|---|---|---|---|
| Quadrant | BADHDUFLAG | Total packets | Discarded packets |
| A | 0 | 21033 | 3 |
| B | 0 | 23143 | 2 |
| C | 0 | 22235 | 2 |
| D | 0 | 32811 | 2 |
| Mode SS | |||
|---|---|---|---|
| Quadrant | BADHDUFLAG | Total packets | Discarded packets |
| A | 0 | 196 | 0 |
| B | 0 | 196 | 0 |
| C | 0 | 196 | 0 |
| D | 0 | 196 | 0 |
| Mode M9 | |||
|---|---|---|---|
| Quadrant | BADHDUFLAG | Total packets | Discarded packets |
| A | 0 | 22 | 0 |
| B | 0 | 22 | 0 |
| C | 0 | 22 | 0 |
| D | 0 | 23 | 0 |
| Quadrant | Total seconds | Saturated seconds | Saturation percentage |
|---|---|---|---|
| A | 9730 | 26 | 0.267215% |
| B | 9730 | 171 | 1.757451% |
| C | 9730 | 110 | 1.130524% |
| D | 9730 | 518 | 5.323741% |
Noise dominated data is calculated using 1-second bins in cleaned event files. If a bin has >2000 counts, and if more than 50% of those come from <1% of pixels, then it is considered to be noise-dominated and hence unusable.
| Quadrant | # 1 sec bins | Bins with >0 counts | Bins with >2000 counts | High rate bins dominated by noise | Noise dominated (total time) | Noise dominated (detector-on time) | Marked lightcurve |
|---|---|---|---|---|---|---|---|
| A | 11043 | 9731 | 11 | 11 | 0.10% | 0.11% | 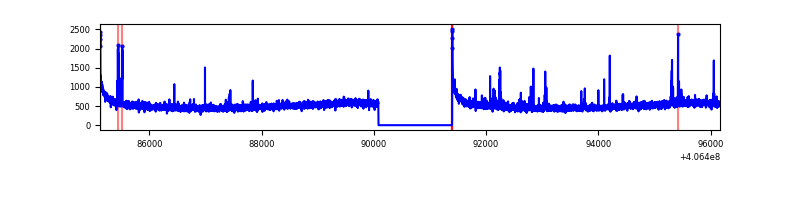 |
| B | 11043 | 9731 | 89 | 89 | 0.81% | 0.91% | 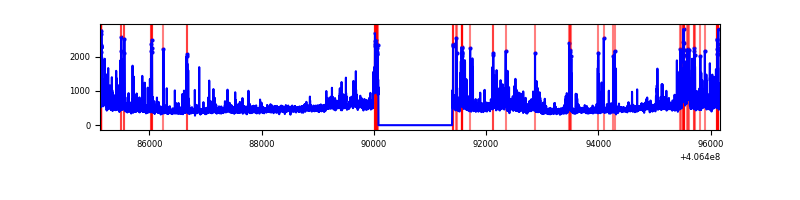 |
| C | 11043 | 9731 | 86 | 86 | 0.78% | 0.88% | 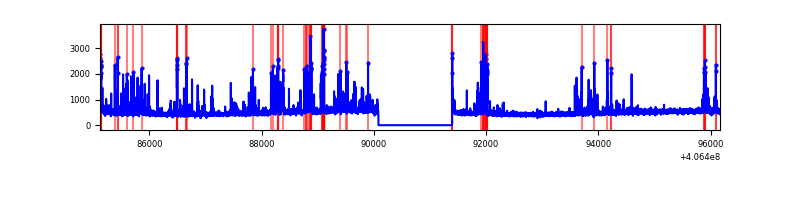 |
| D | 11043 | 9731 | 586 | 586 | 5.31% | 6.02% | 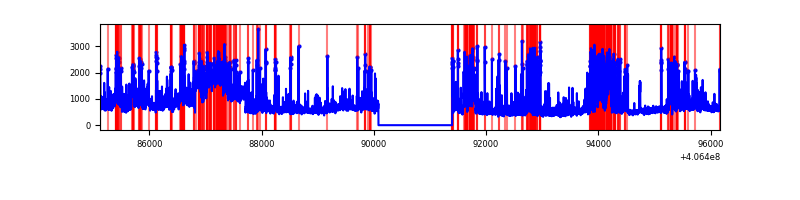 |
Top three noisy pixels from each quadrant. If the there are fewer than three noisy pixels in the level2.evt file, extra rows are filled as -1
| Pixel properties | Quadrant properties | ||||||
|---|---|---|---|---|---|---|---|
| Quadrant | DetID | PixID | Counts | Sigma | Mean | Median | Sigma |
| A | 10 | 83 | 663168 | 2952.51 | 1099 | 1078 | 224.2 |
| A | 15 | 174 | 54684 | 239.05 | 1099 | 1078 | 224.2 |
| A | 0 | 52 | 31713 | 136.61 | 1099 | 1078 | 224.2 |
| B | 0 | 183 | 569637 | 2730.64 | 1092 | 1063 | 208.2 |
| B | 5 | 172 | 140149 | 667.97 | 1092 | 1063 | 208.2 |
| B | 4 | 171 | 128614 | 612.58 | 1092 | 1063 | 208.2 |
| C | 14 | 254 | 573502 | 2310.34 | 1067 | 1077 | 247.8 |
| C | 15 | 214 | 389373 | 1567.18 | 1067 | 1077 | 247.8 |
| C | 15 | 208 | 112288 | 448.85 | 1067 | 1077 | 247.8 |
| D | 1 | 47 | 1520852 | 5893.31 | 1052 | 1020 | 257.9 |
| D | 1 | 20 | 1310746 | 5078.6 | 1052 | 1020 | 257.9 |
| D | 2 | 16 | 716554 | 2774.56 | 1052 | 1020 | 257.9 |
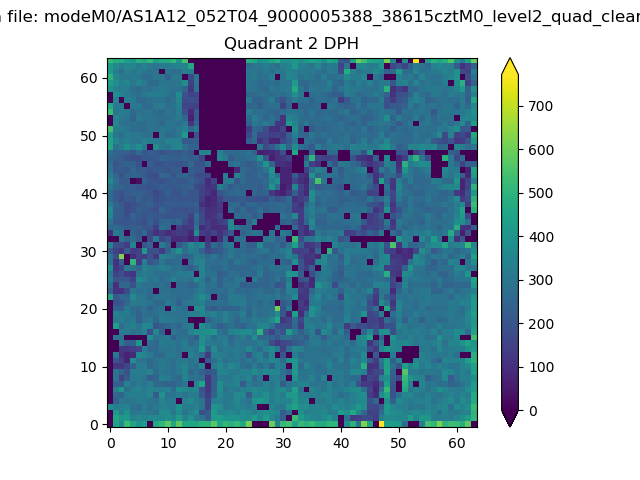
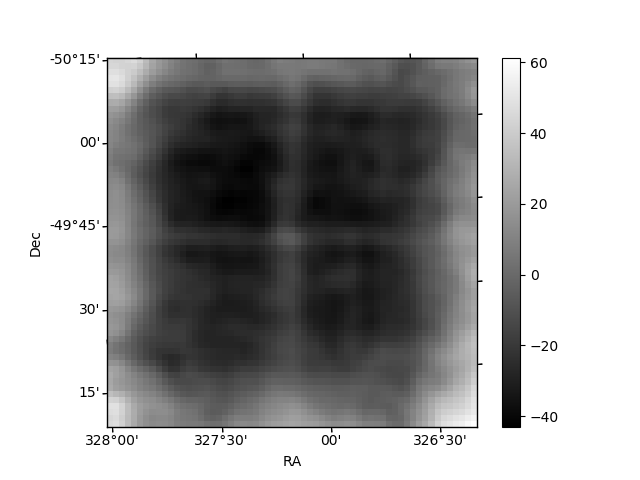
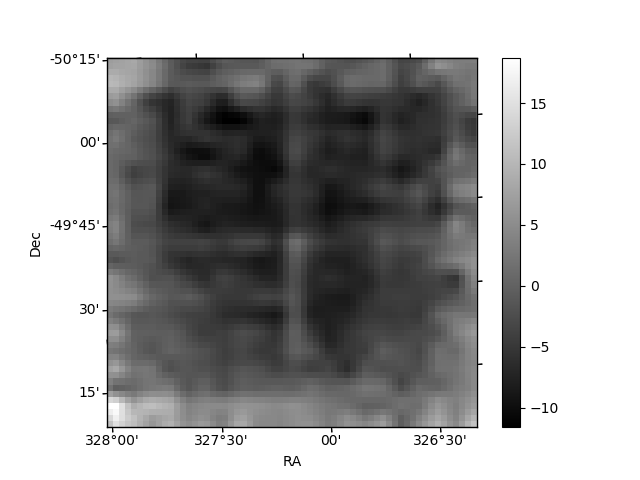
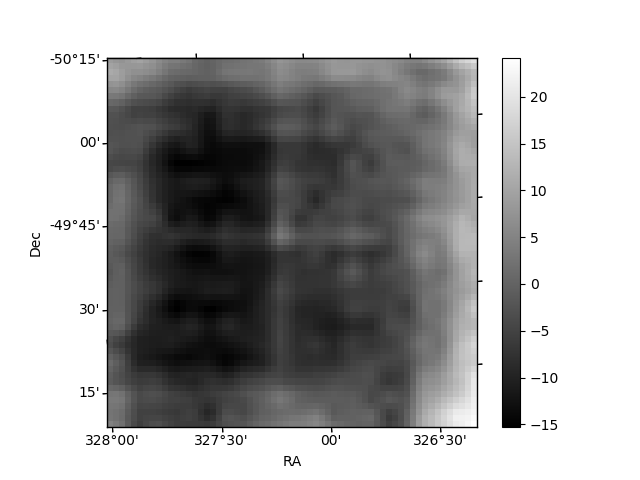
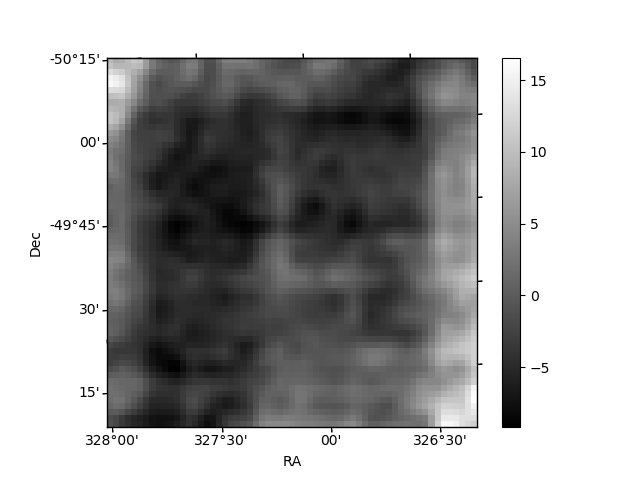
Histogram calculated using DETX and DETY for each event in the final _common_clean file
| Quadrant A | 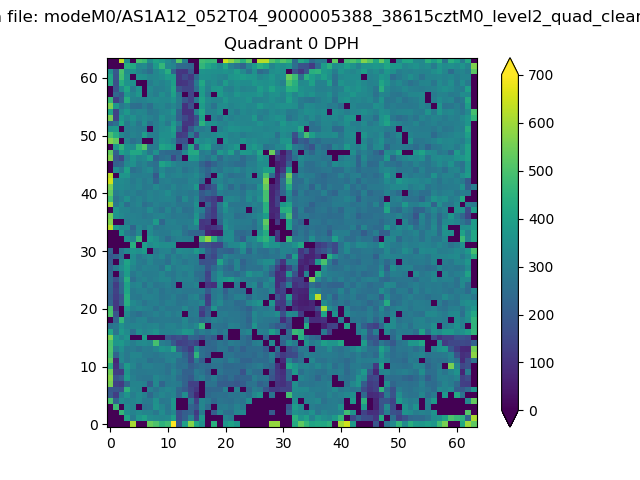 |
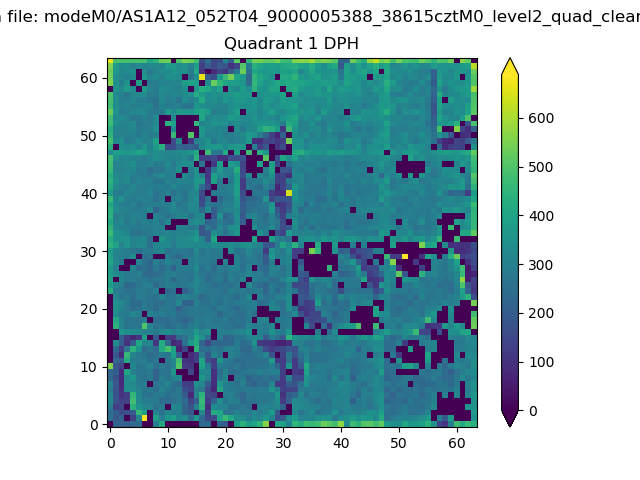 |
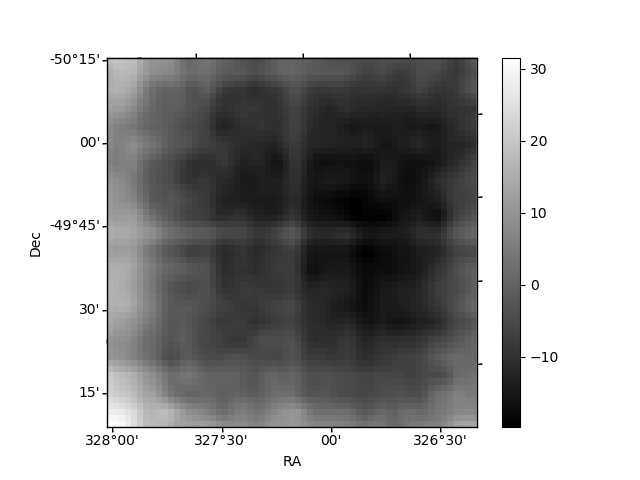
Quadrant B |
|---|---|---|---|
| Quadrant D | 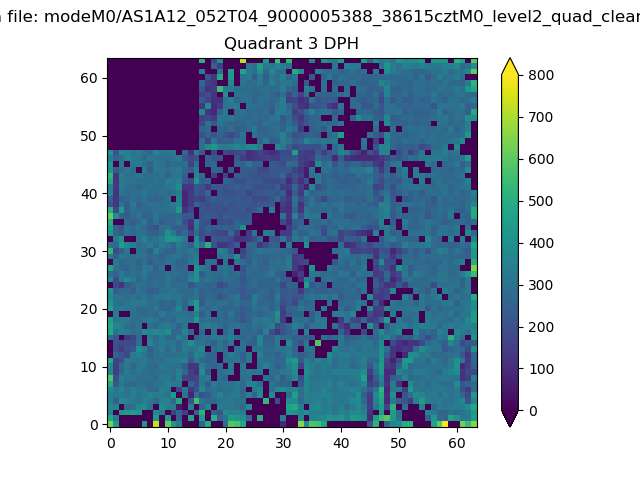 |
 |
Quadrant C |
| Plot type | Count rate plots | Images |
|---|---|---|
| Comparison with Poisson distribution Blue bars denote a histogram of data divided into 1 sec bins. Red curve is a Poisson curve with rate = median count rate of data. |
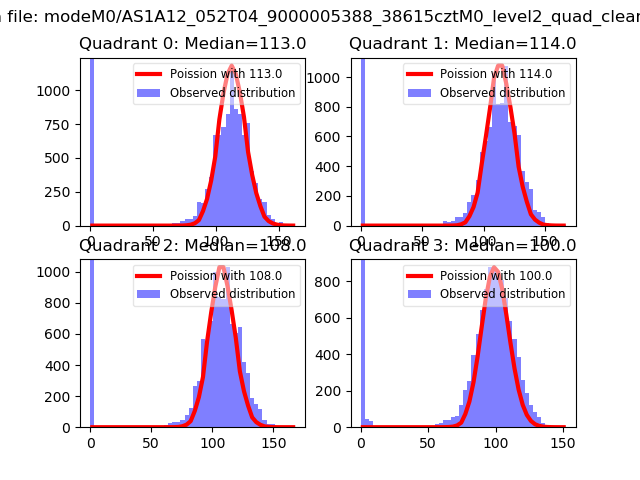 |
 |
| Quadrant-wise count rates Data is divided into 100 sec bins |
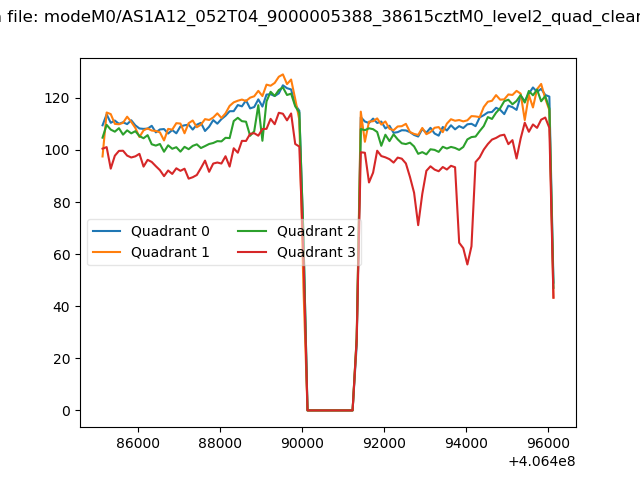 |
|
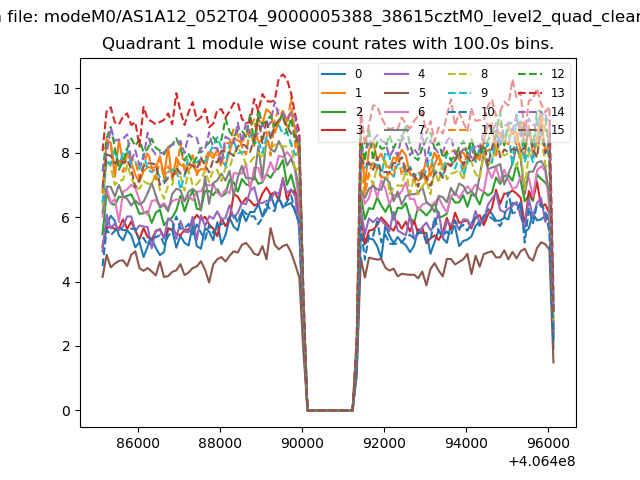
| Module-wise count rates for Quadrant A Data is divided into 100 sec bins |
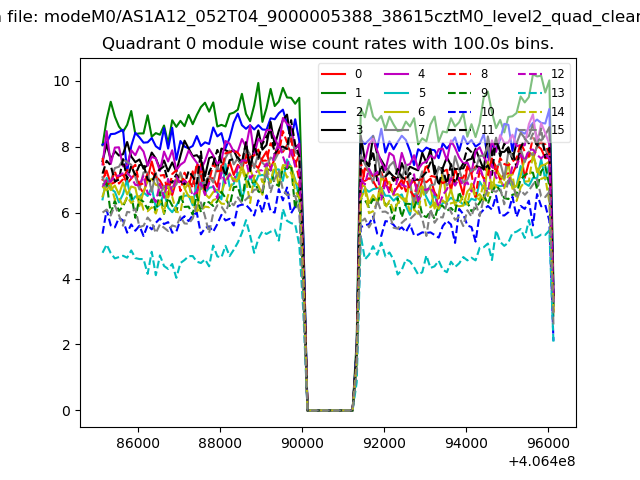 |
 |
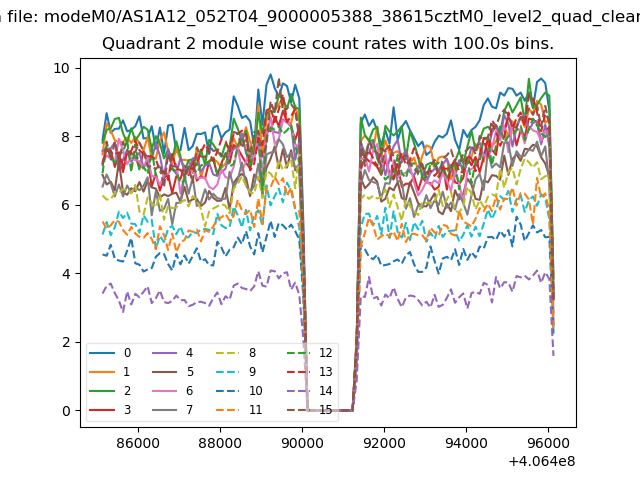
| Module-wise count rates for Quadrant B Data is divided into 100 sec bins |
 |
 |
| Module-wise count rates for Quadrant C Data is divided into 100 sec bins |
 |
 |
| Module-wise count rates for Quadrant D Data is divided into 100 sec bins |
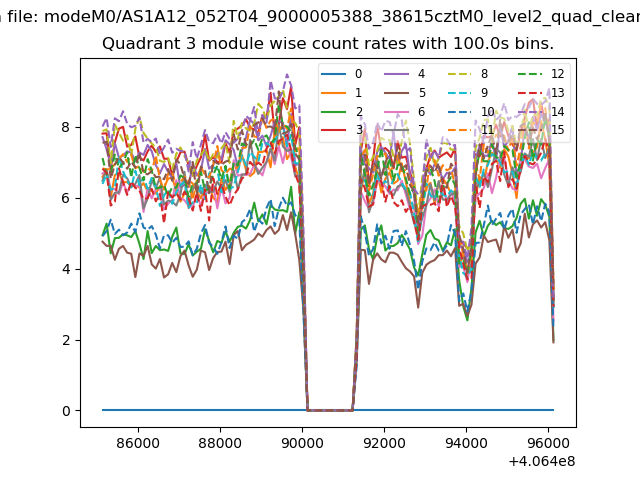 |
 |
| Parameter | Plot |
|---|---|
| CZT HV Monitor | 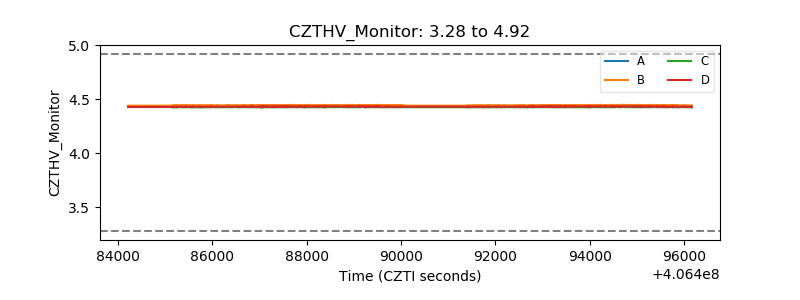 |
| D_VDD | 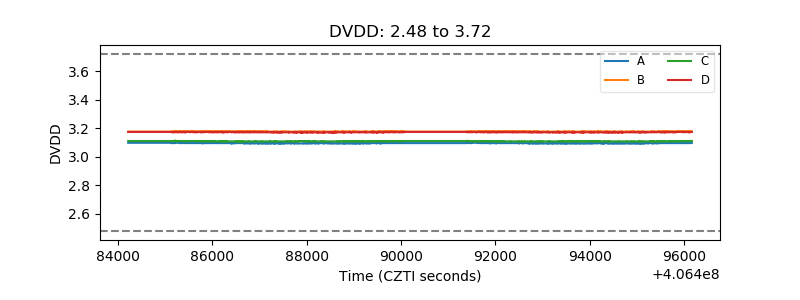 |
| Temperature 1 | 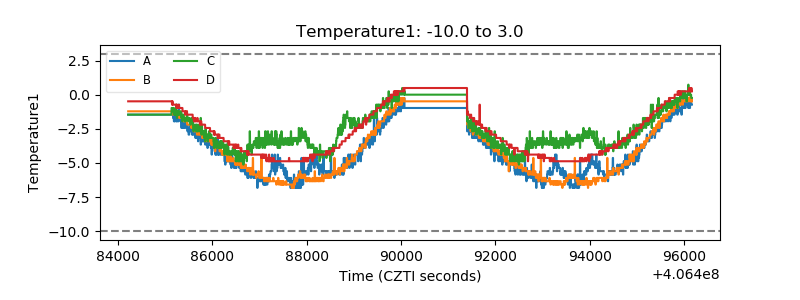 |
| Veto HV Monitor | 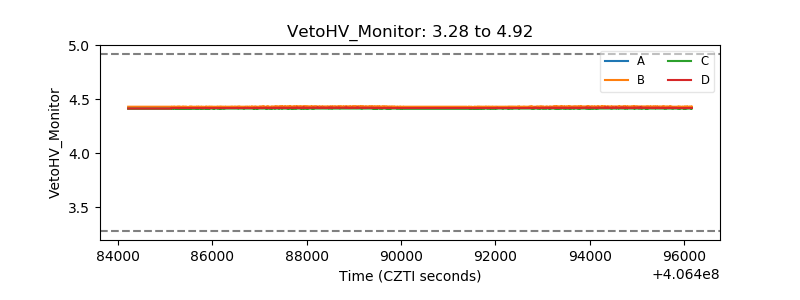 |
| Veto LLD | 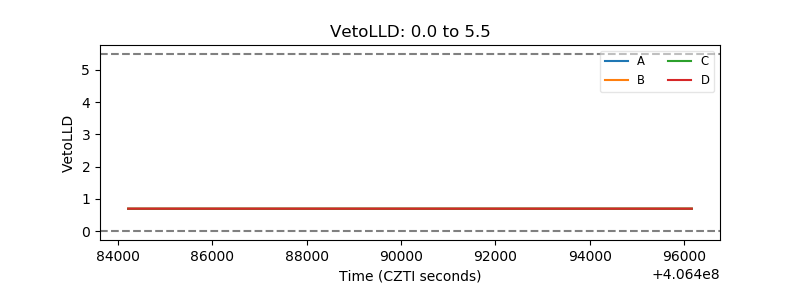 |
| Alpha Counter | 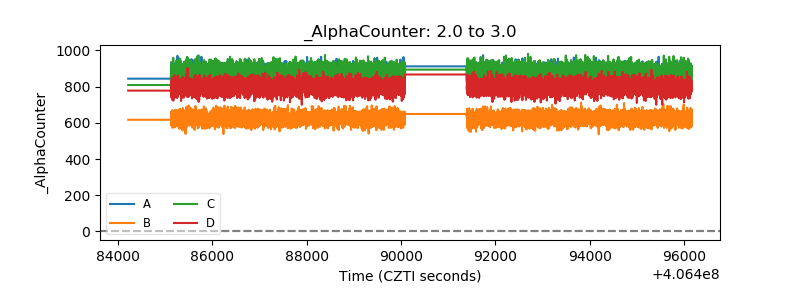 |
| _CPM_Rate | 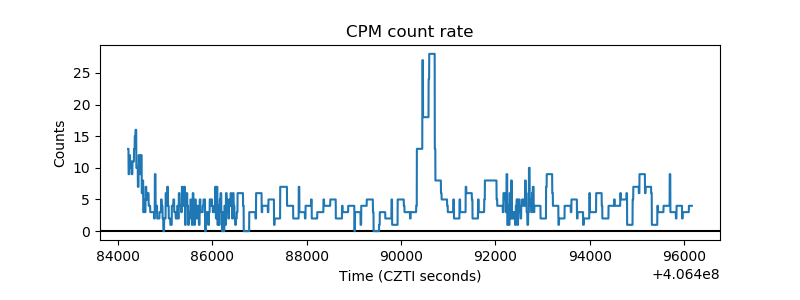 |
| CZT Counter | 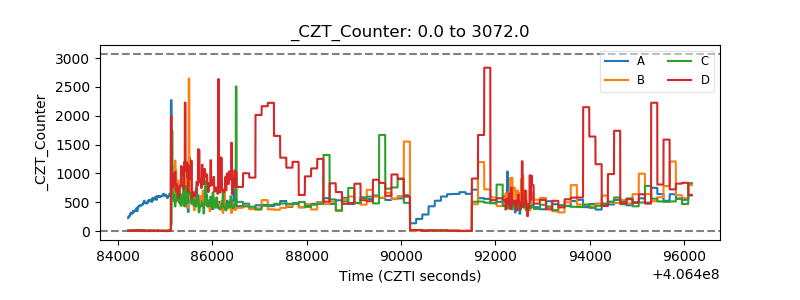 |
| +2.5 Volts monitor | 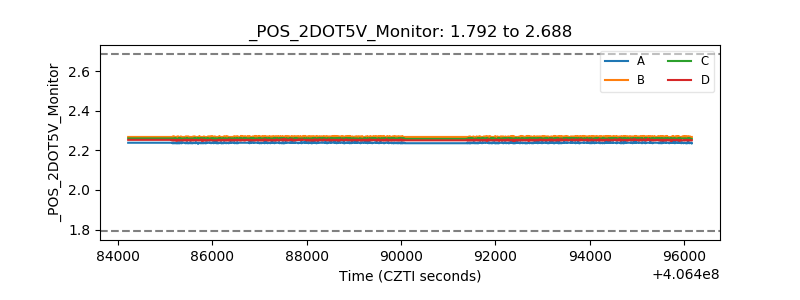 |
| +5 Volts monitor |  |
| _ROLL_ROT | 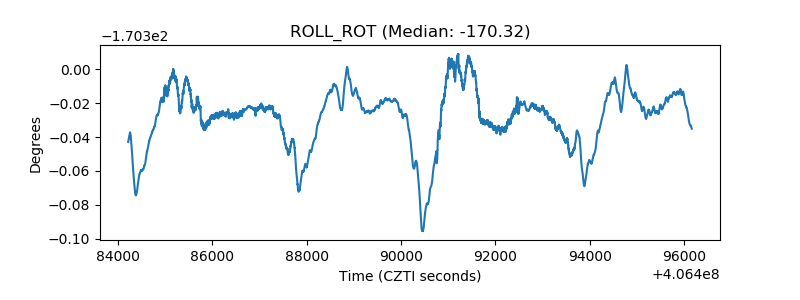 |
| _Roll_DEC | 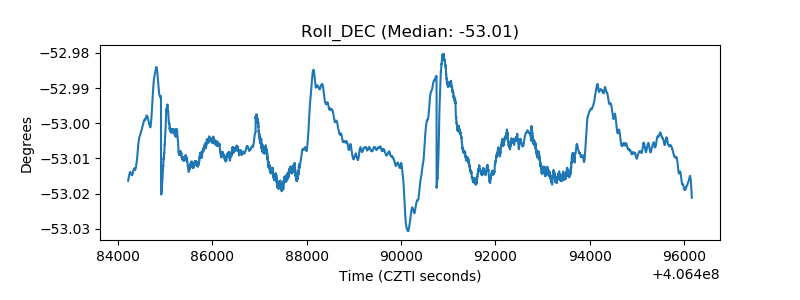 |
| _Roll_RA | 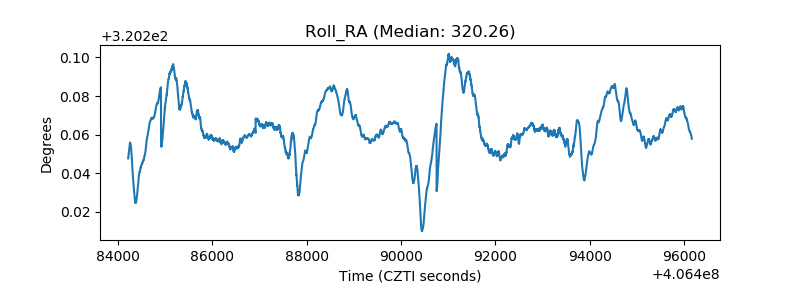 |
| Veto Counter | 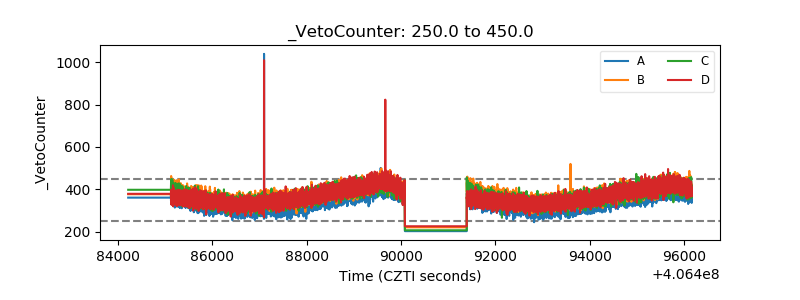 |