| Param | Original file | Final file |
|---|---|---|
| Filename | modeM0/AS1A12_052T04_9000005388_38616cztM0_level2.fits | modeM0/AS1A12_052T04_9000005388_38616cztM0_level2_quad_clean.evt |
| Size (bytes) | 753,140,160 | 179,311,680 |
| Size | 718.3 MB | 171.0 MB |
| Events in quadrant A | 5,741,385 | 1,227,203 |
| Events in quadrant B | 6,619,977 | 1,243,227 |
| Events in quadrant C | 6,265,820 | 1,157,680 |
| Events in quadrant D | 8,405,892 | 1,045,284 |
| Mode M0 | |||
|---|---|---|---|
| Quadrant | BADHDUFLAG | Total packets | Discarded packets |
| A | 0 | 23653 | 4 |
| B | 0 | 26918 | 3 |
| C | 0 | 25348 | 3 |
| D | 0 | 32482 | 3 |
| Mode SS | |||
|---|---|---|---|
| Quadrant | BADHDUFLAG | Total packets | Discarded packets |
| A | 0 | 224 | 0 |
| B | 0 | 224 | 0 |
| C | 0 | 224 | 0 |
| D | 0 | 224 | 0 |
| Mode M9 | |||
|---|---|---|---|
| Quadrant | BADHDUFLAG | Total packets | Discarded packets |
| A | 0 | 45 | 0 |
| B | 0 | 45 | 0 |
| C | 0 | 45 | 0 |
| D | 0 | 45 | 0 |
| Quadrant | Total seconds | Saturated seconds | Saturation percentage |
|---|---|---|---|
| A | 10915 | 27 | 0.247366% |
| B | 10915 | 214 | 1.960605% |
| C | 10915 | 364 | 3.334860% |
| D | 10915 | 669 | 6.129180% |
Noise dominated data is calculated using 1-second bins in cleaned event files. If a bin has >2000 counts, and if more than 50% of those come from <1% of pixels, then it is considered to be noise-dominated and hence unusable.
| Quadrant | # 1 sec bins | Bins with >0 counts | Bins with >2000 counts | High rate bins dominated by noise | Noise dominated (total time) | Noise dominated (detector-on time) | Marked lightcurve |
|---|---|---|---|---|---|---|---|
| A | 15392 | 10918 | 13 | 13 | 0.08% | 0.12% | 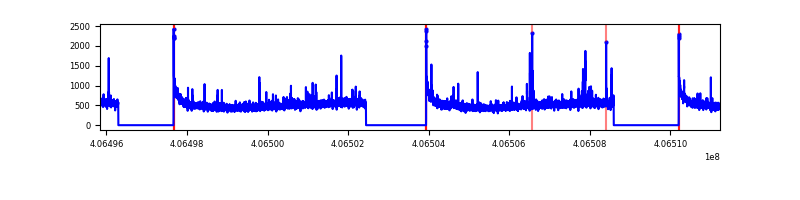 |
| B | 15392 | 10918 | 116 | 116 | 0.75% | 1.06% | 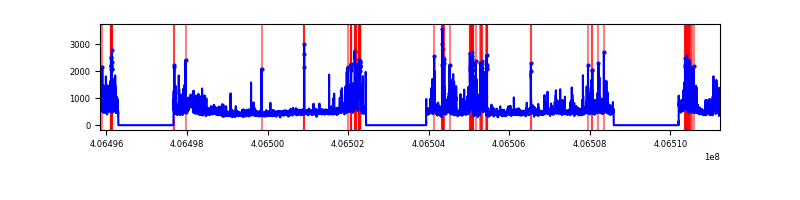 |
| C | 15392 | 10918 | 295 | 295 | 1.92% | 2.70% | 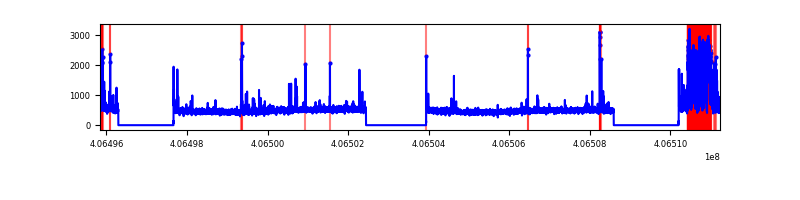 |
| D | 15392 | 10918 | 619 | 619 | 4.02% | 5.67% | 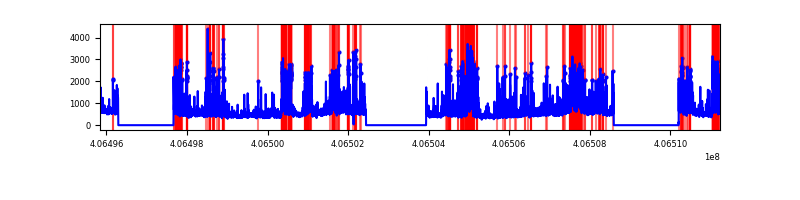 |
Top three noisy pixels from each quadrant. If the there are fewer than three noisy pixels in the level2.evt file, extra rows are filled as -1
| Pixel properties | Quadrant properties | ||||||
|---|---|---|---|---|---|---|---|
| Quadrant | DetID | PixID | Counts | Sigma | Mean | Median | Sigma |
| A | 10 | 83 | 786699 | 3134.86 | 1238 | 1211 | 250.6 |
| A | 13 | 248 | 46626 | 181.25 | 1238 | 1211 | 250.6 |
| A | 7 | 3 | 40070 | 155.09 | 1238 | 1211 | 250.6 |
| B | 4 | 171 | 1015685 | 4340.59 | 1228 | 1196 | 233.7 |
| B | 0 | 183 | 331604 | 1413.68 | 1228 | 1196 | 233.7 |
| B | 0 | 186 | 93691 | 395.75 | 1228 | 1196 | 233.7 |
| C | 14 | 254 | 1081508 | 3890.99 | 1191 | 1199 | 277.6 |
| C | 15 | 214 | 439266 | 1577.8 | 1191 | 1199 | 277.6 |
| C | 15 | 159 | 43703 | 153.09 | 1191 | 1199 | 277.6 |
| D | 1 | 47 | 1412144 | 4920.92 | 1176 | 1143 | 286.7 |
| D | 2 | 249 | 726459 | 2529.57 | 1176 | 1143 | 286.7 |
| D | 2 | 16 | 424062 | 1474.95 | 1176 | 1143 | 286.7 |
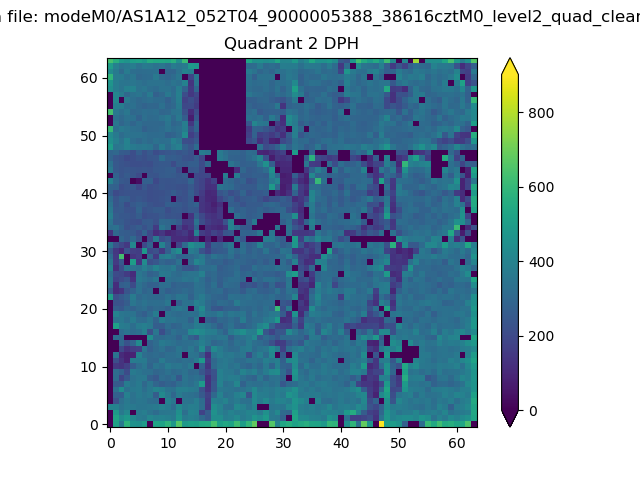
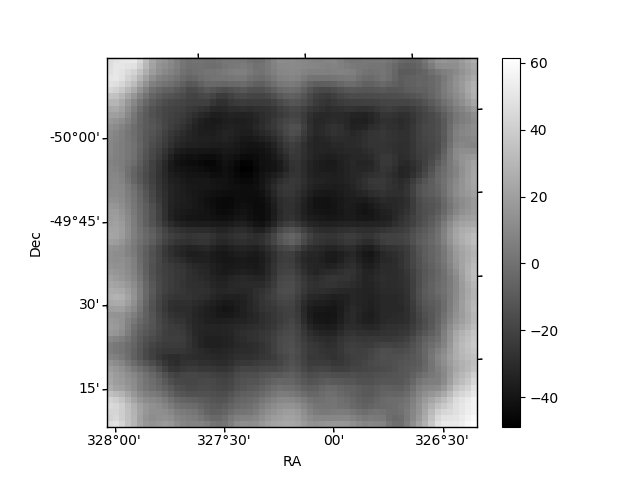
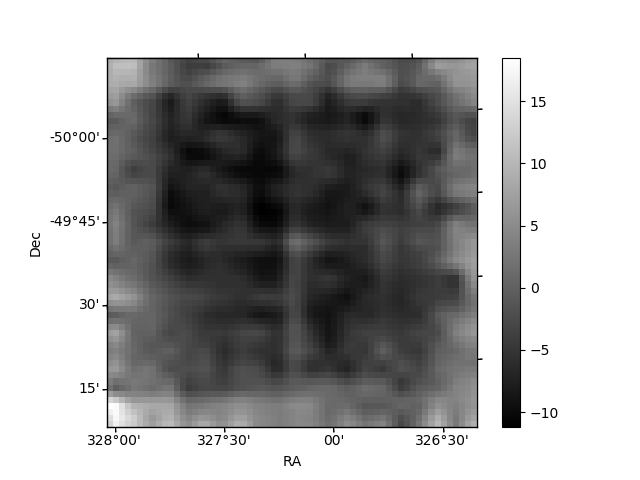
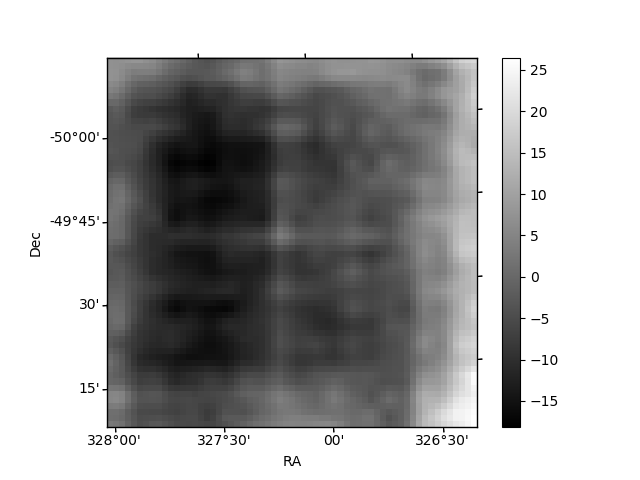
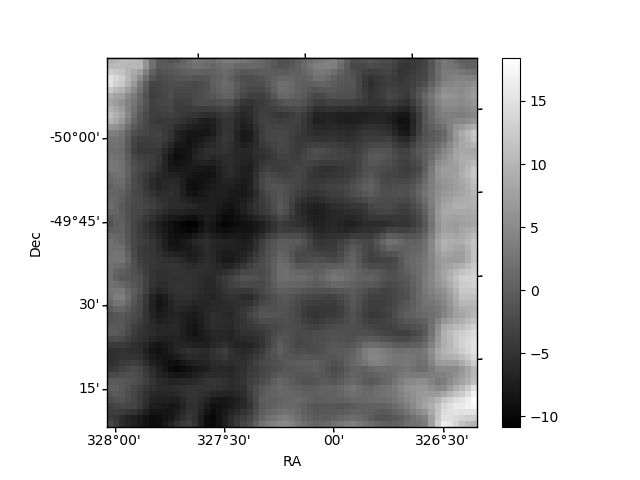
Histogram calculated using DETX and DETY for each event in the final _common_clean file
| Quadrant A | 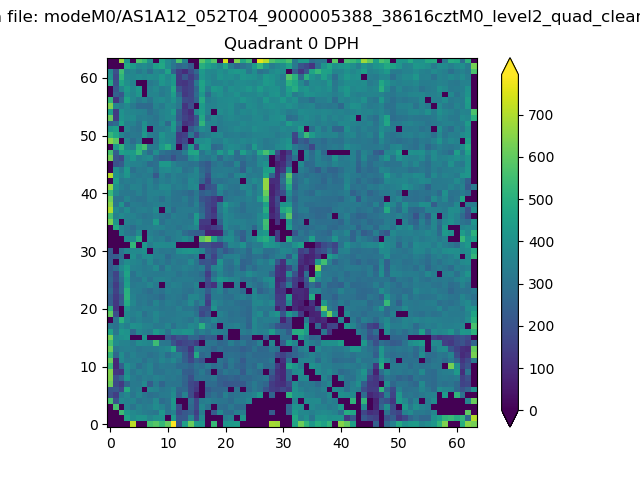 |
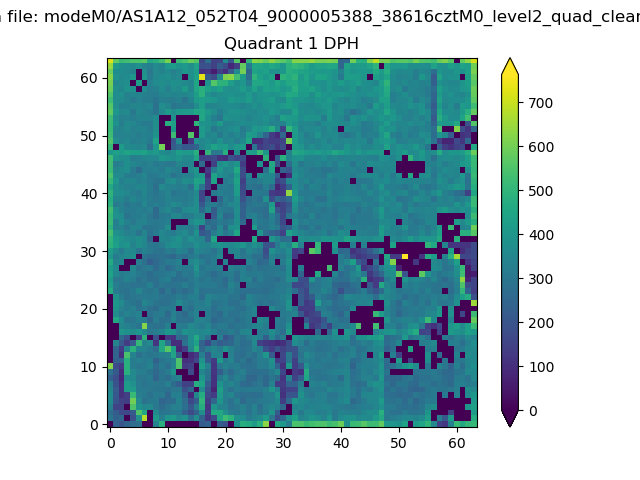 |
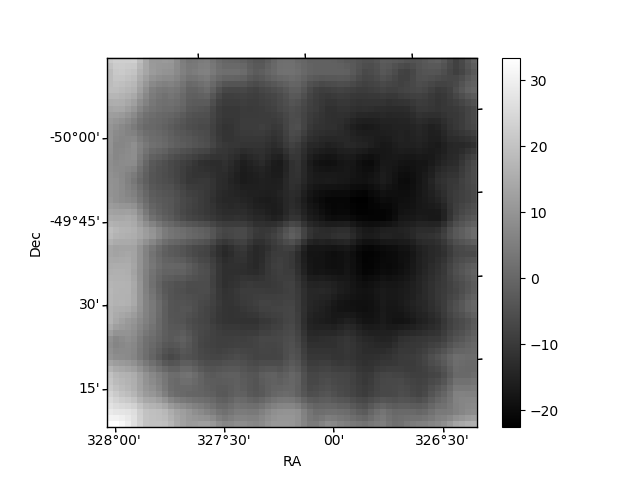
Quadrant B |
|---|---|---|---|
| Quadrant D | 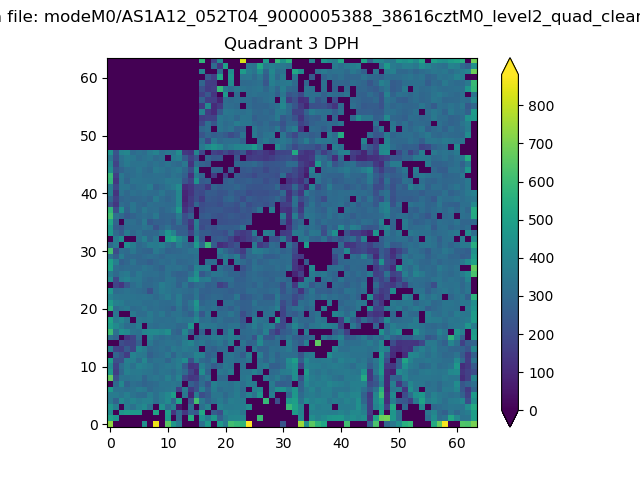 |
 |
Quadrant C |
| Plot type | Count rate plots | Images |
|---|---|---|
| Comparison with Poisson distribution Blue bars denote a histogram of data divided into 1 sec bins. Red curve is a Poisson curve with rate = median count rate of data. |
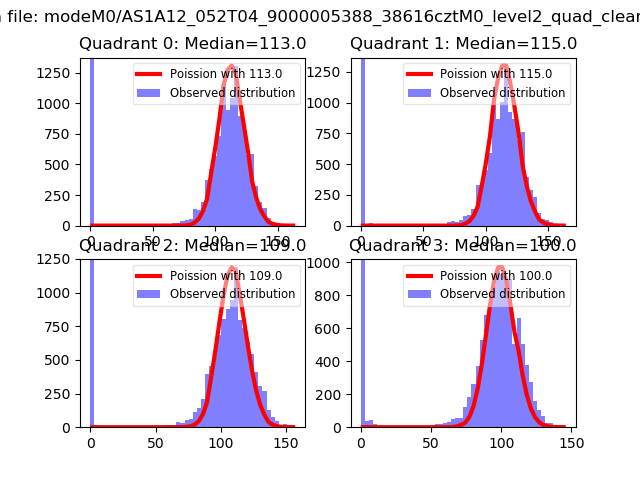 |
 |
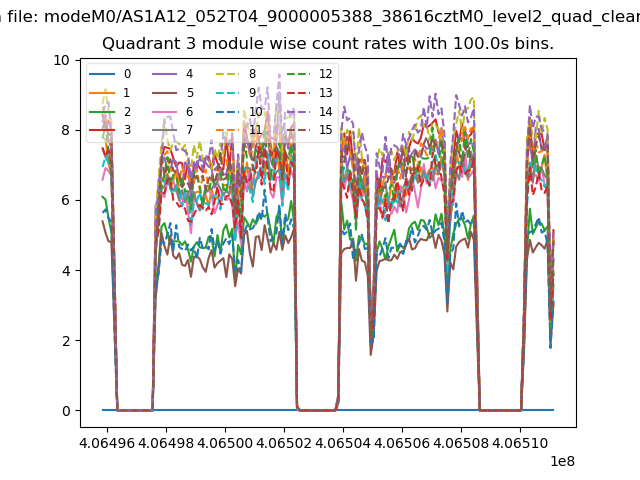
| Quadrant-wise count rates Data is divided into 100 sec bins |
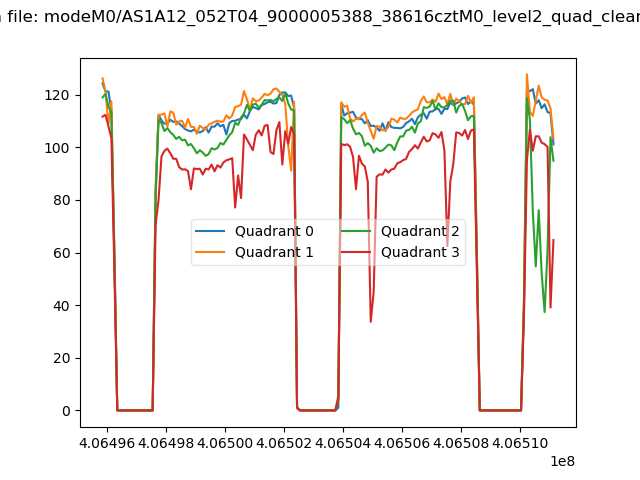 |
|
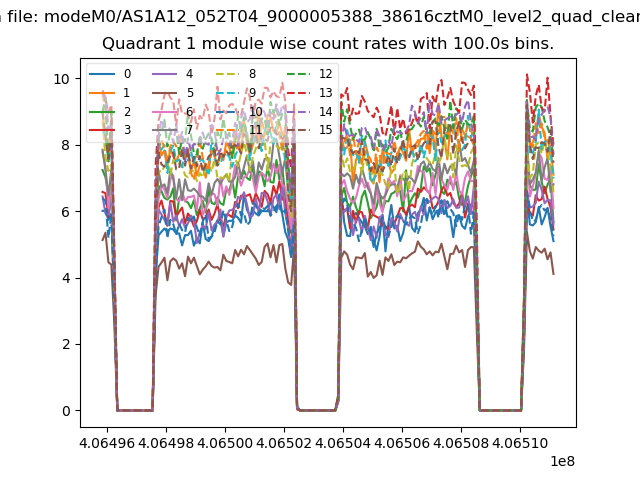
| Module-wise count rates for Quadrant A Data is divided into 100 sec bins |
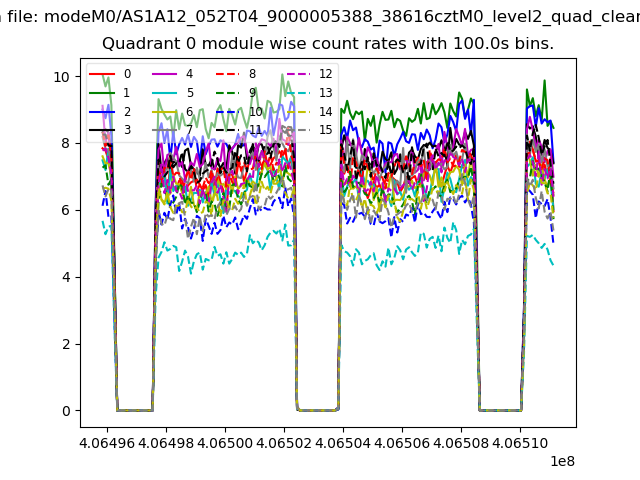 |
 |
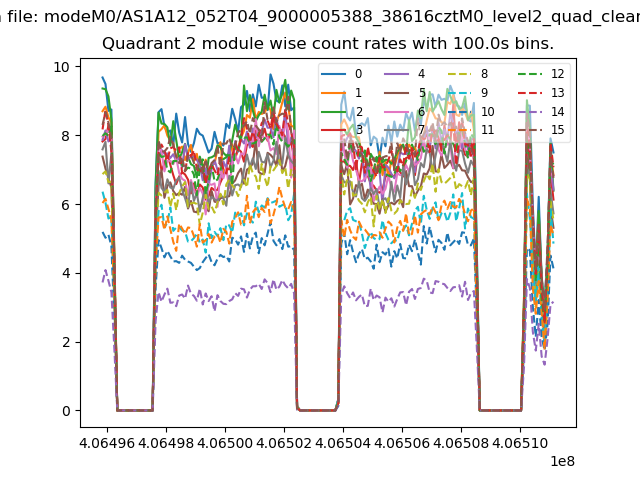
| Module-wise count rates for Quadrant B Data is divided into 100 sec bins |
 |
 |
| Module-wise count rates for Quadrant C Data is divided into 100 sec bins |
 |
 |
| Module-wise count rates for Quadrant D Data is divided into 100 sec bins |
 |
 |
| Parameter | Plot |
|---|---|
| CZT HV Monitor | 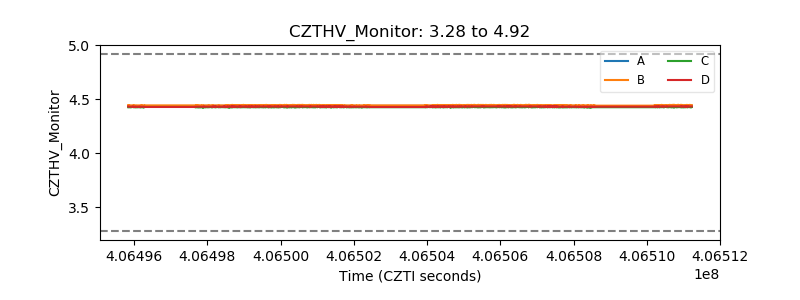 |
| D_VDD | 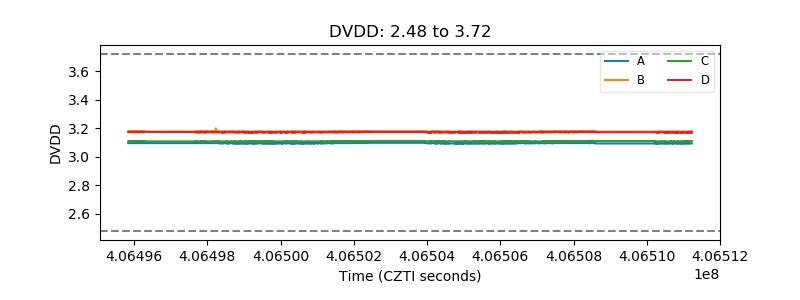 |
| Temperature 1 | 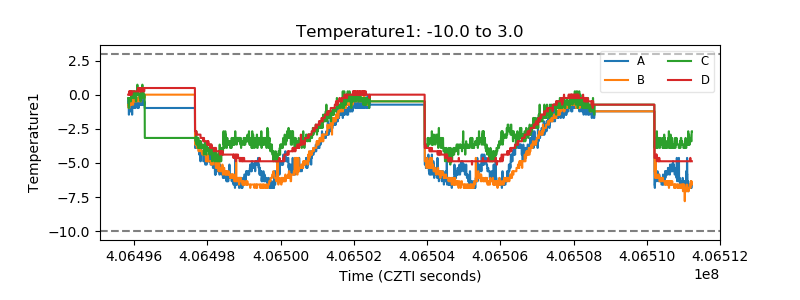 |
| Veto HV Monitor | 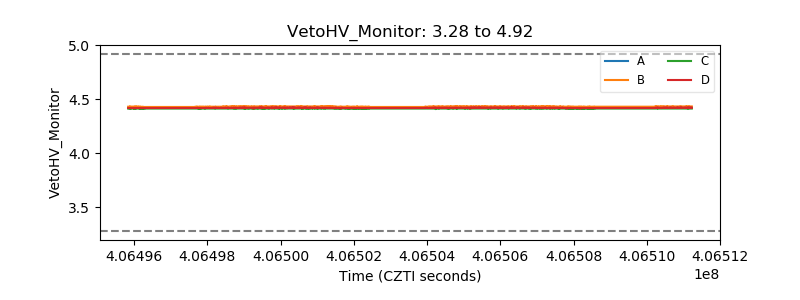 |
| Veto LLD | 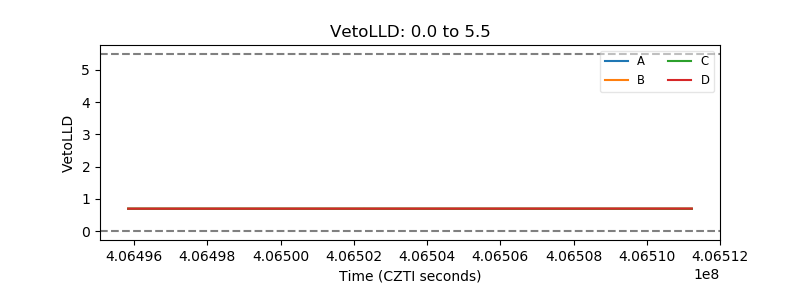 |
| Alpha Counter | 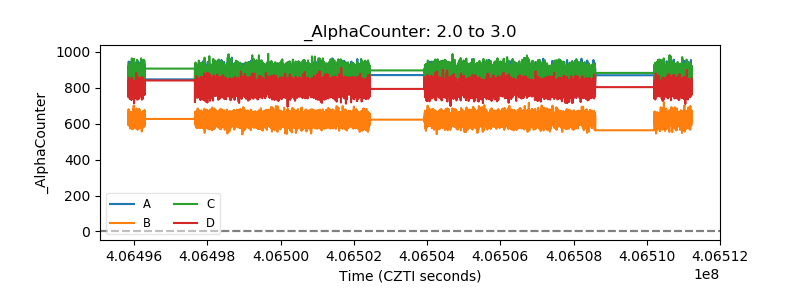 |
| _CPM_Rate | 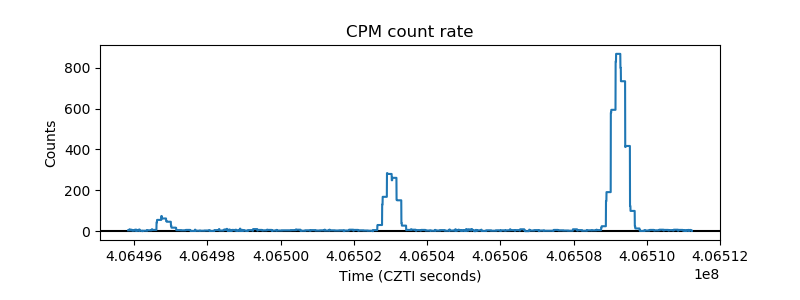 |
| CZT Counter | 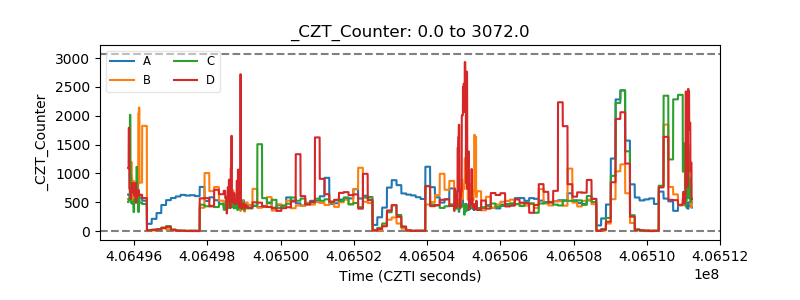 |
| +2.5 Volts monitor | 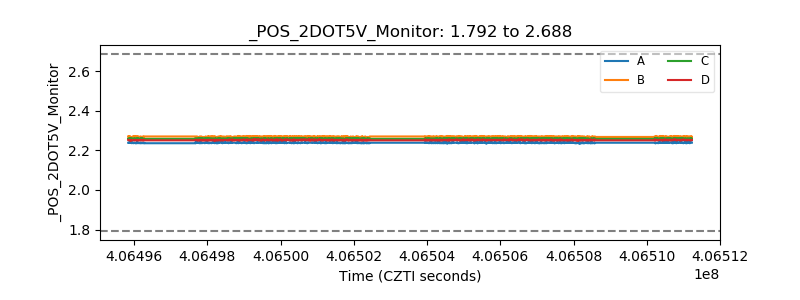 |
| +5 Volts monitor |  |
| _ROLL_ROT | 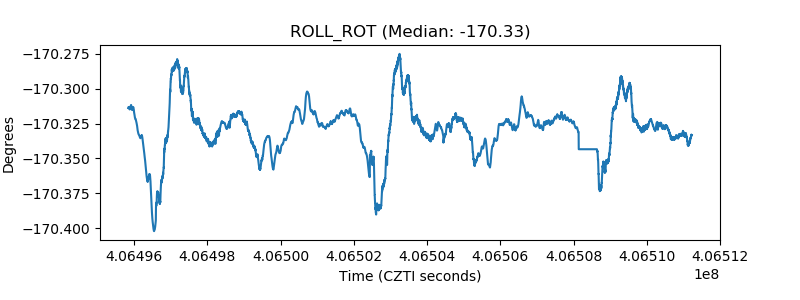 |
| _Roll_DEC | 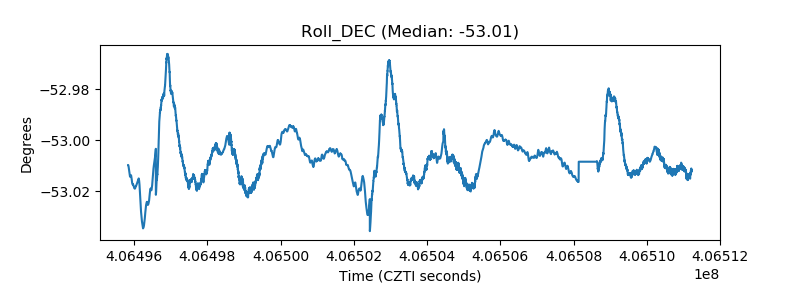 |
| _Roll_RA | 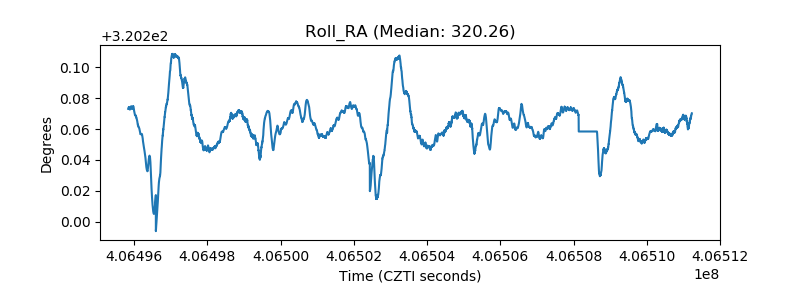 |
| Veto Counter | 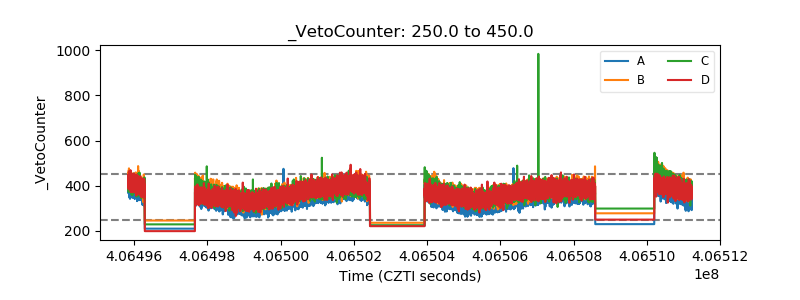 |