| Param | Original file | Final file |
|---|---|---|
| Filename | modeM0/AS1A12_052T04_9000005388_38618cztM0_level2.fits | modeM0/AS1A12_052T04_9000005388_38618cztM0_level2_quad_clean.evt |
| Size (bytes) | 454,248,000 | 90,509,760 |
| Size | 433.2 MB | 86.3 MB |
| Events in quadrant A | 3,262,264 | 614,205 |
| Events in quadrant B | 3,266,288 | 650,272 |
| Events in quadrant C | 4,088,752 | 583,409 |
| Events in quadrant D | 5,777,430 | 514,175 |
| Mode M0 | |||
|---|---|---|---|
| Quadrant | BADHDUFLAG | Total packets | Discarded packets |
| A | 0 | 12879 | 3 |
| B | 0 | 13241 | 2 |
| C | 0 | 15474 | 2 |
| D | 0 | 20890 | 2 |
| Mode SS | |||
|---|---|---|---|
| Quadrant | BADHDUFLAG | Total packets | Discarded packets |
| A | 0 | 110 | 0 |
| B | 0 | 110 | 0 |
| C | 0 | 110 | 0 |
| D | 0 | 110 | 0 |
| Mode M9 | |||
|---|---|---|---|
| Quadrant | BADHDUFLAG | Total packets | Discarded packets |
| A | 0 | 32 | 0 |
| B | 0 | 32 | 0 |
| C | 0 | 32 | 0 |
| D | 0 | 33 | 0 |
| Quadrant | Total seconds | Saturated seconds | Saturation percentage |
|---|---|---|---|
| A | 5407 | 190 | 3.513963% |
| B | 5407 | 64 | 1.183651% |
| C | 5407 | 384 | 7.101905% |
| D | 5407 | 711 | 13.149621% |
Noise dominated data is calculated using 1-second bins in cleaned event files. If a bin has >2000 counts, and if more than 50% of those come from <1% of pixels, then it is considered to be noise-dominated and hence unusable.
| Quadrant | # 1 sec bins | Bins with >0 counts | Bins with >2000 counts | High rate bins dominated by noise | Noise dominated (total time) | Noise dominated (detector-on time) | Marked lightcurve |
|---|---|---|---|---|---|---|---|
| A | 7170 | 5408 | 183 | 183 | 2.55% | 3.38% | 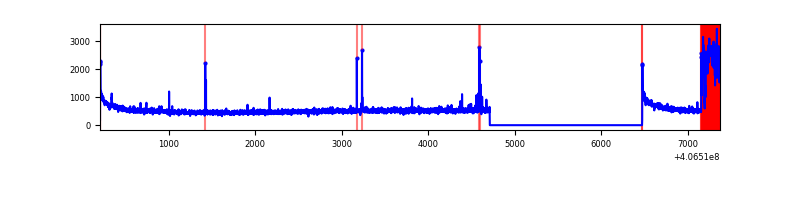 |
| B | 7170 | 5408 | 29 | 29 | 0.40% | 0.54% | 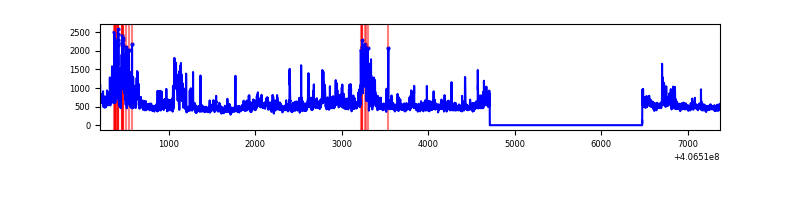 |
| C | 7170 | 5408 | 318 | 318 | 4.44% | 5.88% | 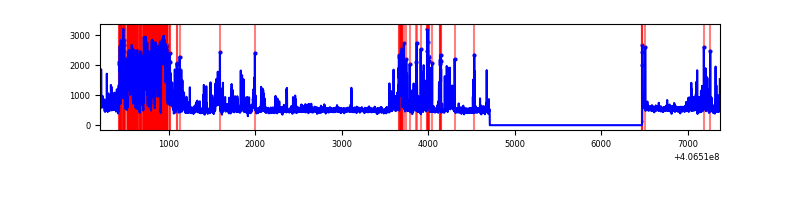 |
| D | 7170 | 5408 | 718 | 718 | 10.01% | 13.28% | 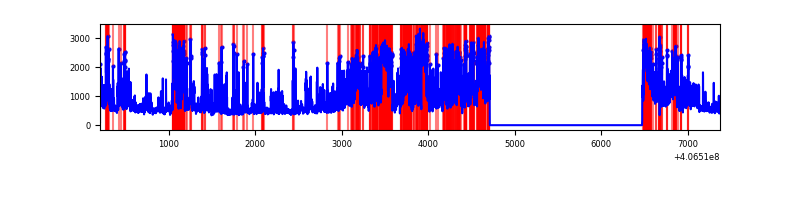 |
Top three noisy pixels from each quadrant. If the there are fewer than three noisy pixels in the level2.evt file, extra rows are filled as -1
| Pixel properties | Quadrant properties | ||||||
|---|---|---|---|---|---|---|---|
| Quadrant | DetID | PixID | Counts | Sigma | Mean | Median | Sigma |
| A | 15 | 223 | 431531 | 3516.52 | 609 | 596 | 122.5 |
| A | 10 | 83 | 408769 | 3330.77 | 609 | 596 | 122.5 |
| A | 9 | 143 | 27248 | 217.49 | 609 | 596 | 122.5 |
| B | 4 | 171 | 772969 | 6559.13 | 619 | 605 | 117.8 |
| B | 5 | 172 | 15049 | 122.66 | 619 | 605 | 117.8 |
| B | 12 | 111 | 14410 | 117.24 | 619 | 605 | 117.8 |
| C | 14 | 254 | 1498033 | 10883.54 | 591 | 594 | 137.6 |
| C | 15 | 214 | 215331 | 1560.73 | 591 | 594 | 137.6 |
| C | 15 | 159 | 39551 | 283.14 | 591 | 594 | 137.6 |
| D | 12 | 227 | 1155578 | 8236.34 | 575 | 560 | 140.2 |
| D | 2 | 249 | 1007680 | 7181.69 | 575 | 560 | 140.2 |
| D | 1 | 47 | 564717 | 4022.96 | 575 | 560 | 140.2 |
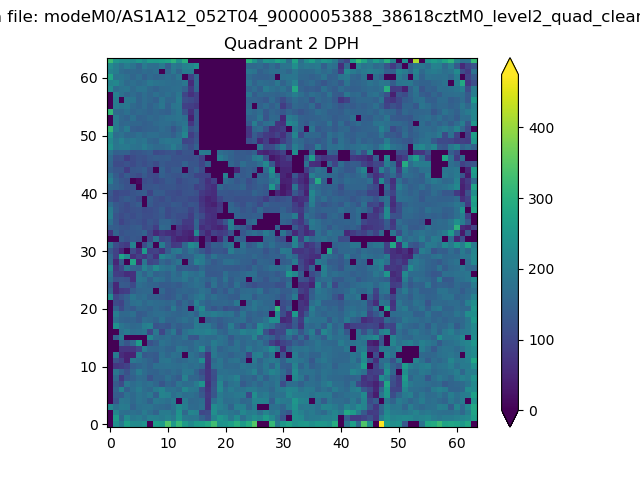
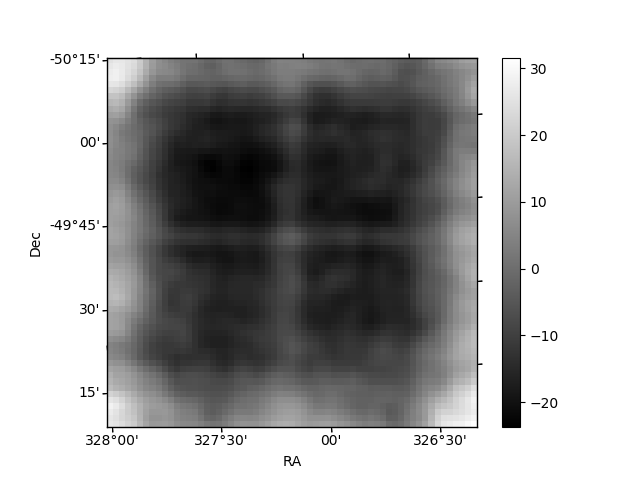
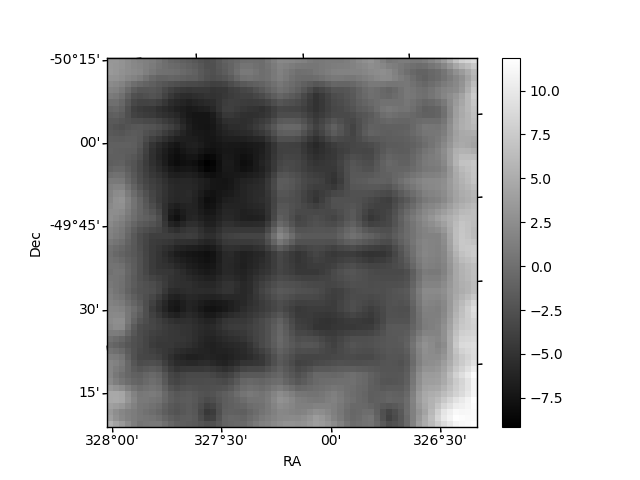
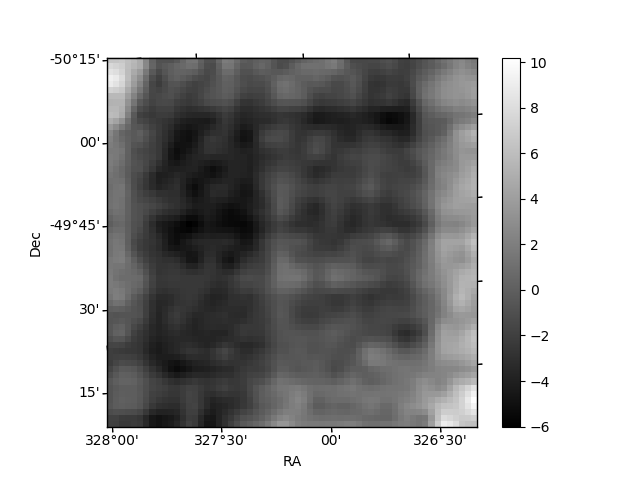
Histogram calculated using DETX and DETY for each event in the final _common_clean file
| Quadrant A | 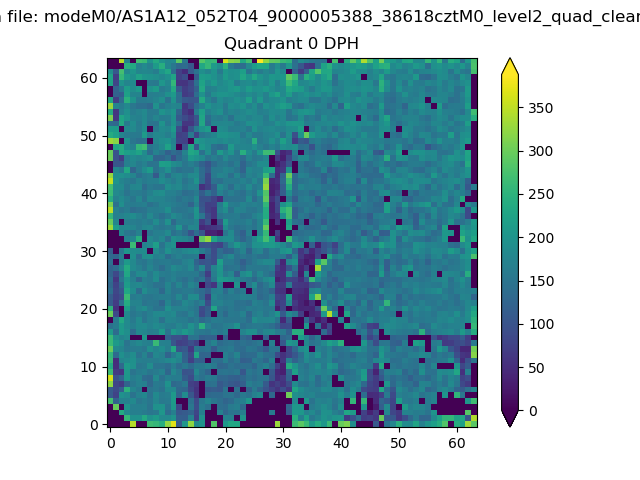 |
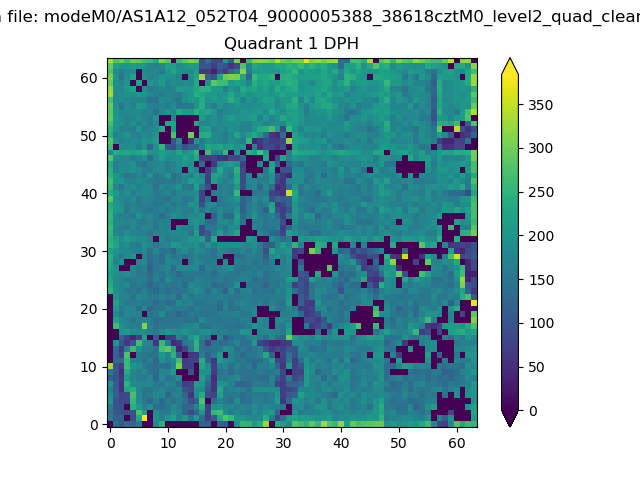 |
Quadrant B |
|---|---|---|---|
| Quadrant D | 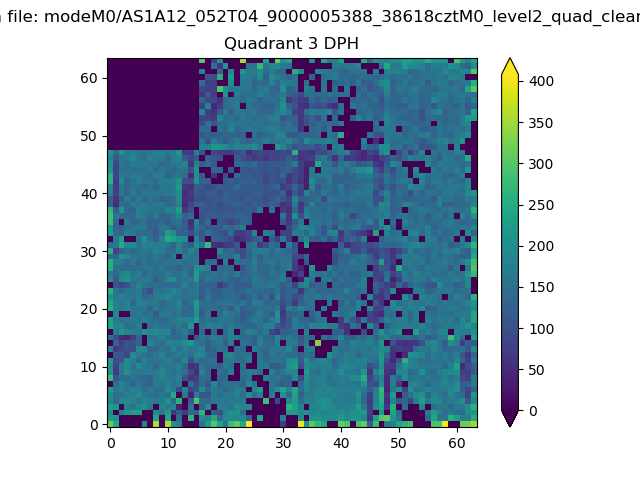 |
 |
Quadrant C |
| Plot type | Count rate plots | Images |
|---|---|---|
| Comparison with Poisson distribution Blue bars denote a histogram of data divided into 1 sec bins. Red curve is a Poisson curve with rate = median count rate of data. |
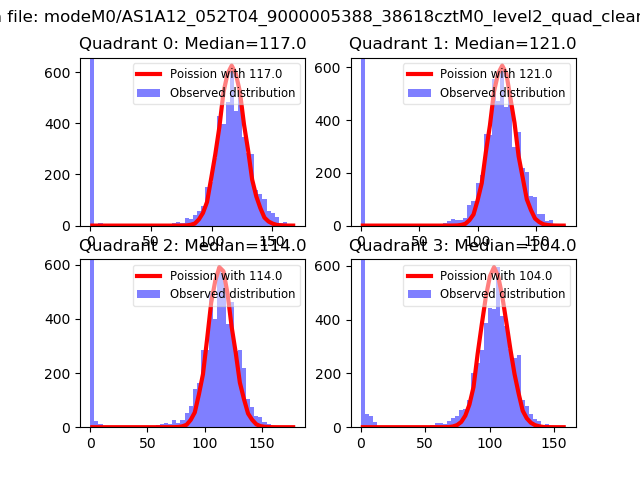 |
 |
| Quadrant-wise count rates Data is divided into 100 sec bins |
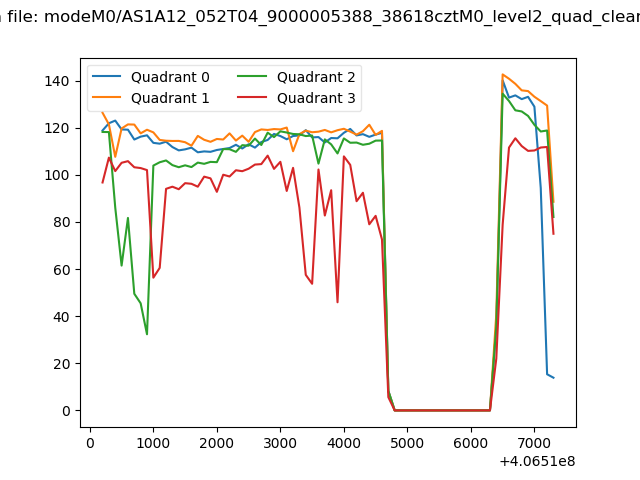 |
|
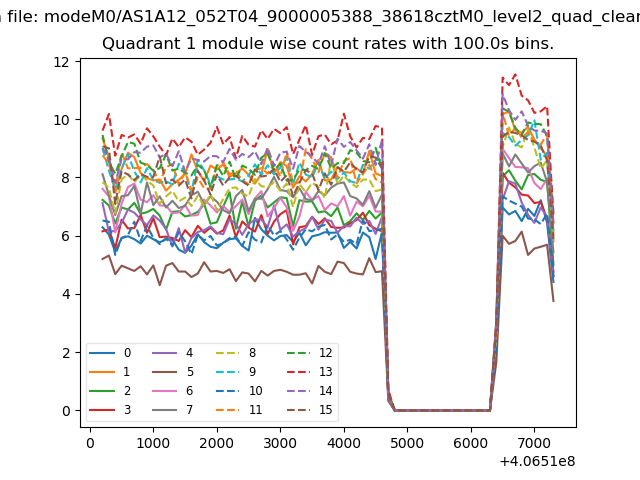
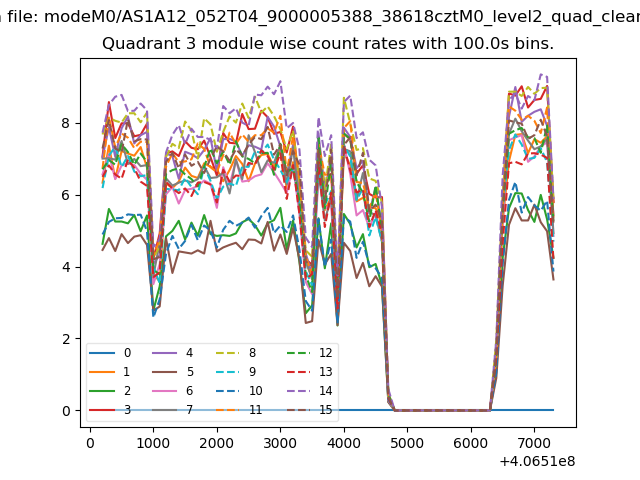
| Module-wise count rates for Quadrant A Data is divided into 100 sec bins |
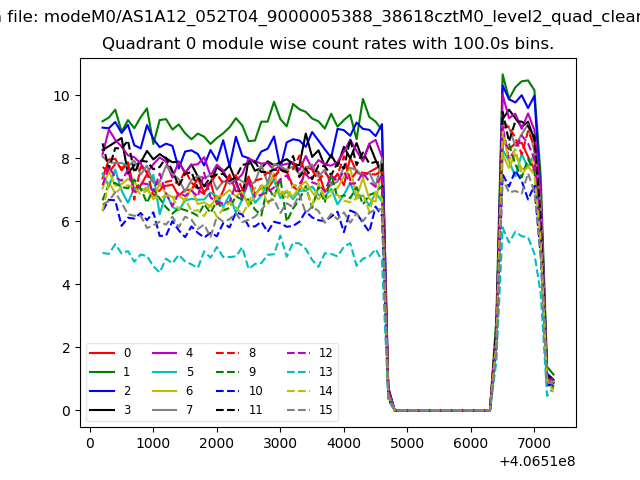 |
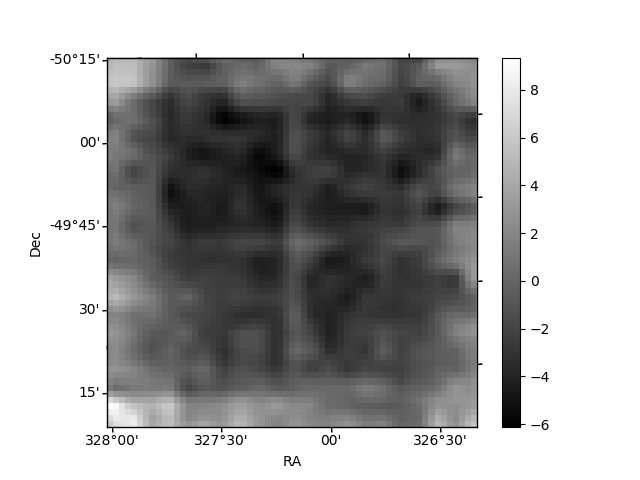 |
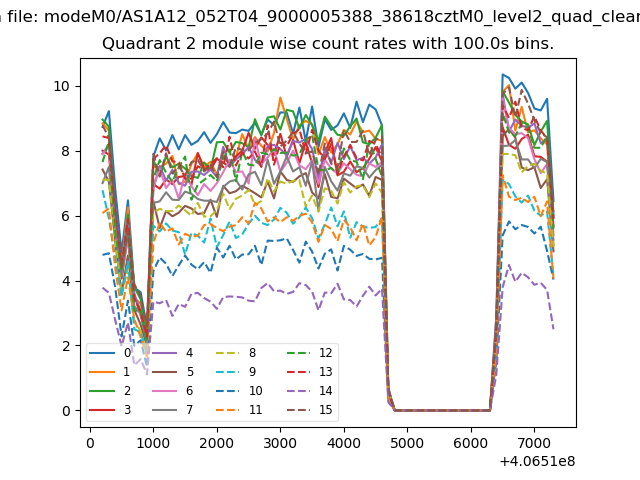
| Module-wise count rates for Quadrant B Data is divided into 100 sec bins |
 |
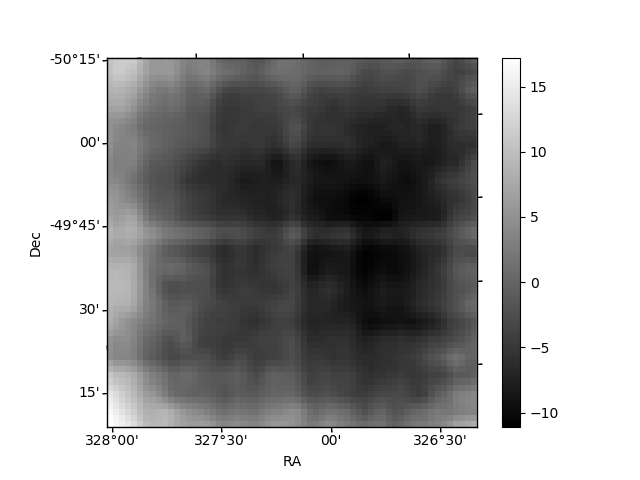 |
| Module-wise count rates for Quadrant C Data is divided into 100 sec bins |
 |
 |
| Module-wise count rates for Quadrant D Data is divided into 100 sec bins |
 |
 |
| Parameter | Plot |
|---|---|
| CZT HV Monitor | 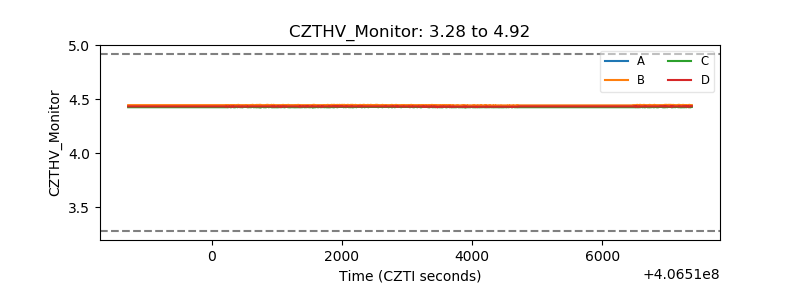 |
| D_VDD | 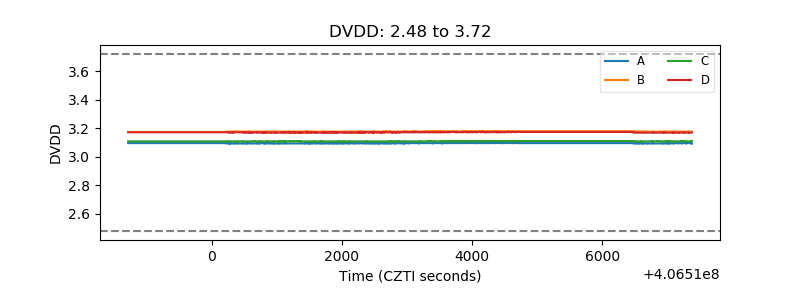 |
| Temperature 1 | 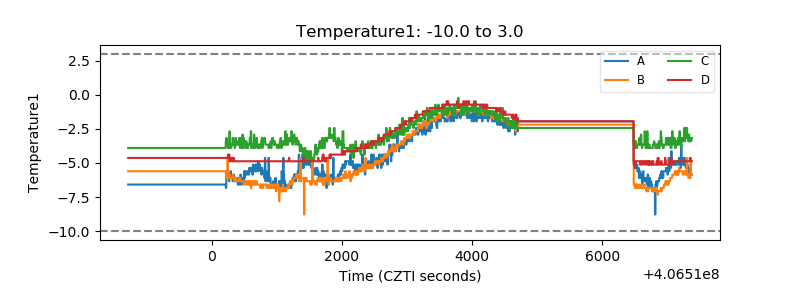 |
| Veto HV Monitor | 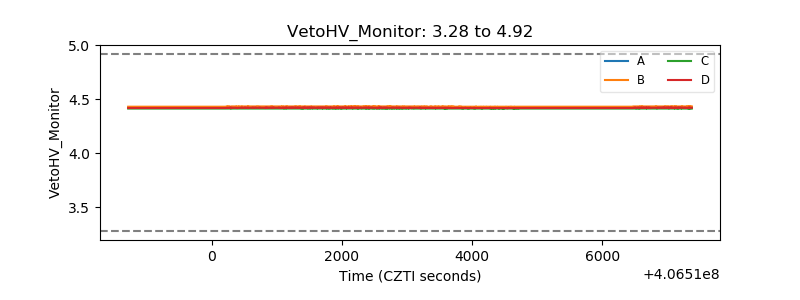 |
| Veto LLD | 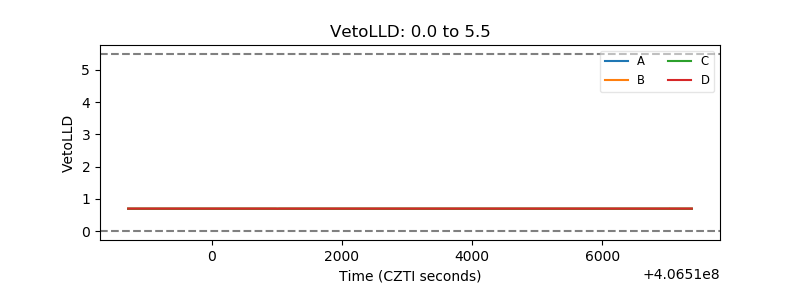 |
| Alpha Counter | 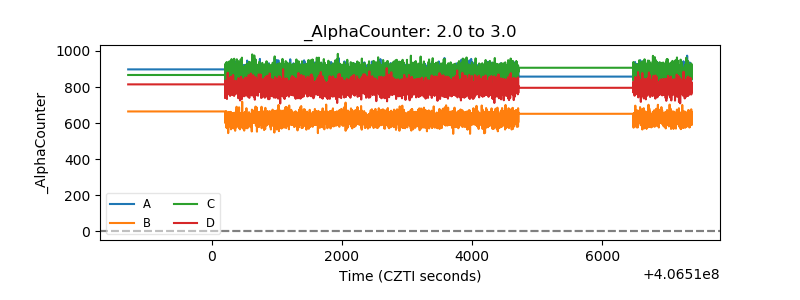 |
| _CPM_Rate | 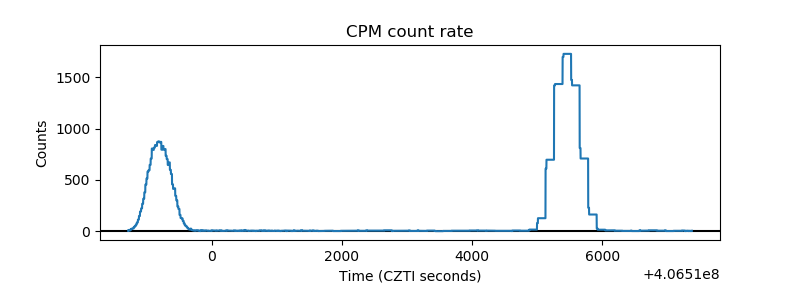 |
| CZT Counter | 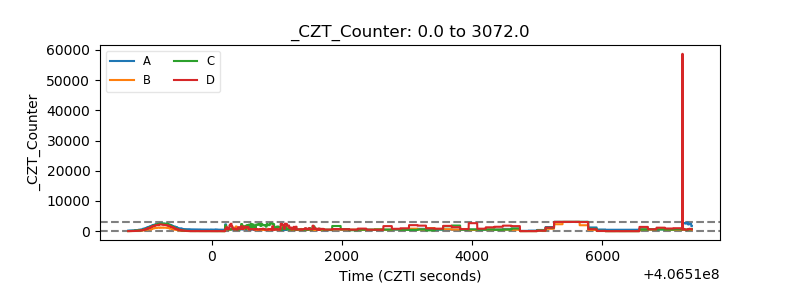 |
| +2.5 Volts monitor | 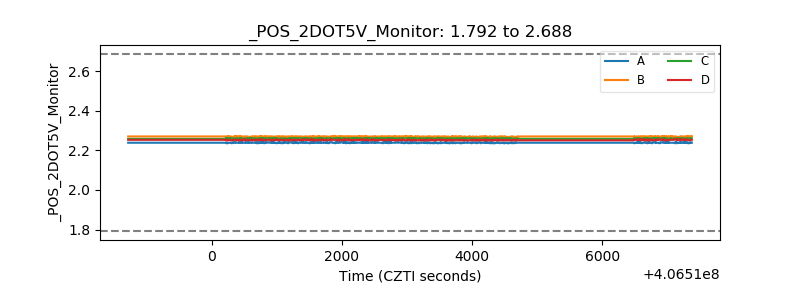 |
| +5 Volts monitor | 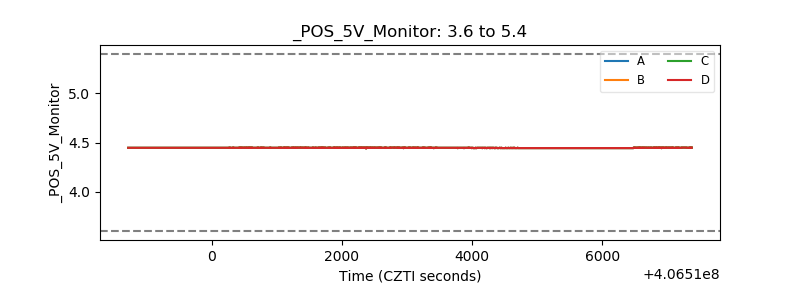 |
| _ROLL_ROT | 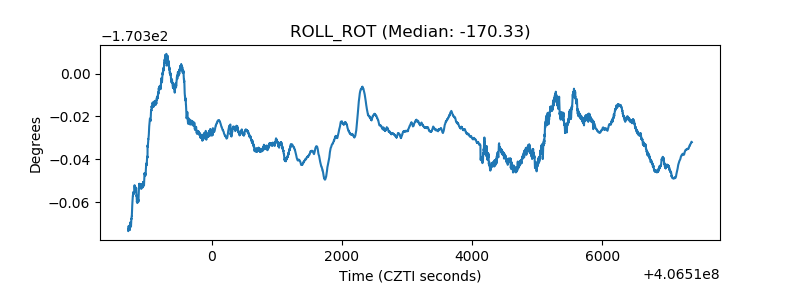 |
| _Roll_DEC | 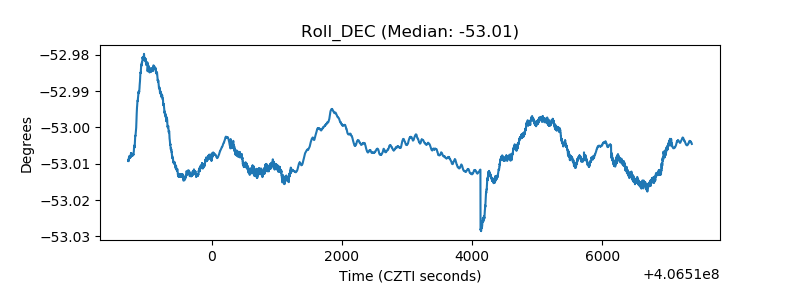 |
| _Roll_RA | 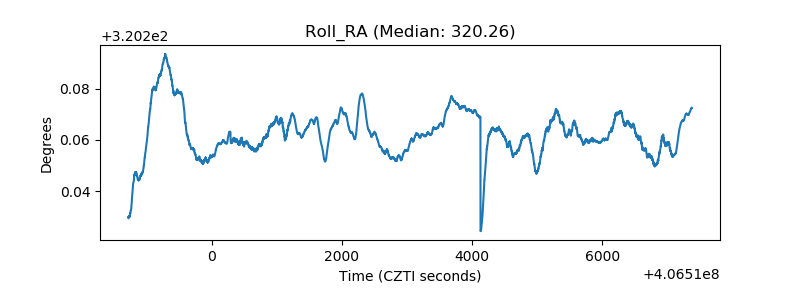 |
| Veto Counter | 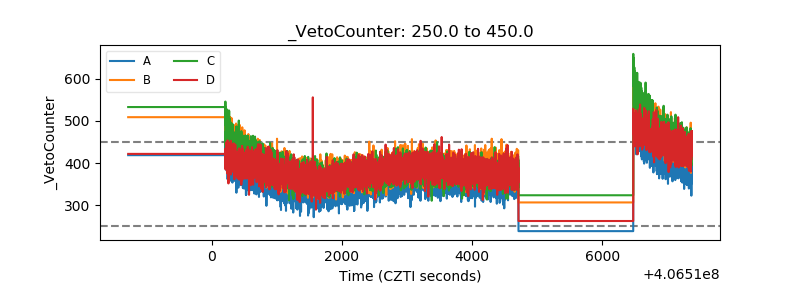 |