| Param | Original file | Final file |
|---|---|---|
| Filename | modeM0/AS1A12_052T04_9000005388_38619cztM0_level2.fits | modeM0/AS1A12_052T04_9000005388_38619cztM0_level2_quad_clean.evt |
| Size (bytes) | 503,832,960 | 90,682,560 |
| Size | 480.5 MB | 86.5 MB |
| Events in quadrant A | 3,607,652 | 618,257 |
| Events in quadrant B | 3,668,147 | 644,987 |
| Events in quadrant C | 3,933,316 | 607,230 |
| Events in quadrant D | 7,037,220 | 510,188 |
| Mode M0 | |||
|---|---|---|---|
| Quadrant | BADHDUFLAG | Total packets | Discarded packets |
| A | 0 | 13796 | 3 |
| B | 0 | 14228 | 2 |
| C | 0 | 14933 | 2 |
| D | 0 | 24550 | 2 |
| Mode SS | |||
|---|---|---|---|
| Quadrant | BADHDUFLAG | Total packets | Discarded packets |
| A | 0 | 108 | 0 |
| B | 0 | 108 | 0 |
| C | 0 | 108 | 0 |
| D | 0 | 108 | 0 |
| Mode M9 | |||
|---|---|---|---|
| Quadrant | BADHDUFLAG | Total packets | Discarded packets |
| A | 0 | 18 | 0 |
| B | 0 | 18 | 0 |
| C | 0 | 18 | 0 |
| D | 0 | 18 | 0 |
| Quadrant | Total seconds | Saturated seconds | Saturation percentage |
|---|---|---|---|
| A | 5208 | 317 | 6.086790% |
| B | 5208 | 313 | 6.009985% |
| C | 5208 | 368 | 7.066052% |
| D | 5209 | 972 | 18.660012% |
Noise dominated data is calculated using 1-second bins in cleaned event files. If a bin has >2000 counts, and if more than 50% of those come from <1% of pixels, then it is considered to be noise-dominated and hence unusable.
| Quadrant | # 1 sec bins | Bins with >0 counts | Bins with >2000 counts | High rate bins dominated by noise | Noise dominated (total time) | Noise dominated (detector-on time) | Marked lightcurve |
|---|---|---|---|---|---|---|---|
| A | 7060 | 5209 | 304 | 304 | 4.31% | 5.84% | 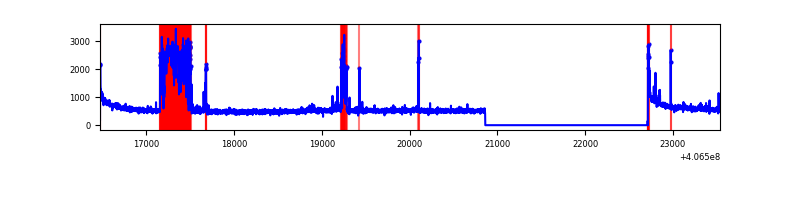 |
| B | 7060 | 5208 | 246 | 246 | 3.48% | 4.72% | 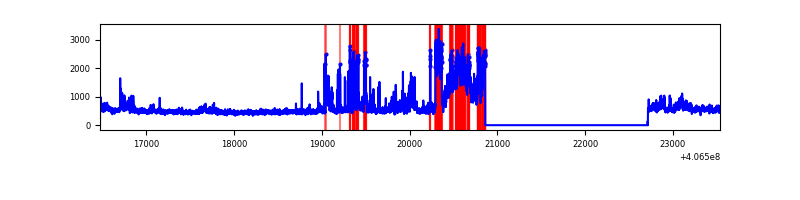 |
| C | 7060 | 5209 | 338 | 338 | 4.79% | 6.49% | 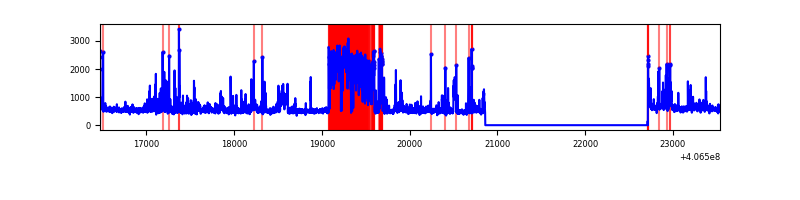 |
| D | 7061 | 5209 | 1049 | 1049 | 14.86% | 20.14% | 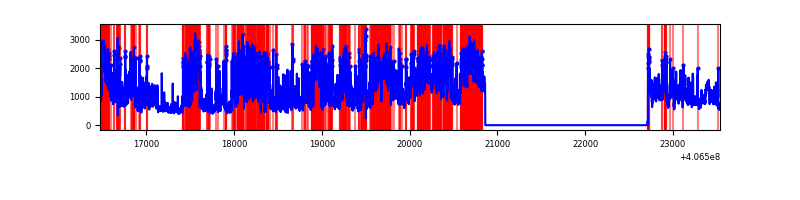 |
Top three noisy pixels from each quadrant. If the there are fewer than three noisy pixels in the level2.evt file, extra rows are filled as -1
| Pixel properties | Quadrant properties | ||||||
|---|---|---|---|---|---|---|---|
| Quadrant | DetID | PixID | Counts | Sigma | Mean | Median | Sigma |
| A | 15 | 223 | 785626 | 6530.47 | 605 | 592 | 120.2 |
| A | 10 | 83 | 396764 | 3295.64 | 605 | 592 | 120.2 |
| A | 12 | 189 | 23694 | 192.18 | 605 | 592 | 120.2 |
| B | 4 | 171 | 760877 | 6625.65 | 607 | 591 | 114.7 |
| B | 4 | 251 | 202297 | 1757.8 | 607 | 591 | 114.7 |
| B | 5 | 184 | 169687 | 1473.62 | 607 | 591 | 114.7 |
| C | 14 | 254 | 1359711 | 9929.15 | 597 | 601 | 136.9 |
| C | 15 | 214 | 210580 | 1534.03 | 597 | 601 | 136.9 |
| C | 0 | 10 | 22077 | 156.9 | 597 | 601 | 136.9 |
| D | 12 | 227 | 1371049 | 9801.57 | 571 | 554 | 139.8 |
| D | 2 | 249 | 1103681 | 7889.4 | 571 | 554 | 139.8 |
| D | 2 | 250 | 507496 | 3625.57 | 571 | 554 | 139.8 |
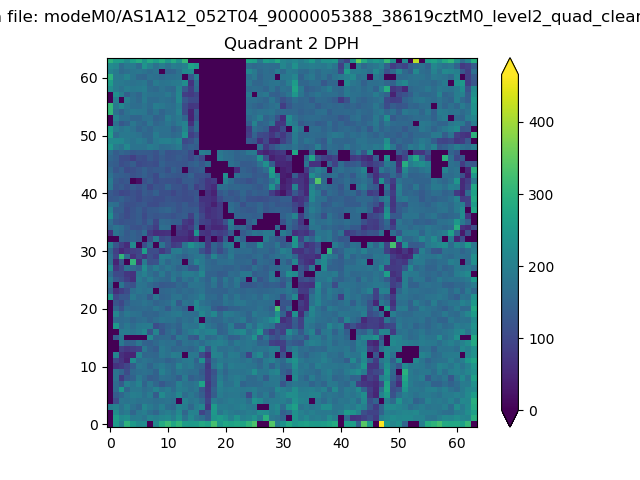
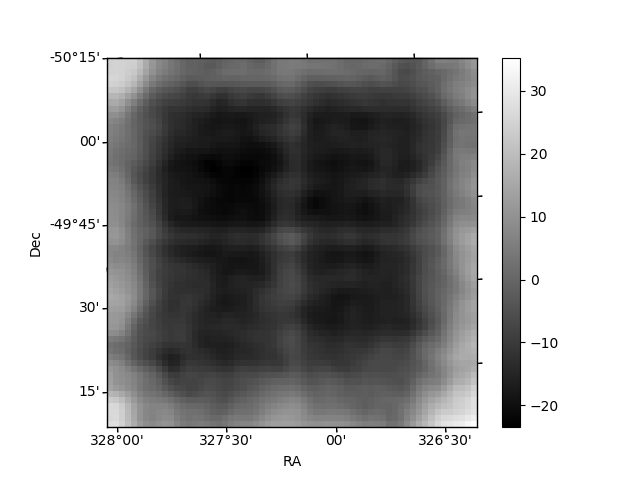
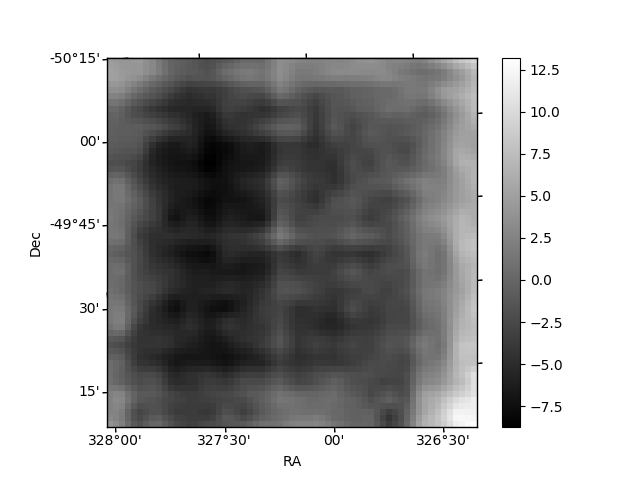
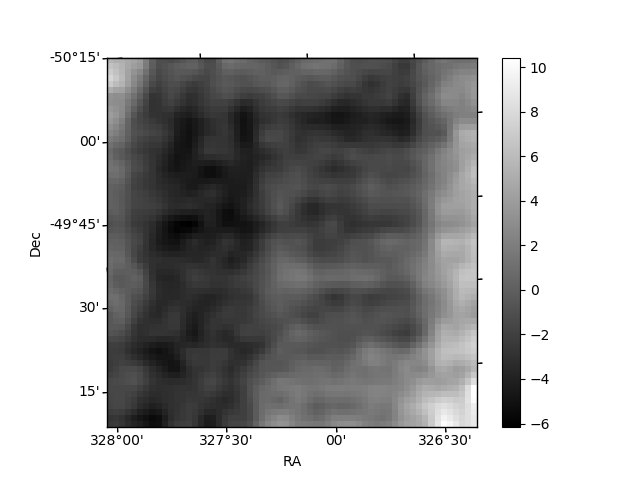
Histogram calculated using DETX and DETY for each event in the final _common_clean file
| Quadrant A | 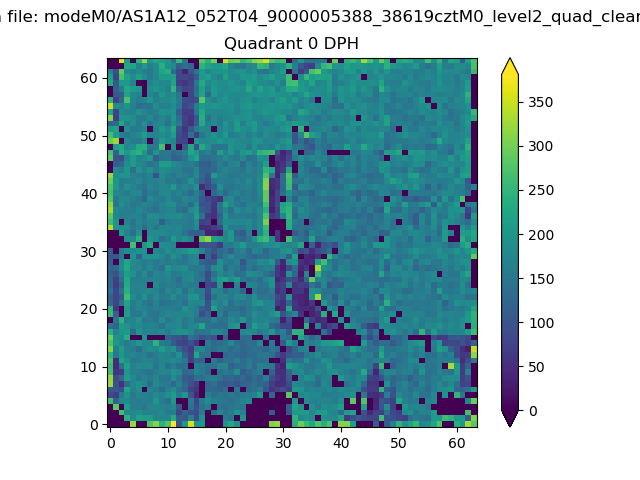 |
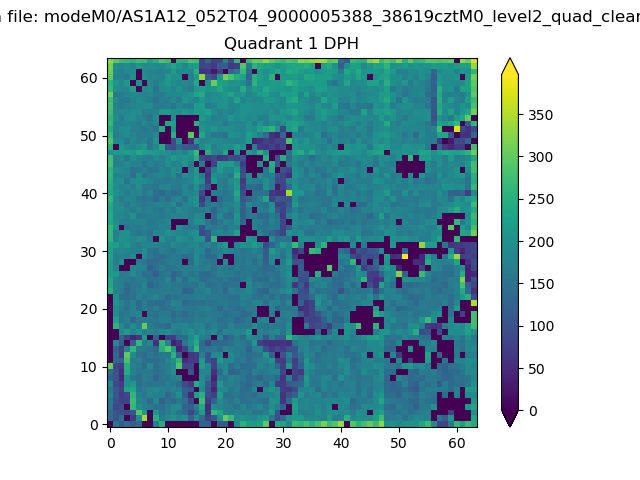 |
Quadrant B |
|---|---|---|---|
| Quadrant D | 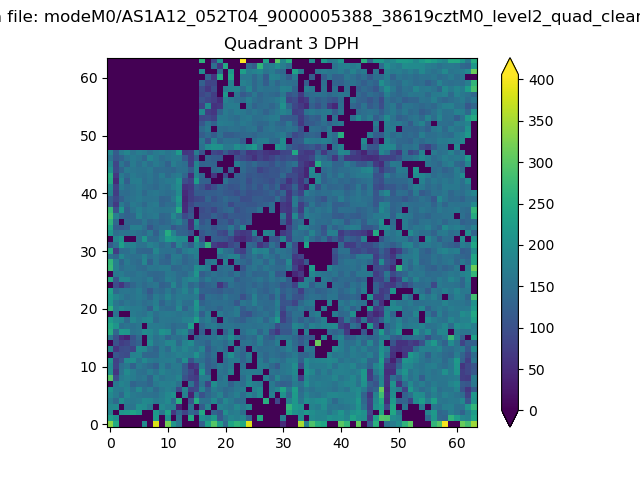 |
 |
Quadrant C |
| Plot type | Count rate plots | Images |
|---|---|---|
| Comparison with Poisson distribution Blue bars denote a histogram of data divided into 1 sec bins. Red curve is a Poisson curve with rate = median count rate of data. |
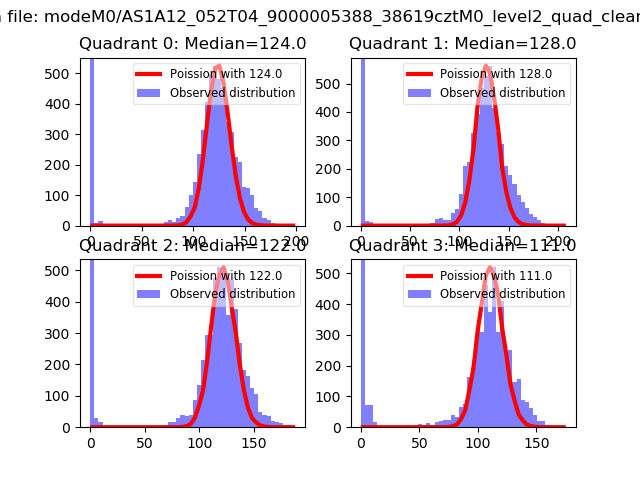 |
 |
| Quadrant-wise count rates Data is divided into 100 sec bins |
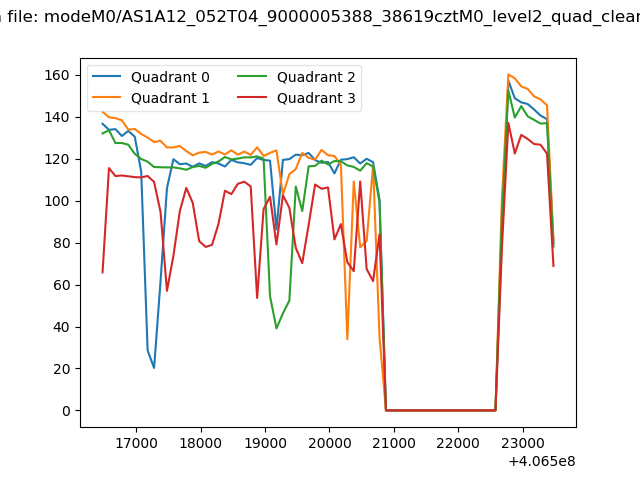 |
|
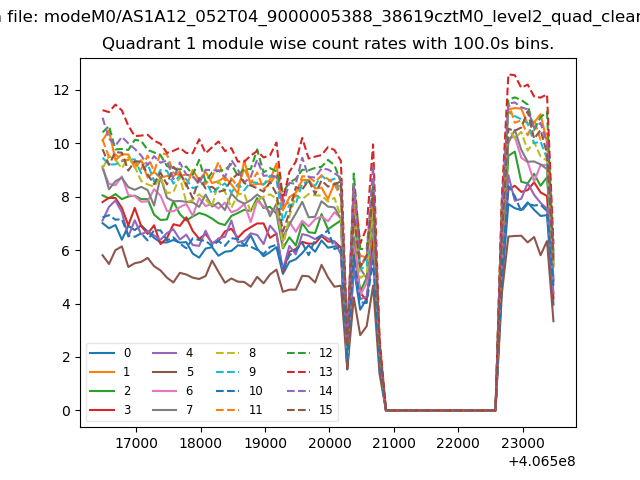
| Module-wise count rates for Quadrant A Data is divided into 100 sec bins |
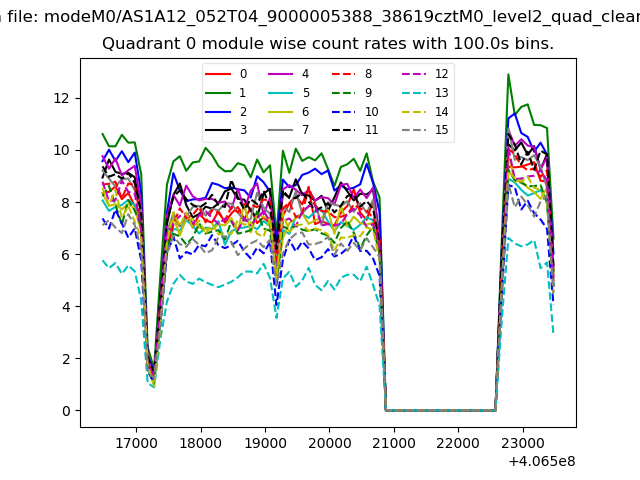 |
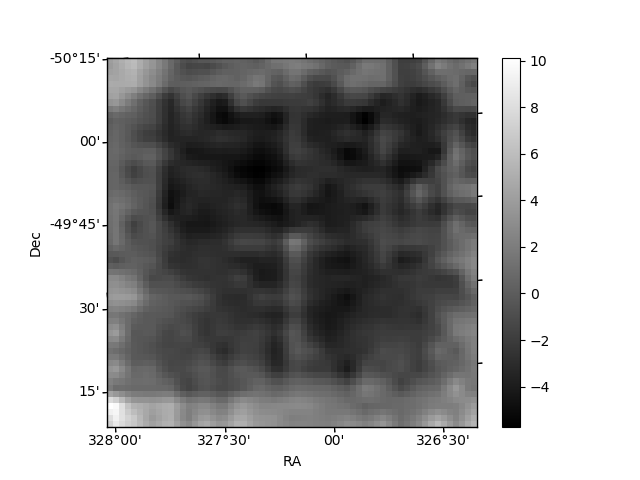 |
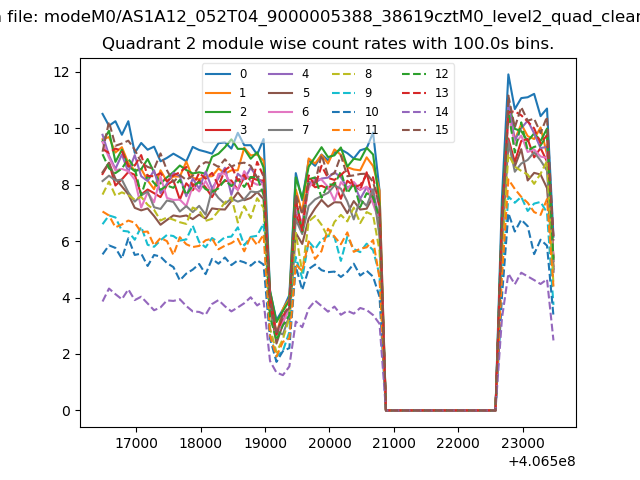
| Module-wise count rates for Quadrant B Data is divided into 100 sec bins |
 |
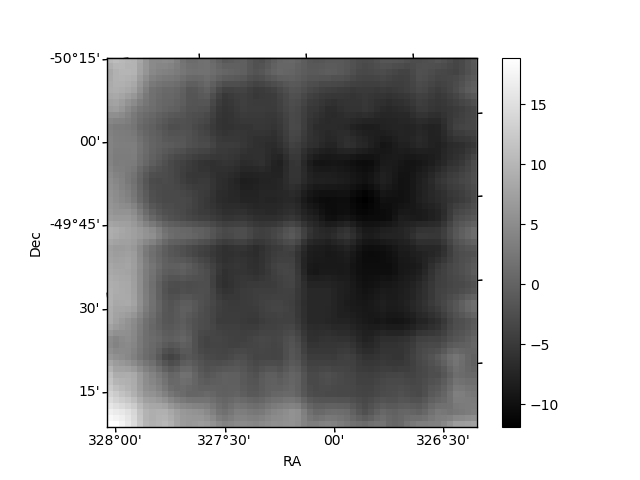 |
| Module-wise count rates for Quadrant C Data is divided into 100 sec bins |
 |
 |
| Module-wise count rates for Quadrant D Data is divided into 100 sec bins |
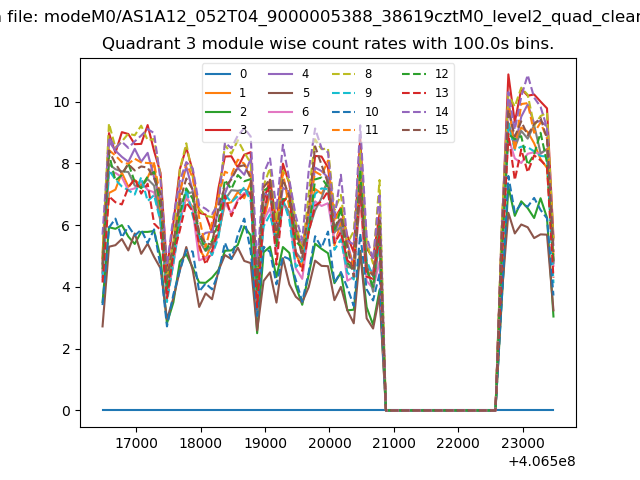 |
 |
| Parameter | Plot |
|---|---|
| CZT HV Monitor | 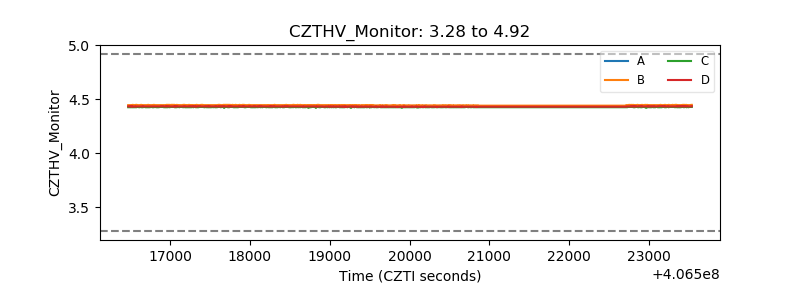 |
| D_VDD | 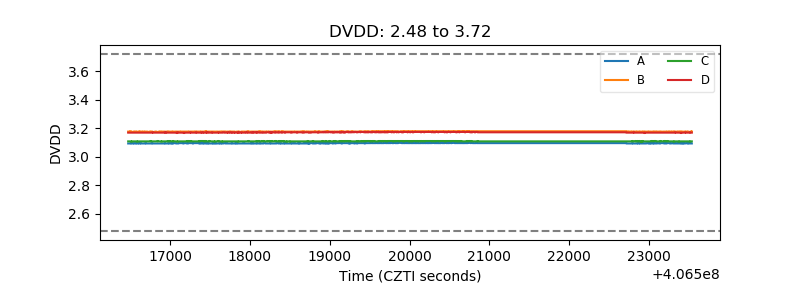 |
| Temperature 1 | 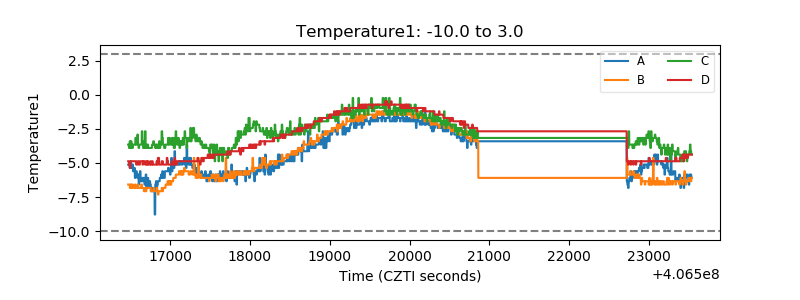 |
| Veto HV Monitor | 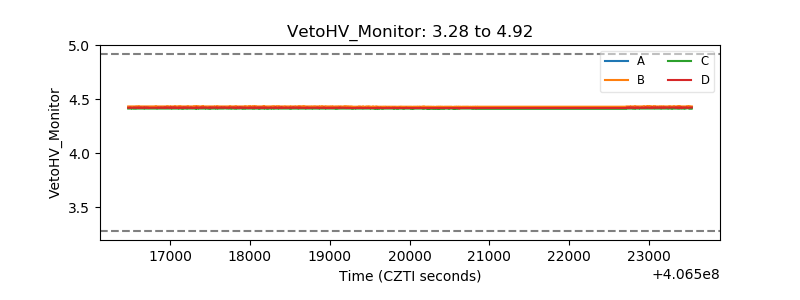 |
| Veto LLD | 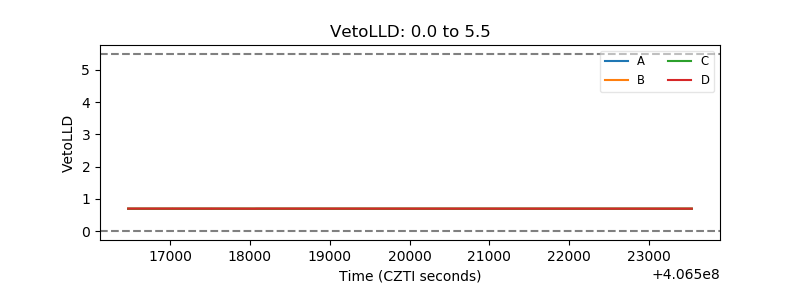 |
| Alpha Counter | 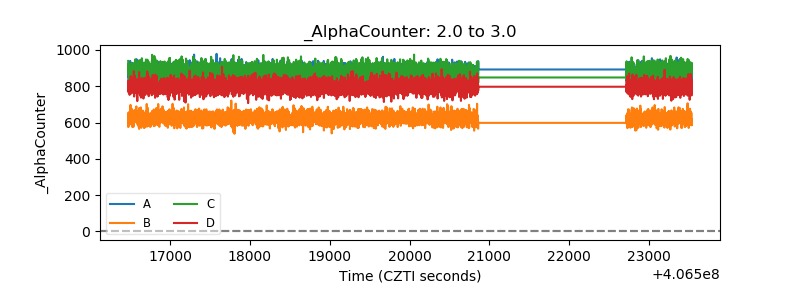 |
| _CPM_Rate | 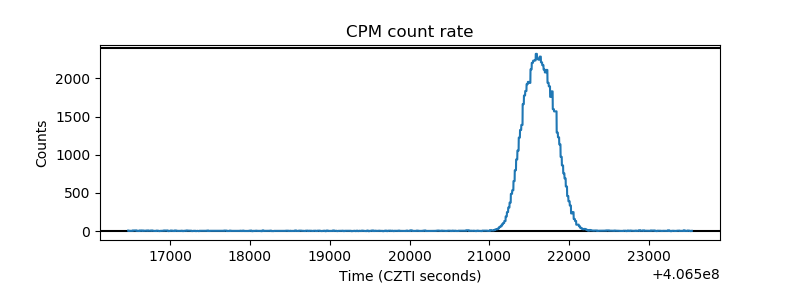 |
| CZT Counter | 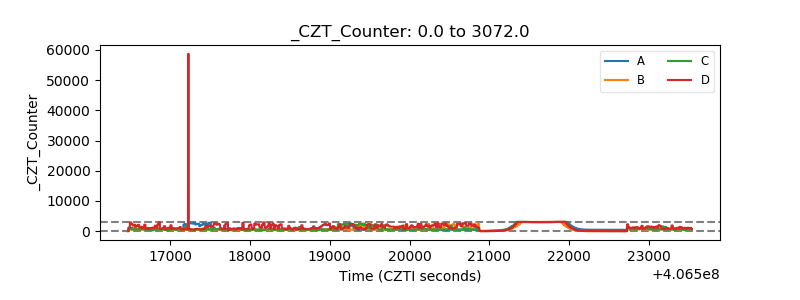 |
| +2.5 Volts monitor | 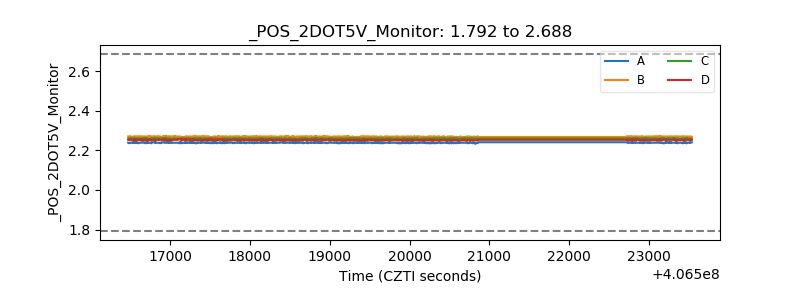 |
| +5 Volts monitor | 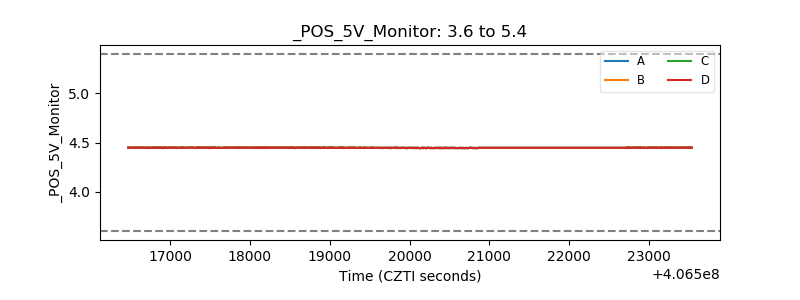 |
| _ROLL_ROT | 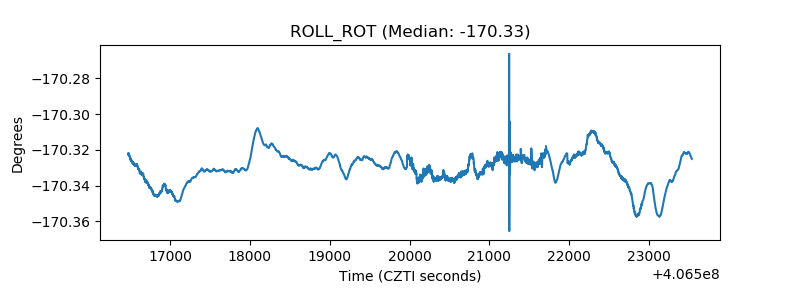 |
| _Roll_DEC | 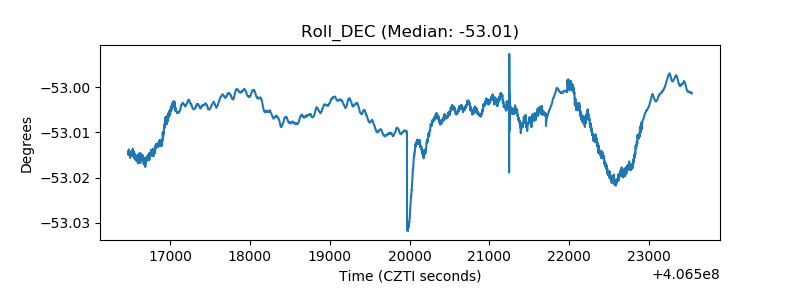 |
| _Roll_RA | 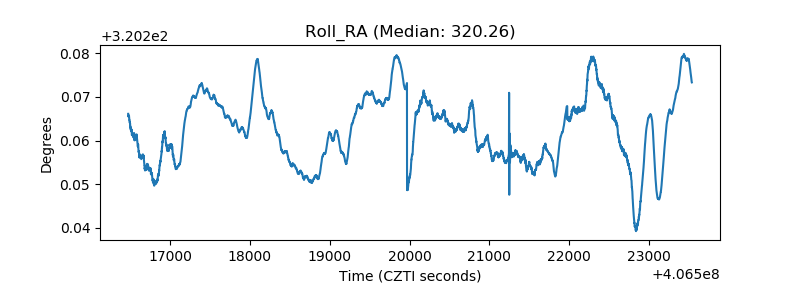 |
| Veto Counter | 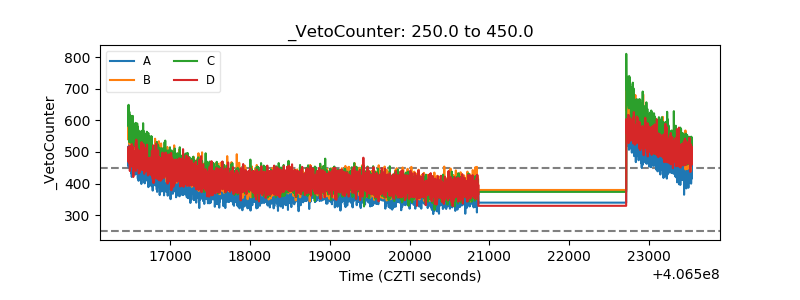 |