| Param | Original file | Final file |
|---|---|---|
| Filename | modeM0/AS1A12_052T04_9000005388_38620cztM0_level2.fits | modeM0/AS1A12_052T04_9000005388_38620cztM0_level2_quad_clean.evt |
| Size (bytes) | 495,037,440 | 96,569,280 |
| Size | 472.1 MB | 92.1 MB |
| Events in quadrant A | 3,164,341 | 684,677 |
| Events in quadrant B | 3,411,102 | 711,853 |
| Events in quadrant C | 3,486,890 | 677,787 |
| Events in quadrant D | 7,863,910 | 489,522 |
| Mode M0 | |||
|---|---|---|---|
| Quadrant | BADHDUFLAG | Total packets | Discarded packets |
| A | 0 | 12392 | 3 |
| B | 0 | 13412 | 2 |
| C | 0 | 13789 | 2 |
| D | 0 | 26973 | 2 |
| Mode SS | |||
|---|---|---|---|
| Quadrant | BADHDUFLAG | Total packets | Discarded packets |
| A | 0 | 106 | 0 |
| B | 0 | 106 | 0 |
| C | 0 | 106 | 0 |
| D | 0 | 106 | 0 |
| Mode M9 | |||
|---|---|---|---|
| Quadrant | BADHDUFLAG | Total packets | Discarded packets |
| A | 0 | 27 | 0 |
| B | 0 | 27 | 0 |
| C | 0 | 27 | 0 |
| D | 0 | 28 | 0 |
| Quadrant | Total seconds | Saturated seconds | Saturation percentage |
|---|---|---|---|
| A | 5140 | 92 | 1.789883% |
| B | 5140 | 88 | 1.712062% |
| C | 5140 | 71 | 1.381323% |
| D | 5140 | 1375 | 26.750973% |
Noise dominated data is calculated using 1-second bins in cleaned event files. If a bin has >2000 counts, and if more than 50% of those come from <1% of pixels, then it is considered to be noise-dominated and hence unusable.
| Quadrant | # 1 sec bins | Bins with >0 counts | Bins with >2000 counts | High rate bins dominated by noise | Noise dominated (total time) | Noise dominated (detector-on time) | Marked lightcurve |
|---|---|---|---|---|---|---|---|
| A | 7113 | 5141 | 71 | 71 | 1.00% | 1.38% | 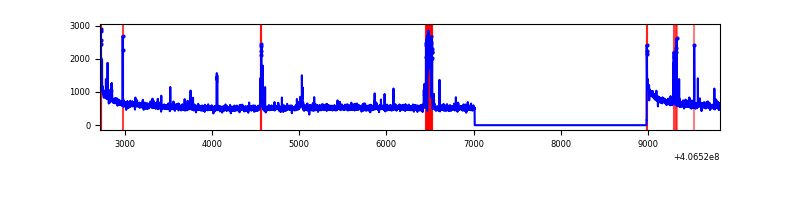 |
| B | 7113 | 5140 | 52 | 52 | 0.73% | 1.01% | 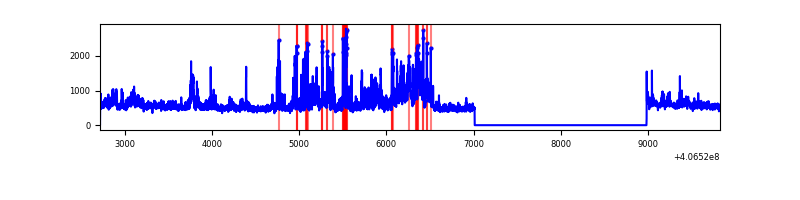 |
| C | 7113 | 5141 | 69 | 69 | 0.97% | 1.34% | 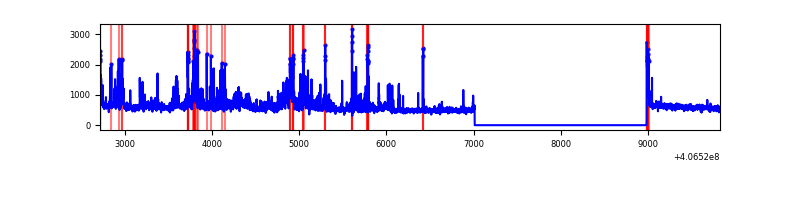 |
| D | 7113 | 5140 | 1476 | 1476 | 20.75% | 28.72% | 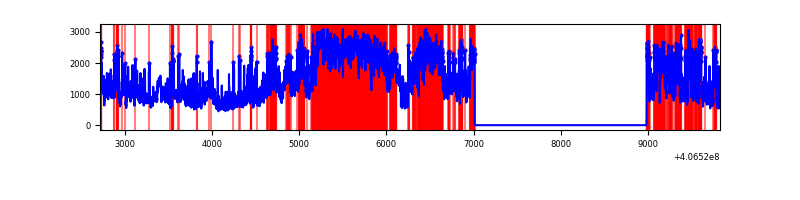 |
Top three noisy pixels from each quadrant. If the there are fewer than three noisy pixels in the level2.evt file, extra rows are filled as -1
| Pixel properties | Quadrant properties | ||||||
|---|---|---|---|---|---|---|---|
| Quadrant | DetID | PixID | Counts | Sigma | Mean | Median | Sigma |
| A | 10 | 83 | 406652 | 3181.24 | 640 | 629 | 127.6 |
| A | 7 | 3 | 137530 | 1072.64 | 640 | 629 | 127.6 |
| A | 13 | 248 | 79755 | 619.96 | 640 | 629 | 127.6 |
| B | 4 | 171 | 757729 | 6309.63 | 637 | 620 | 120.0 |
| B | 5 | 172 | 131904 | 1094.1 | 637 | 620 | 120.0 |
| B | 12 | 111 | 13891 | 110.6 | 637 | 620 | 120.0 |
| C | 14 | 254 | 673075 | 4655.27 | 629 | 634 | 144.4 |
| C | 15 | 214 | 211392 | 1459.06 | 629 | 634 | 144.4 |
| C | 15 | 159 | 104221 | 717.13 | 629 | 634 | 144.4 |
| D | 12 | 227 | 2762498 | 20122.54 | 572 | 557 | 137.3 |
| D | 1 | 47 | 1080742 | 7869.85 | 572 | 557 | 137.3 |
| D | 2 | 249 | 487204 | 3545.54 | 572 | 557 | 137.3 |
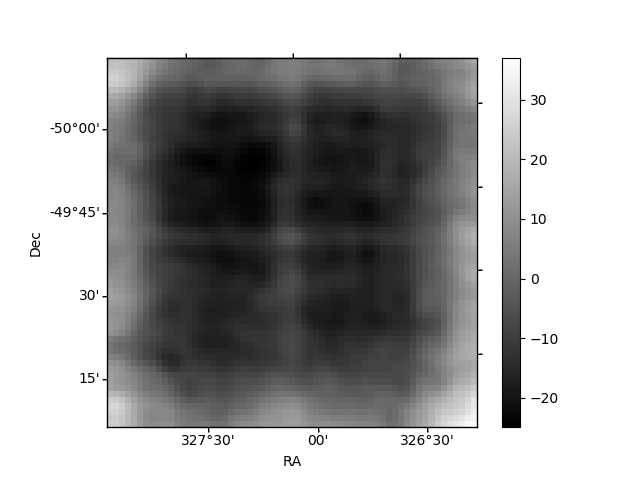
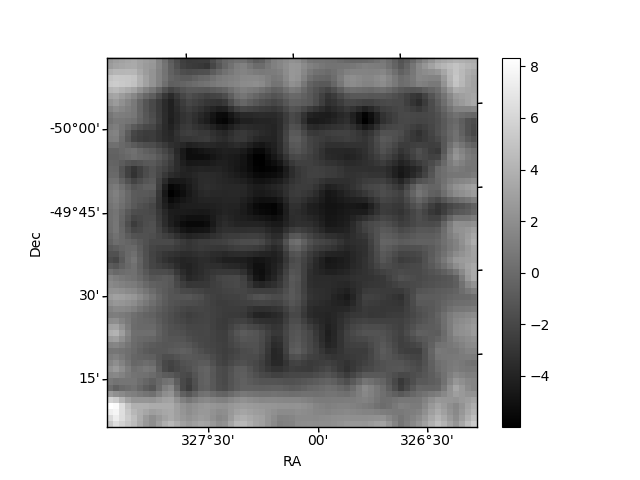
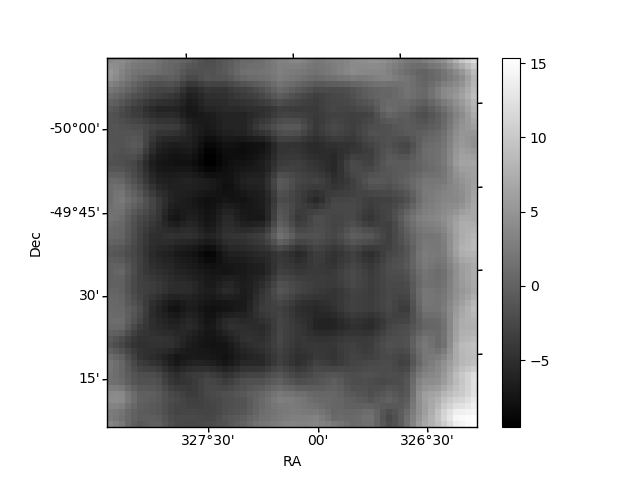
Histogram calculated using DETX and DETY for each event in the final _common_clean file
| Quadrant A | 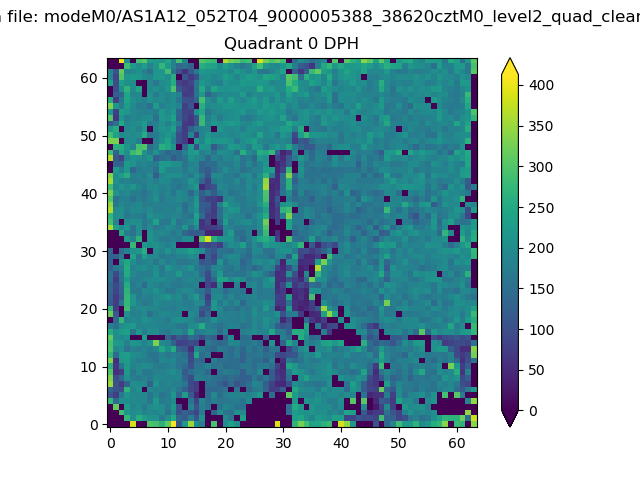 |
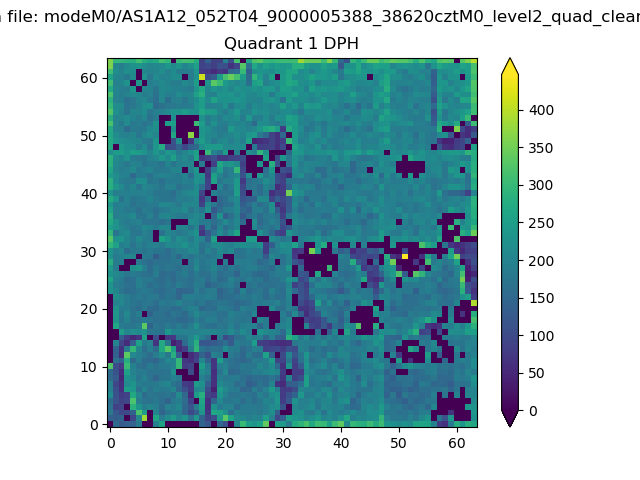 |
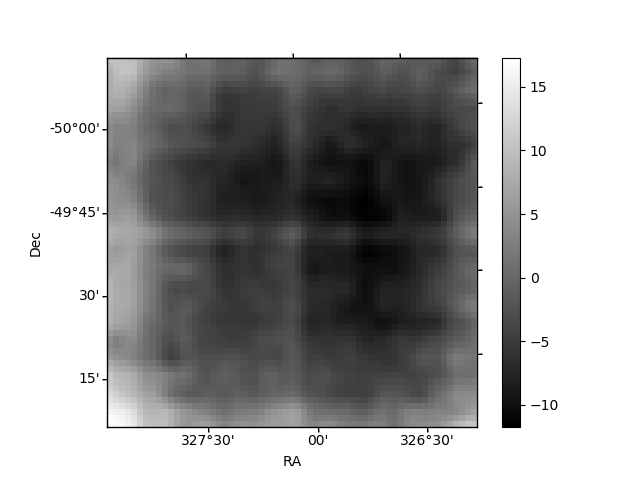
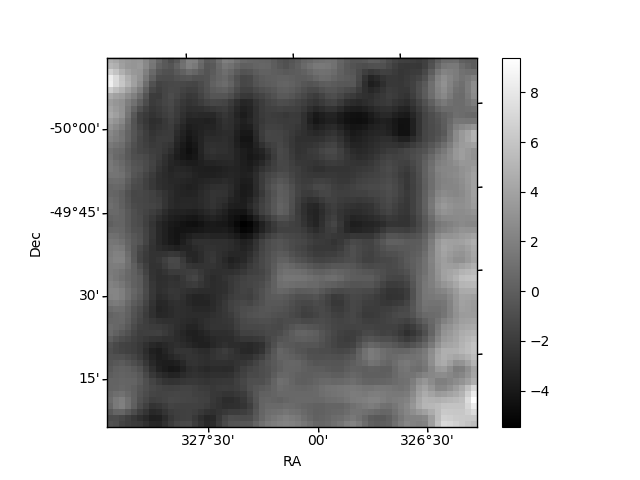
Quadrant B |
|---|---|---|---|
| Quadrant D | 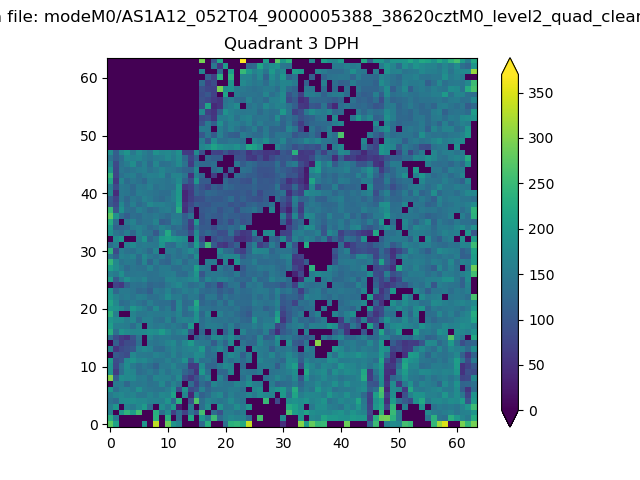 |
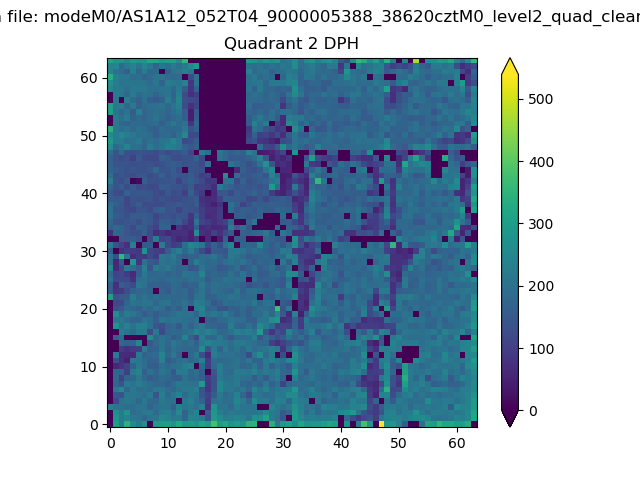 |
Quadrant C |
| Plot type | Count rate plots | Images |
|---|---|---|
| Comparison with Poisson distribution Blue bars denote a histogram of data divided into 1 sec bins. Red curve is a Poisson curve with rate = median count rate of data. |
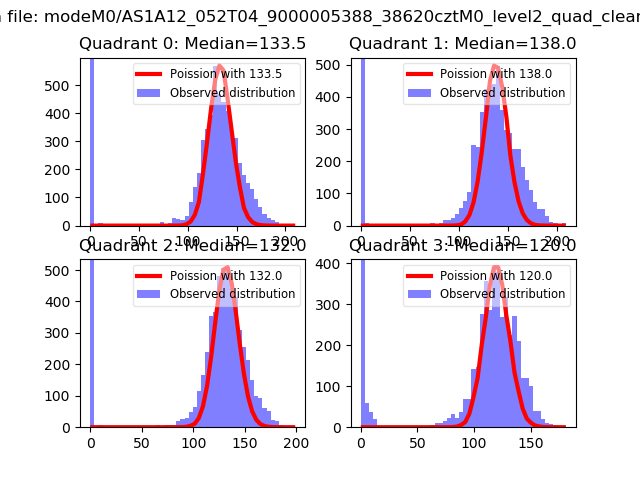 |
 |
| Quadrant-wise count rates Data is divided into 100 sec bins |
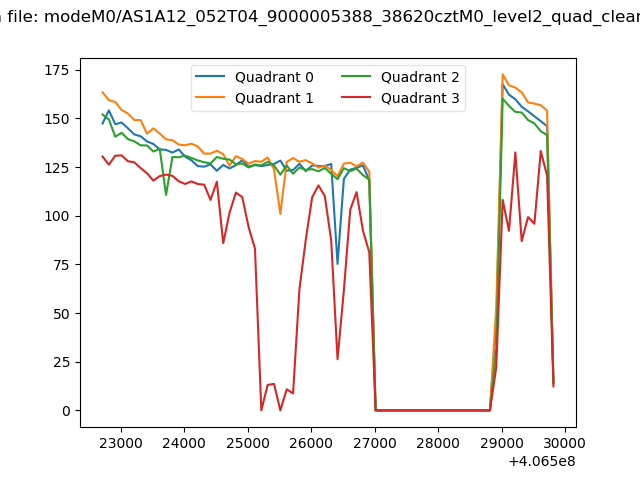 |
|
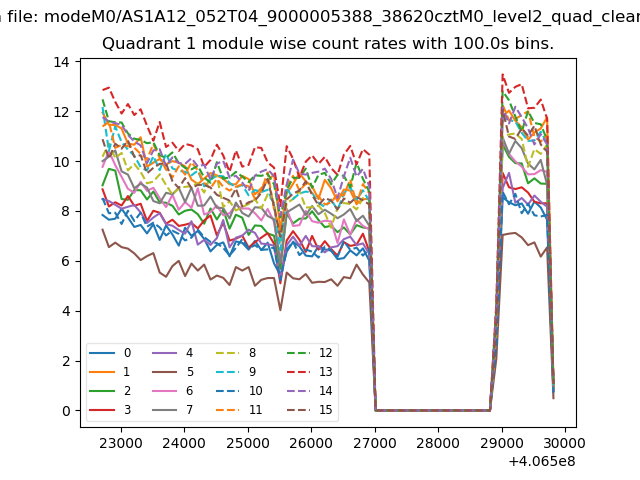
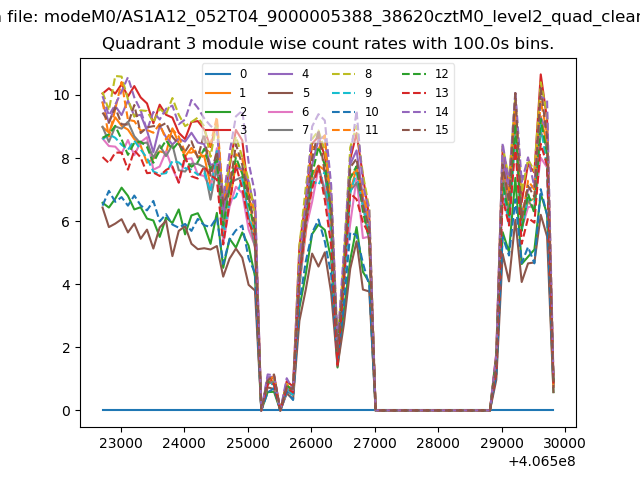
| Module-wise count rates for Quadrant A Data is divided into 100 sec bins |
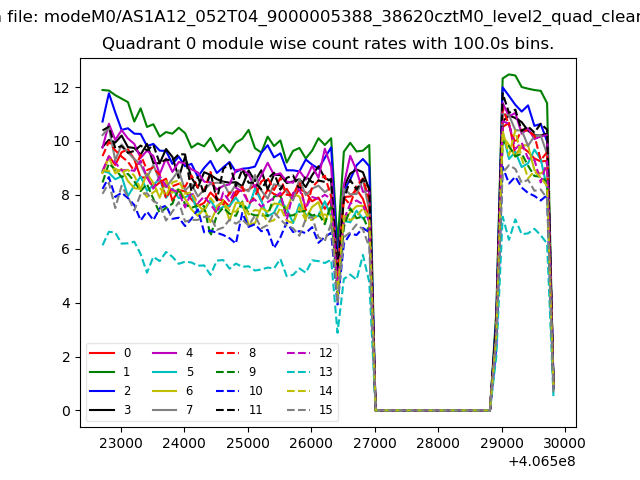 |
 |
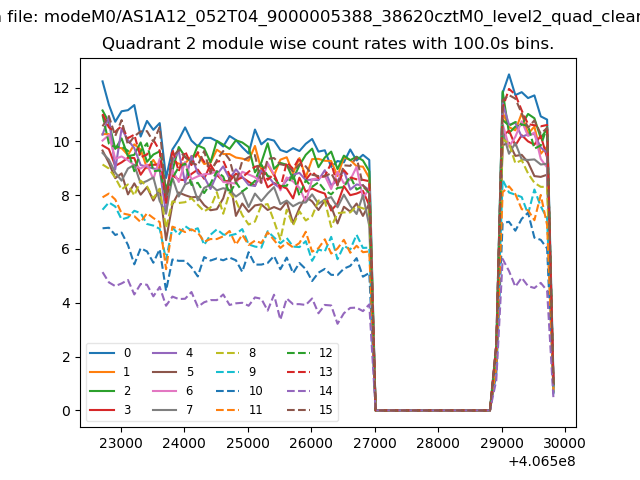
| Module-wise count rates for Quadrant B Data is divided into 100 sec bins |
 |
 |
| Module-wise count rates for Quadrant C Data is divided into 100 sec bins |
 |
 |
| Module-wise count rates for Quadrant D Data is divided into 100 sec bins |
 |
 |
| Parameter | Plot |
|---|---|
| CZT HV Monitor | 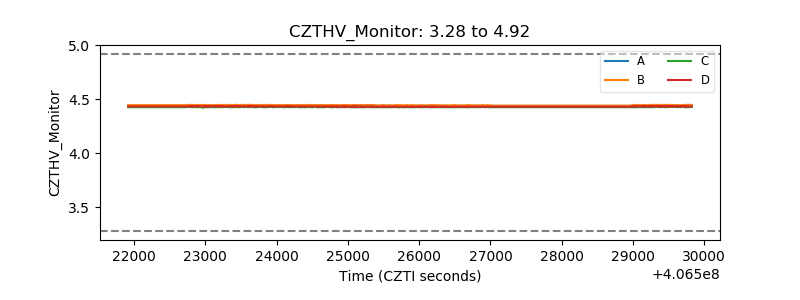 |
| D_VDD | 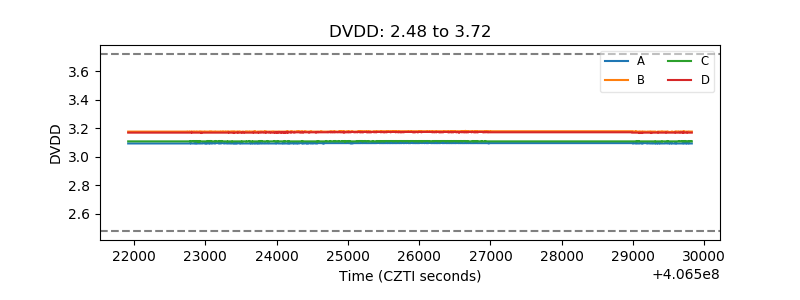 |
| Temperature 1 | 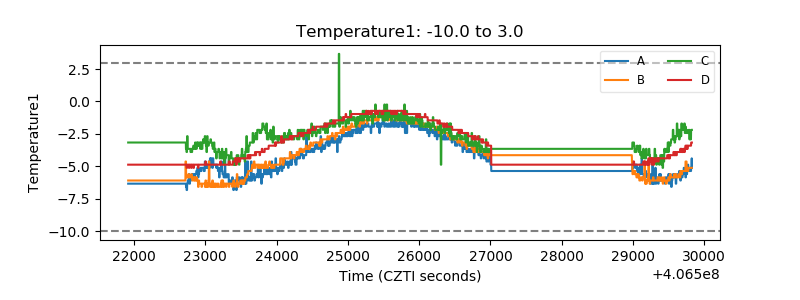 |
| Veto HV Monitor | 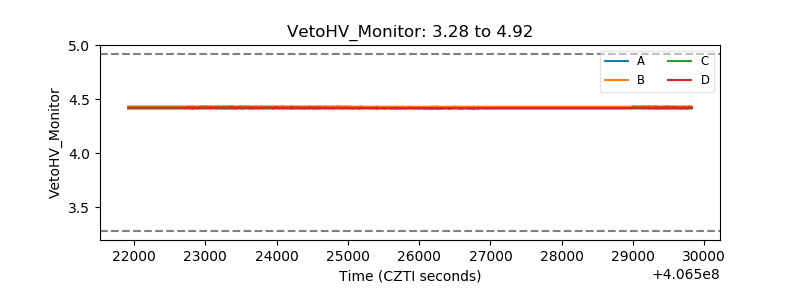 |
| Veto LLD | 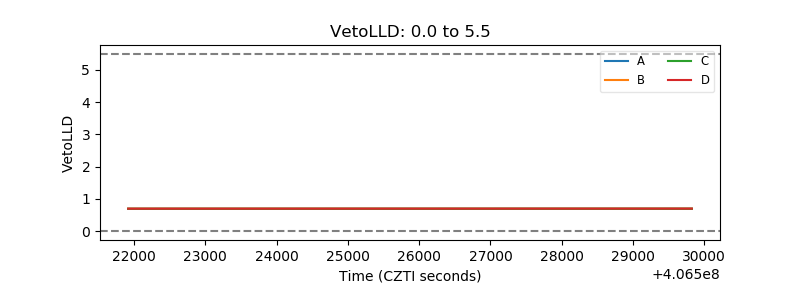 |
| Alpha Counter | 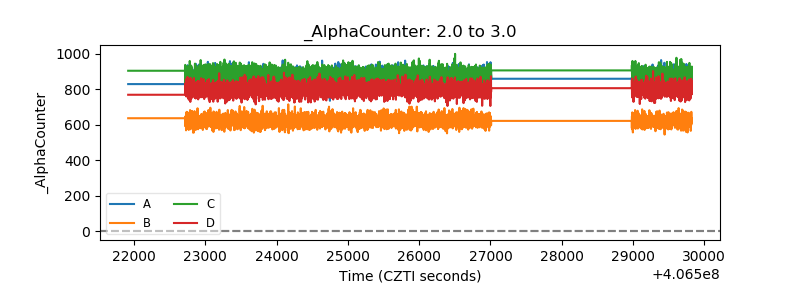 |
| _CPM_Rate | 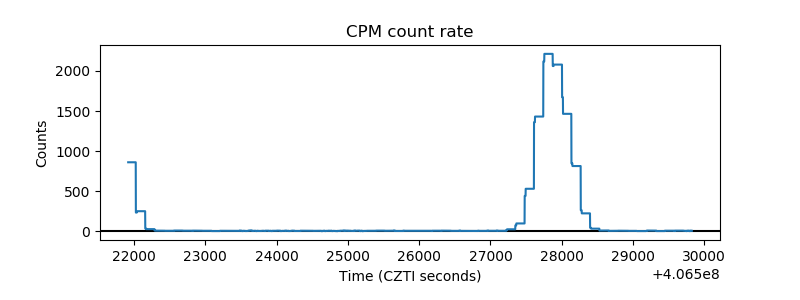 |
| CZT Counter | 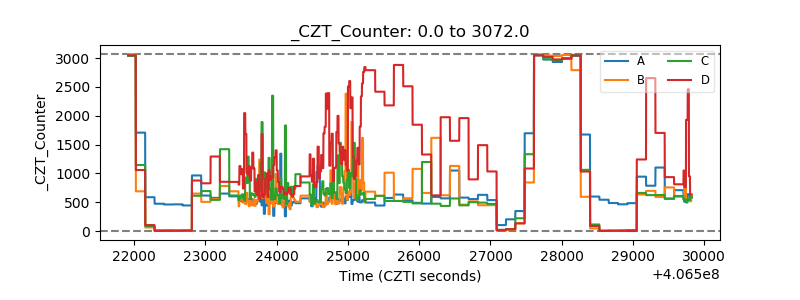 |
| +2.5 Volts monitor | 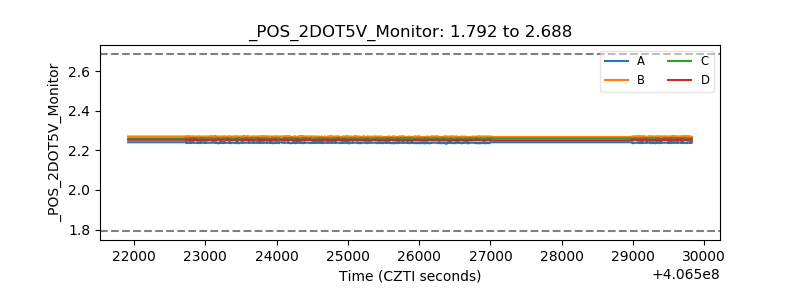 |
| +5 Volts monitor |  |
| _ROLL_ROT | 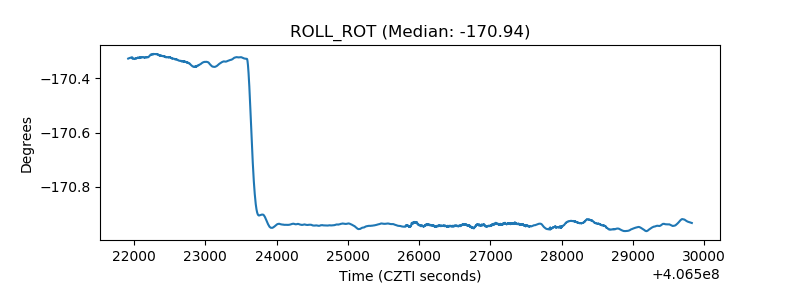 |
| _Roll_DEC | 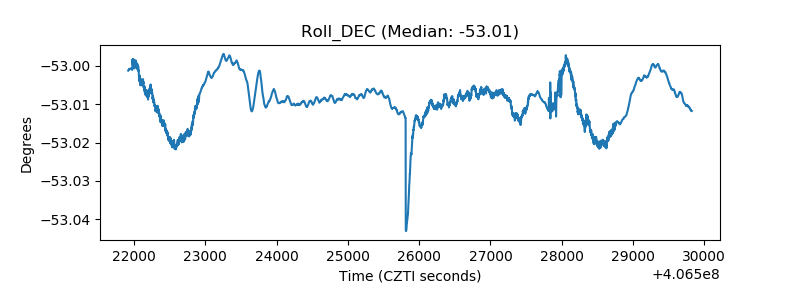 |
| _Roll_RA | 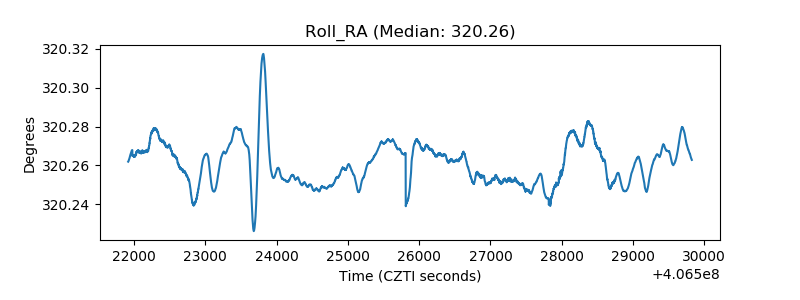 |
| Veto Counter | 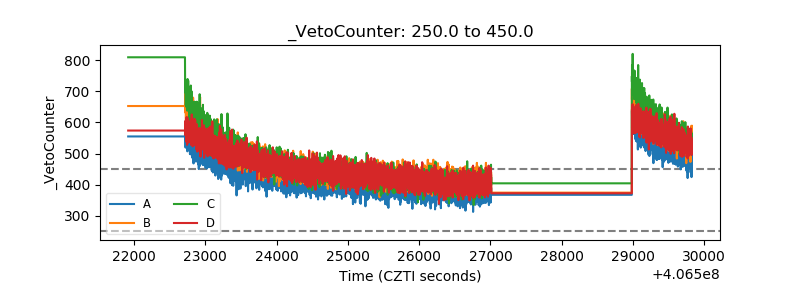 |