| Param | Original file | Final file |
|---|---|---|
| Filename | modeM0/AS1A12_052T04_9000005388_38621cztM0_level2.fits | modeM0/AS1A12_052T04_9000005388_38621cztM0_level2_quad_clean.evt |
| Size (bytes) | 492,289,920 | 93,847,680 |
| Size | 469.5 MB | 89.5 MB |
| Events in quadrant A | 3,014,722 | 694,463 |
| Events in quadrant B | 3,850,762 | 693,781 |
| Events in quadrant C | 2,937,931 | 683,330 |
| Events in quadrant D | 8,031,359 | 419,941 |
| Mode M0 | |||
|---|---|---|---|
| Quadrant | BADHDUFLAG | Total packets | Discarded packets |
| A | 0 | 11868 | 3 |
| B | 0 | 14791 | 2 |
| C | 0 | 11742 | 2 |
| D | 0 | 27357 | 2 |
| Mode SS | |||
|---|---|---|---|
| Quadrant | BADHDUFLAG | Total packets | Discarded packets |
| A | 0 | 102 | 0 |
| B | 0 | 102 | 0 |
| C | 0 | 102 | 0 |
| D | 0 | 102 | 0 |
| Mode M9 | |||
|---|---|---|---|
| Quadrant | BADHDUFLAG | Total packets | Discarded packets |
| A | 0 | 32 | 0 |
| B | 0 | 32 | 0 |
| C | 0 | 32 | 0 |
| D | 0 | 33 | 0 |
| Quadrant | Total seconds | Saturated seconds | Saturation percentage |
|---|---|---|---|
| A | 4998 | 35 | 0.700280% |
| B | 4998 | 219 | 4.381753% |
| C | 4998 | 52 | 1.040416% |
| D | 4998 | 1955 | 39.115646% |
Noise dominated data is calculated using 1-second bins in cleaned event files. If a bin has >2000 counts, and if more than 50% of those come from <1% of pixels, then it is considered to be noise-dominated and hence unusable.
| Quadrant | # 1 sec bins | Bins with >0 counts | Bins with >2000 counts | High rate bins dominated by noise | Noise dominated (total time) | Noise dominated (detector-on time) | Marked lightcurve |
|---|---|---|---|---|---|---|---|
| A | 7090 | 4999 | 15 | 15 | 0.21% | 0.30% | 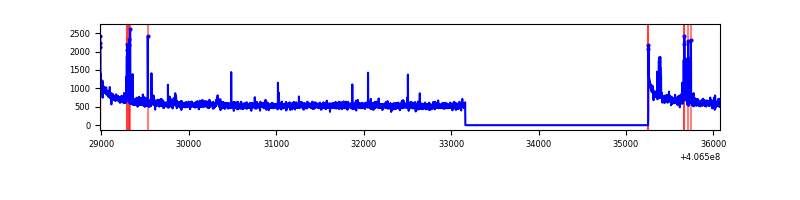 |
| B | 7090 | 4999 | 175 | 175 | 2.47% | 3.50% | 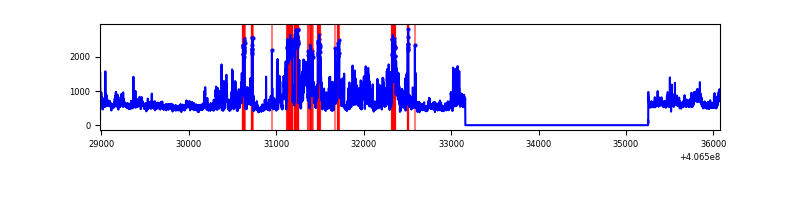 |
| C | 7090 | 4999 | 48 | 48 | 0.68% | 0.96% | 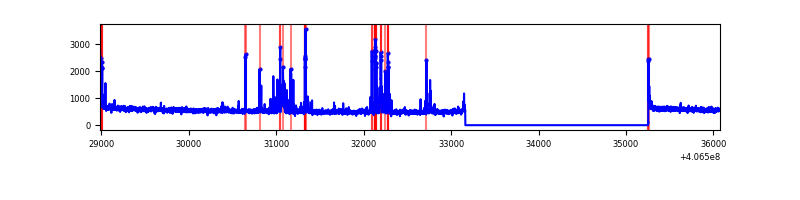 |
| D | 7090 | 4999 | 2004 | 2004 | 28.27% | 40.09% | 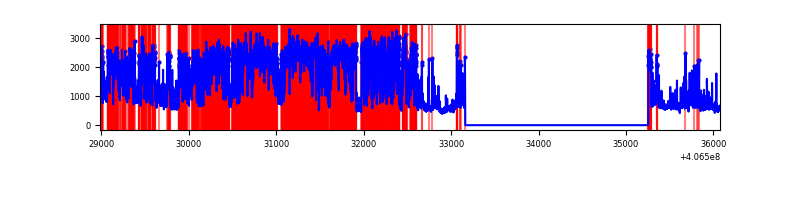 |
Top three noisy pixels from each quadrant. If the there are fewer than three noisy pixels in the level2.evt file, extra rows are filled as -1
| Pixel properties | Quadrant properties | ||||||
|---|---|---|---|---|---|---|---|
| Quadrant | DetID | PixID | Counts | Sigma | Mean | Median | Sigma |
| A | 10 | 83 | 407918 | 3217.34 | 638 | 628 | 126.6 |
| A | 13 | 248 | 103854 | 815.42 | 638 | 628 | 126.6 |
| A | 12 | 189 | 17138 | 130.42 | 638 | 628 | 126.6 |
| B | 4 | 171 | 1304799 | 11260.49 | 625 | 610 | 115.8 |
| B | 5 | 172 | 37422 | 317.84 | 625 | 610 | 115.8 |
| B | 15 | 85 | 20463 | 171.41 | 625 | 610 | 115.8 |
| C | 14 | 254 | 248354 | 1746.08 | 621 | 626 | 141.9 |
| C | 15 | 214 | 209021 | 1468.84 | 621 | 626 | 141.9 |
| C | 0 | 10 | 39319 | 272.72 | 621 | 626 | 141.9 |
| D | 12 | 227 | 2760027 | 20845.56 | 546 | 532 | 132.4 |
| D | 2 | 249 | 1674842 | 12647.94 | 546 | 532 | 132.4 |
| D | 1 | 47 | 658720 | 4972.03 | 546 | 532 | 132.4 |
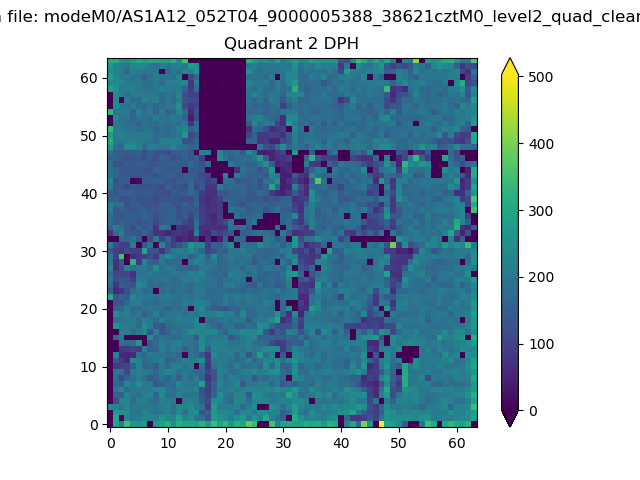
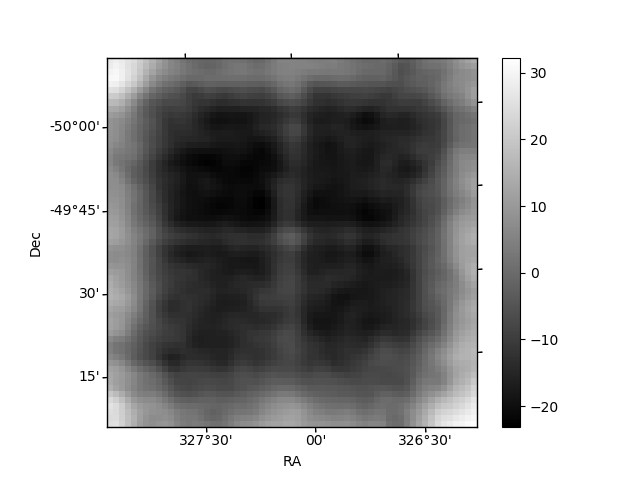
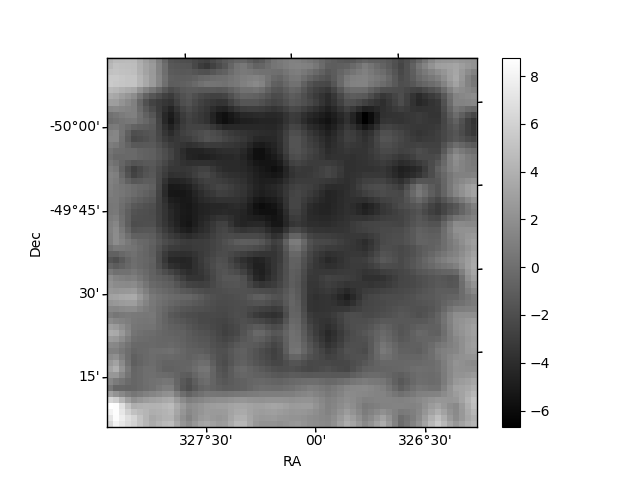
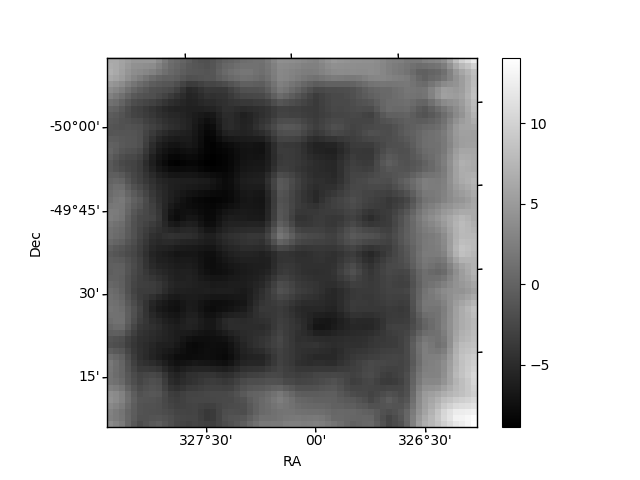
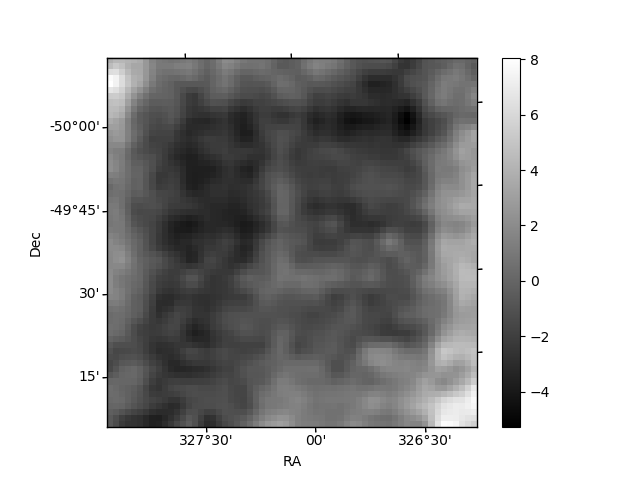
Histogram calculated using DETX and DETY for each event in the final _common_clean file
| Quadrant A | 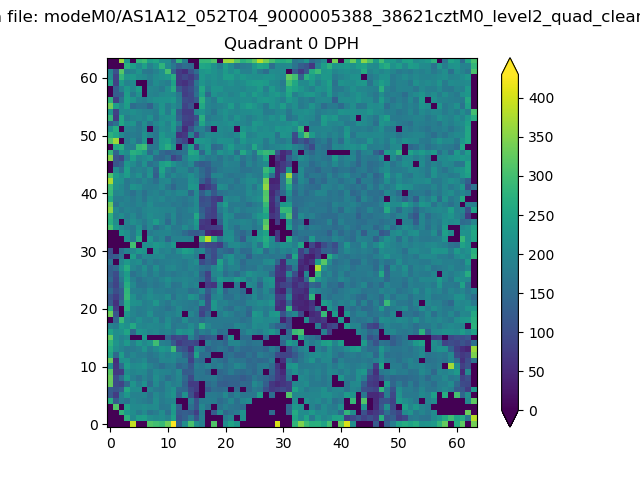 |
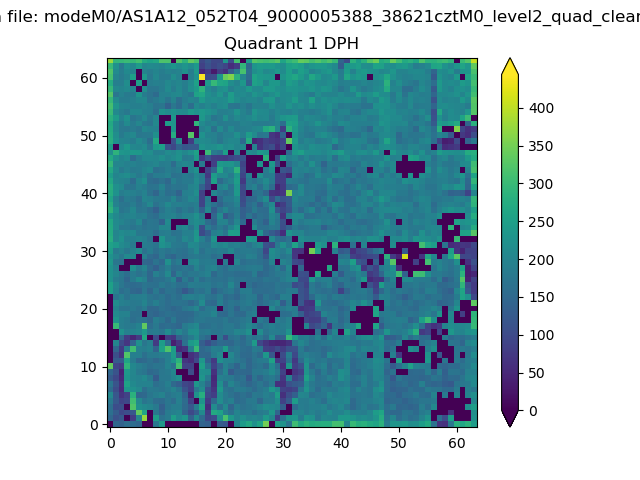 |
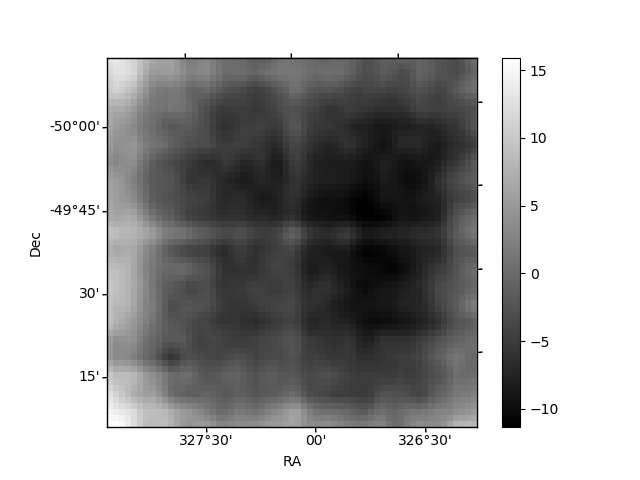
Quadrant B |
|---|---|---|---|
| Quadrant D | 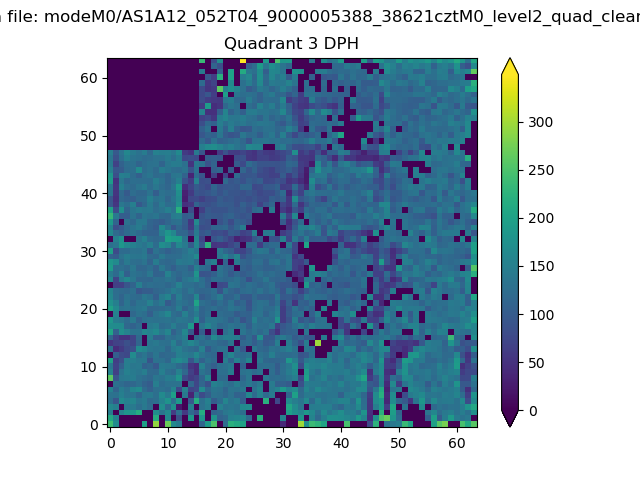 |
 |
Quadrant C |
| Plot type | Count rate plots | Images |
|---|---|---|
| Comparison with Poisson distribution Blue bars denote a histogram of data divided into 1 sec bins. Red curve is a Poisson curve with rate = median count rate of data. |
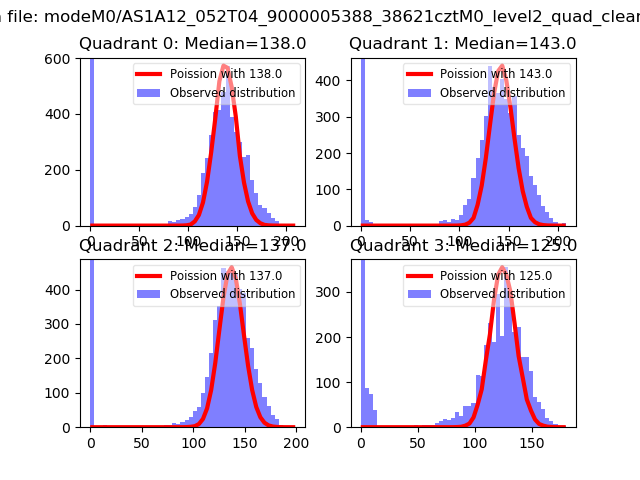 |
 |
| Quadrant-wise count rates Data is divided into 100 sec bins |
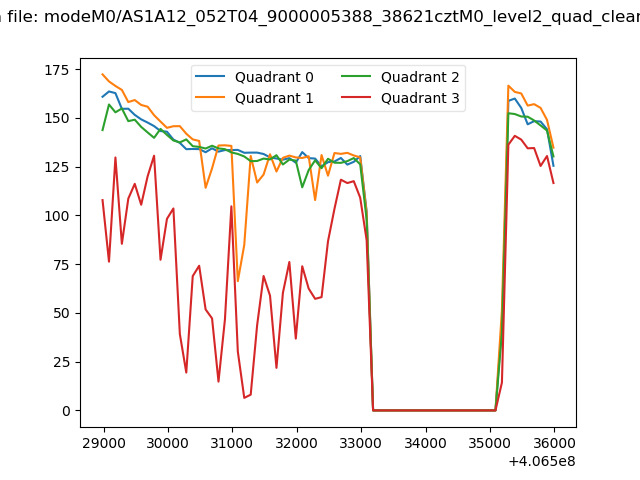 |
|
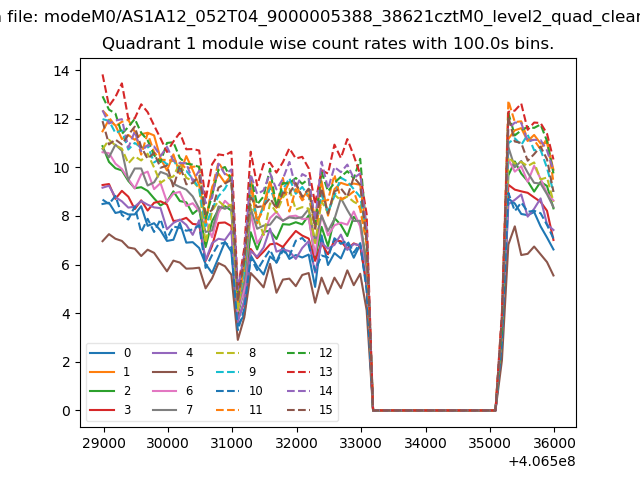
| Module-wise count rates for Quadrant A Data is divided into 100 sec bins |
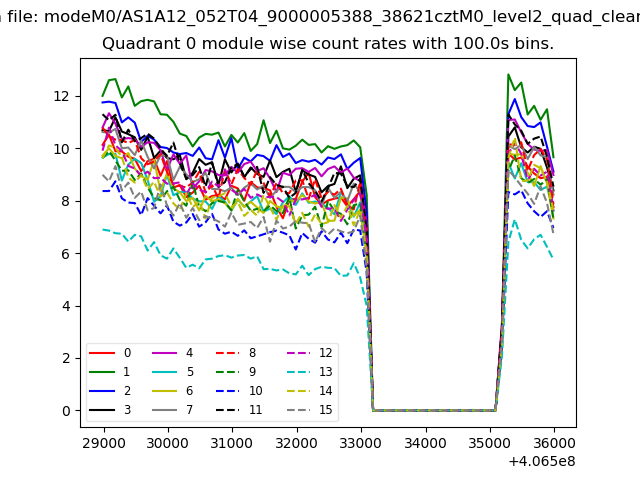 |
 |
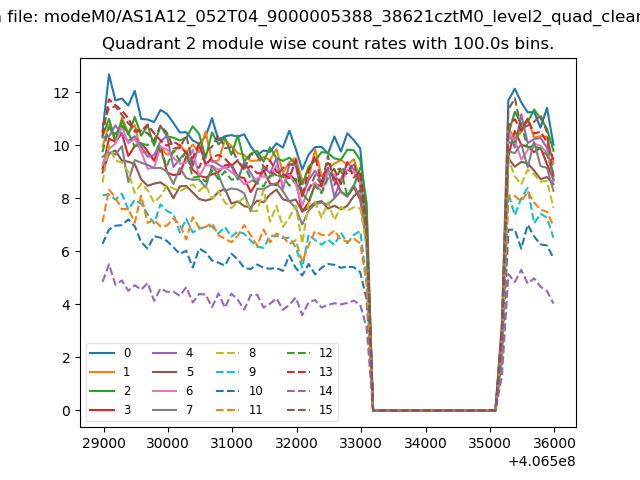
| Module-wise count rates for Quadrant B Data is divided into 100 sec bins |
 |
 |
| Module-wise count rates for Quadrant C Data is divided into 100 sec bins |
 |
 |
| Module-wise count rates for Quadrant D Data is divided into 100 sec bins |
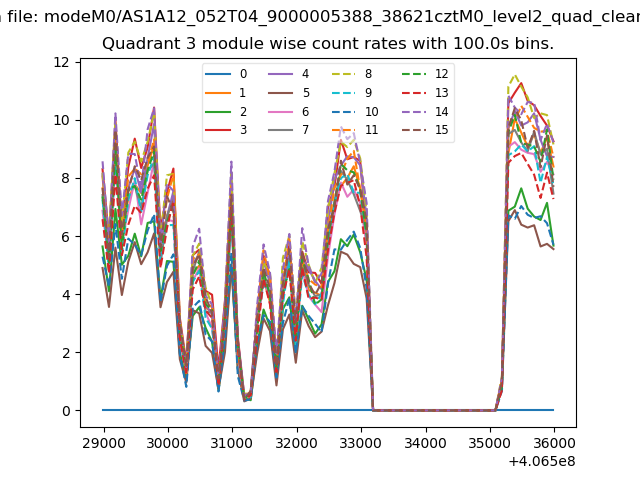 |
 |
| Parameter | Plot |
|---|---|
| CZT HV Monitor | 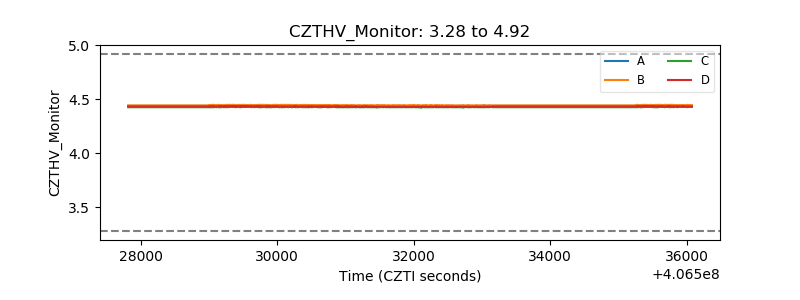 |
| D_VDD | 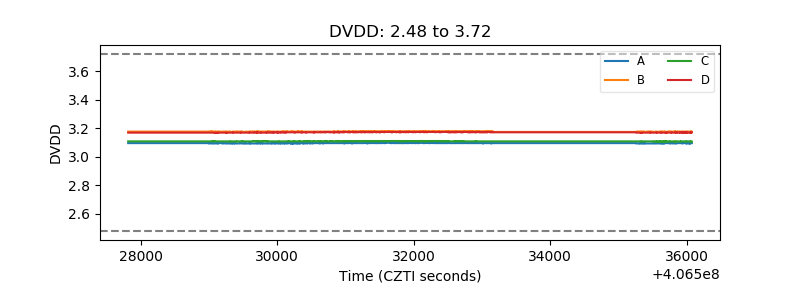 |
| Temperature 1 | 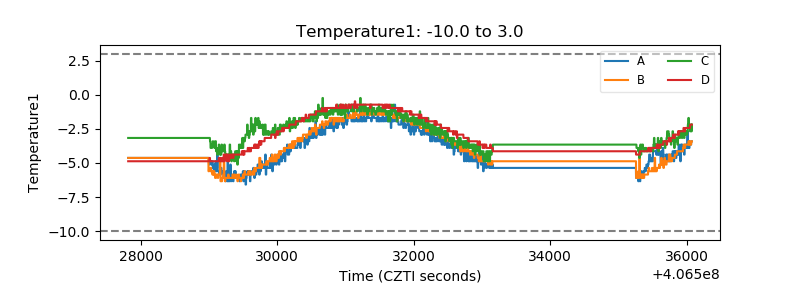 |
| Veto HV Monitor | 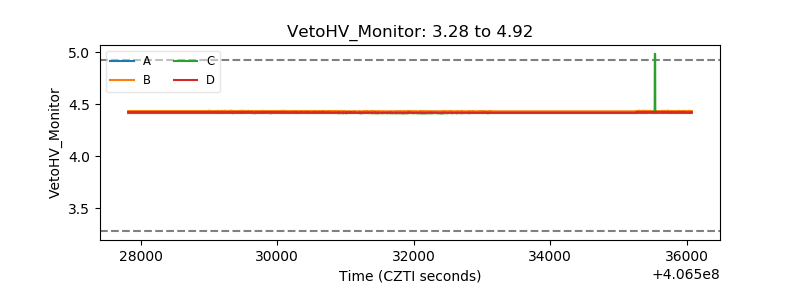 |
| Veto LLD | 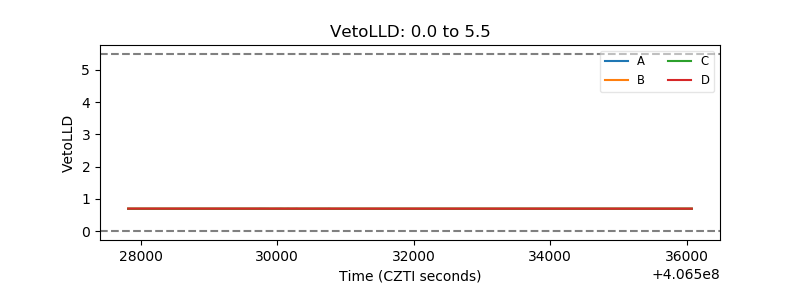 |
| Alpha Counter | 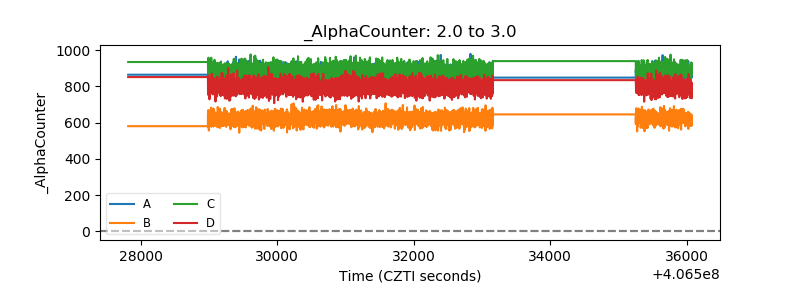 |
| _CPM_Rate | 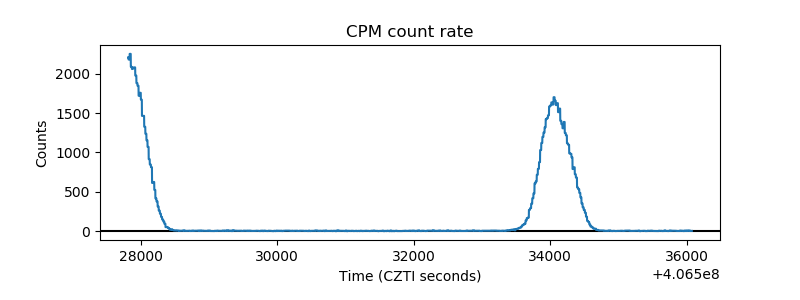 |
| CZT Counter | 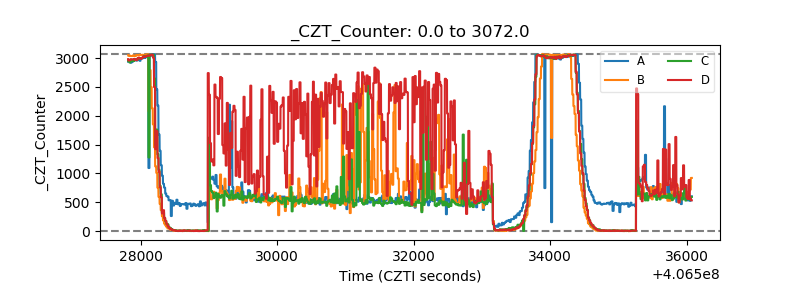 |
| +2.5 Volts monitor | 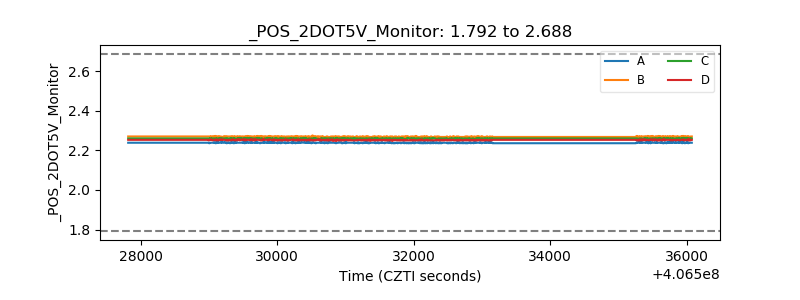 |
| +5 Volts monitor |  |
| _ROLL_ROT | 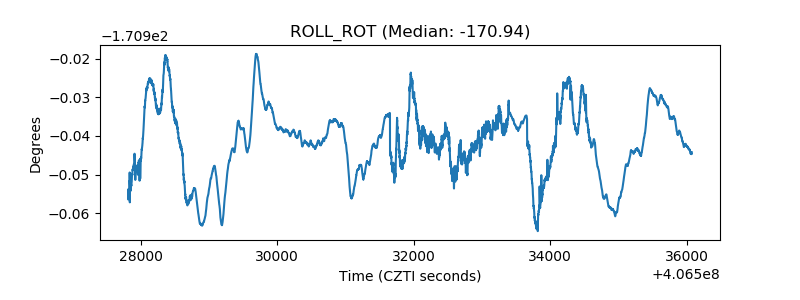 |
| _Roll_DEC | 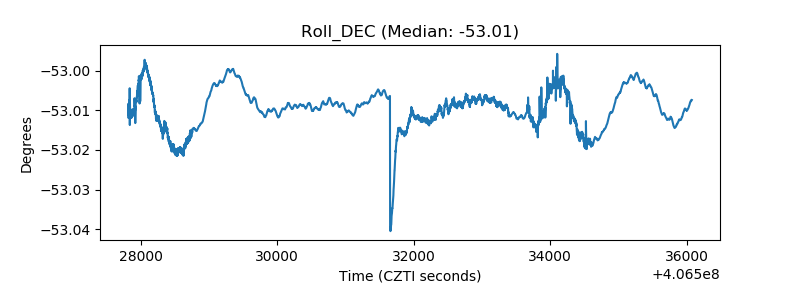 |
| _Roll_RA | 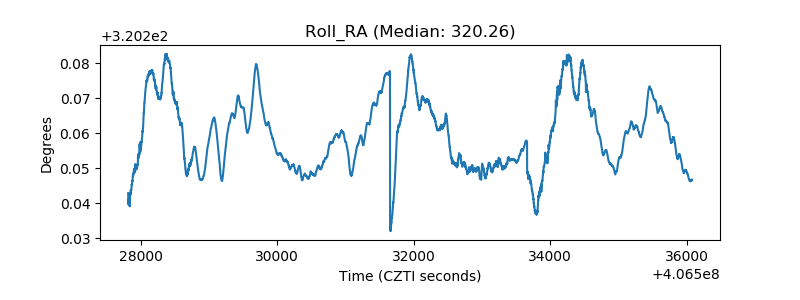 |
| Veto Counter | 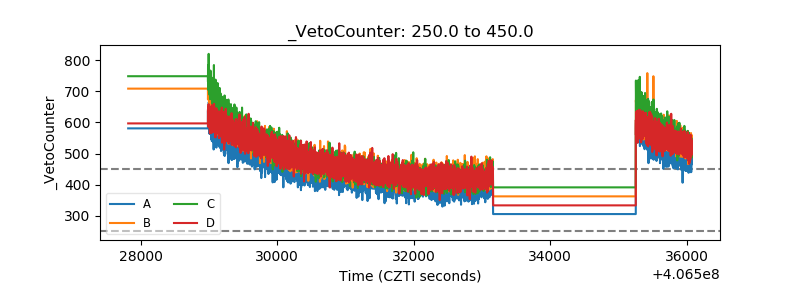 |