| Param | Original file | Final file |
|---|---|---|
| Filename | modeM0/AS1A12_052T04_9000005388_38622cztM0_level2.fits | modeM0/AS1A12_052T04_9000005388_38622cztM0_level2_quad_clean.evt |
| Size (bytes) | 2,075,806,080 | 391,593,600 |
| Size | 1.9 GB | 373.5 MB |
| Events in quadrant A | 13,241,157 | 2,806,218 |
| Events in quadrant B | 15,418,689 | 2,860,116 |
| Events in quadrant C | 14,967,873 | 2,737,271 |
| Events in quadrant D | 31,496,725 | 1,922,122 |
| Mode M0 | |||
|---|---|---|---|
| Quadrant | BADHDUFLAG | Total packets | Discarded packets |
| A | 0 | 52019 | 6 |
| B | 0 | 60208 | 5 |
| C | 0 | 58199 | 5 |
| D | 0 | 109152 | 5 |
| Mode SS | |||
|---|---|---|---|
| Quadrant | BADHDUFLAG | Total packets | Discarded packets |
| A | 0 | 454 | 0 |
| B | 0 | 454 | 0 |
| C | 0 | 454 | 0 |
| D | 0 | 454 | 0 |
| Mode M9 | |||
|---|---|---|---|
| Quadrant | BADHDUFLAG | Total packets | Discarded packets |
| A | 0 | 99 | 0 |
| B | 0 | 99 | 0 |
| C | 0 | 99 | 0 |
| D | 0 | 99 | 0 |
| Quadrant | Total seconds | Saturated seconds | Saturation percentage |
|---|---|---|---|
| A | 22256 | 446 | 2.003954% |
| B | 22256 | 804 | 3.612509% |
| C | 22256 | 855 | 3.841661% |
| D | 22256 | 5831 | 26.199676% |
Noise dominated data is calculated using 1-second bins in cleaned event files. If a bin has >2000 counts, and if more than 50% of those come from <1% of pixels, then it is considered to be noise-dominated and hence unusable.
| Quadrant | # 1 sec bins | Bins with >0 counts | Bins with >2000 counts | High rate bins dominated by noise | Noise dominated (total time) | Noise dominated (detector-on time) | Marked lightcurve |
|---|---|---|---|---|---|---|---|
| A | 32060 | 22261 | 395 | 395 | 1.23% | 1.77% | 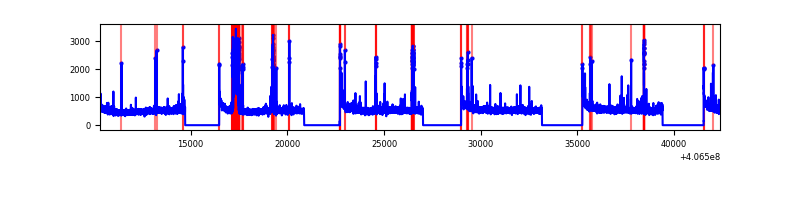 |
| B | 32060 | 22260 | 604 | 604 | 1.88% | 2.71% | 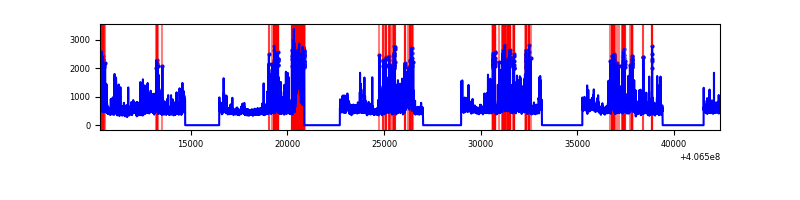 |
| C | 32060 | 22261 | 766 | 766 | 2.39% | 3.44% | 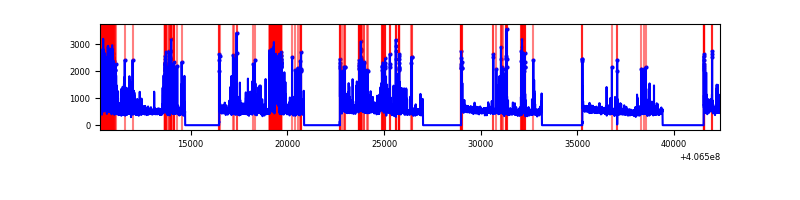 |
| D | 32060 | 22260 | 6191 | 6191 | 19.31% | 27.81% | 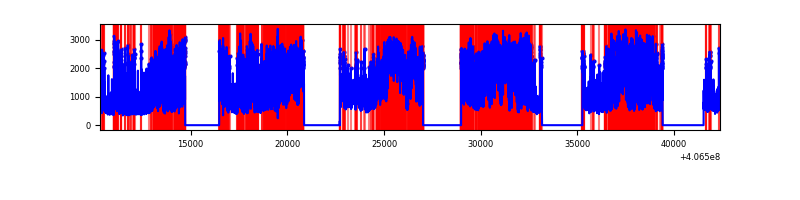 |
Top three noisy pixels from each quadrant. If the there are fewer than three noisy pixels in the level2.evt file, extra rows are filled as -1
| Pixel properties | Quadrant properties | ||||||
|---|---|---|---|---|---|---|---|
| Quadrant | DetID | PixID | Counts | Sigma | Mean | Median | Sigma |
| A | 10 | 83 | 1534837 | 2944.15 | 2669 | 2619 | 520.4 |
| A | 15 | 223 | 877122 | 1680.35 | 2669 | 2619 | 520.4 |
| A | 13 | 248 | 196794 | 373.11 | 2669 | 2619 | 520.4 |
| B | 4 | 171 | 4050858 | 8280.13 | 2643 | 2579 | 488.9 |
| B | 5 | 172 | 357237 | 725.4 | 2643 | 2579 | 488.9 |
| B | 5 | 184 | 232262 | 469.78 | 2643 | 2579 | 488.9 |
| C | 14 | 254 | 3724370 | 6381.99 | 2583 | 2604 | 583.2 |
| C | 15 | 214 | 892709 | 1526.33 | 2583 | 2604 | 583.2 |
| C | 15 | 159 | 146400 | 246.58 | 2583 | 2604 | 583.2 |
| D | 12 | 227 | 10205207 | 17810.49 | 2381 | 2318 | 572.9 |
| D | 2 | 249 | 4299158 | 7500.7 | 2381 | 2318 | 572.9 |
| D | 1 | 47 | 2144799 | 3739.98 | 2381 | 2318 | 572.9 |
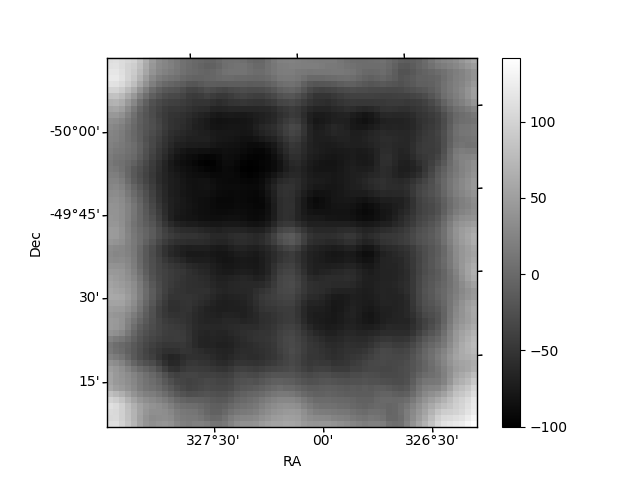
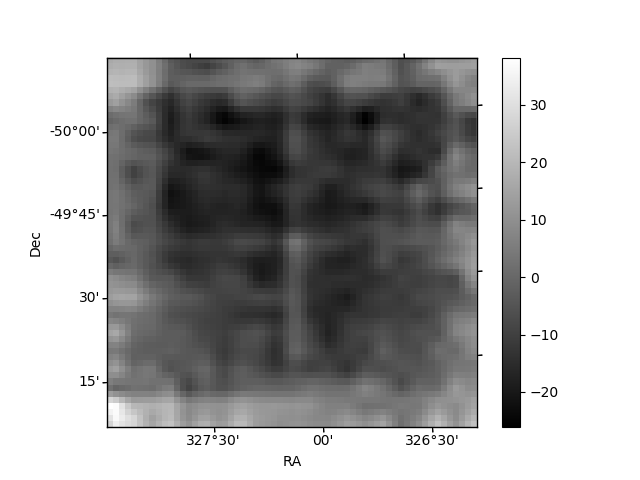
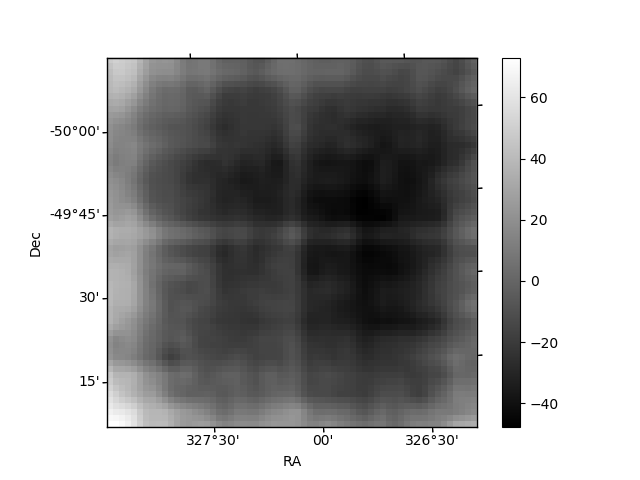
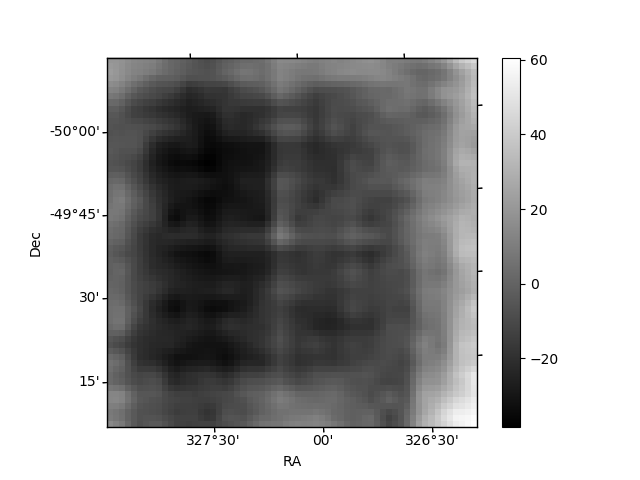
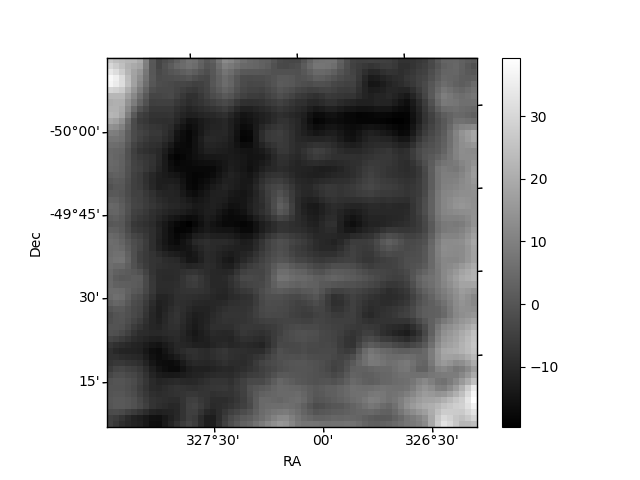
Histogram calculated using DETX and DETY for each event in the final _common_clean file
| Quadrant A | 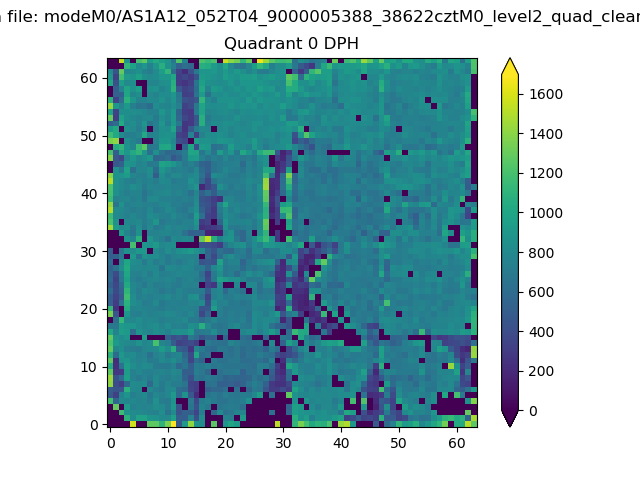 |
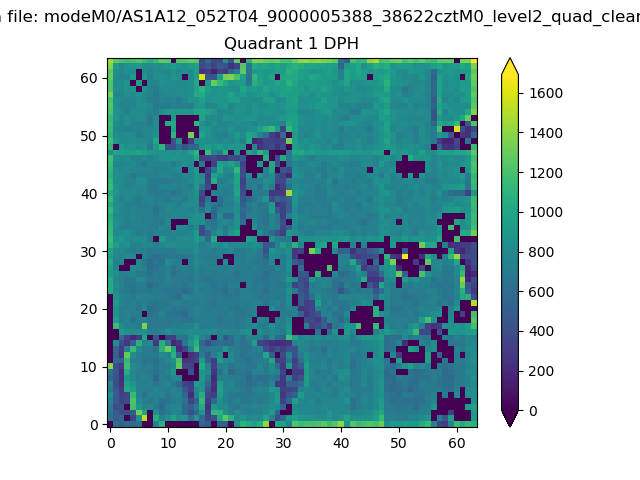 |
Quadrant B |
|---|---|---|---|
| Quadrant D | 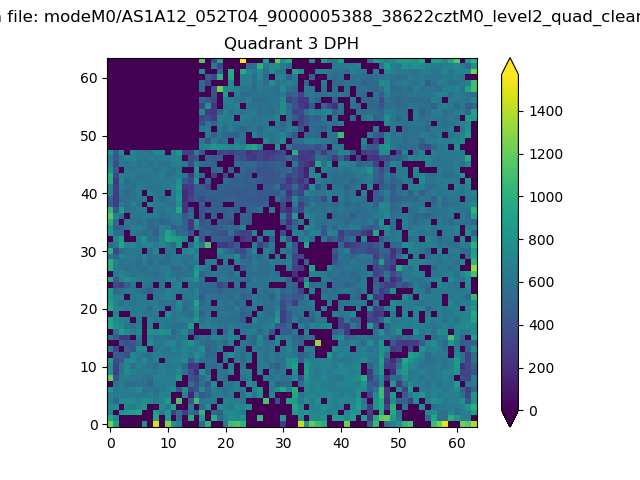 |
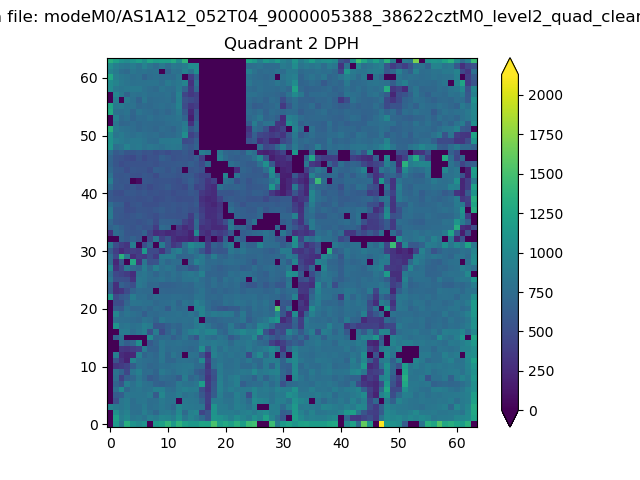 |
Quadrant C |
| Plot type | Count rate plots | Images |
|---|---|---|
| Comparison with Poisson distribution Blue bars denote a histogram of data divided into 1 sec bins. Red curve is a Poisson curve with rate = median count rate of data. |
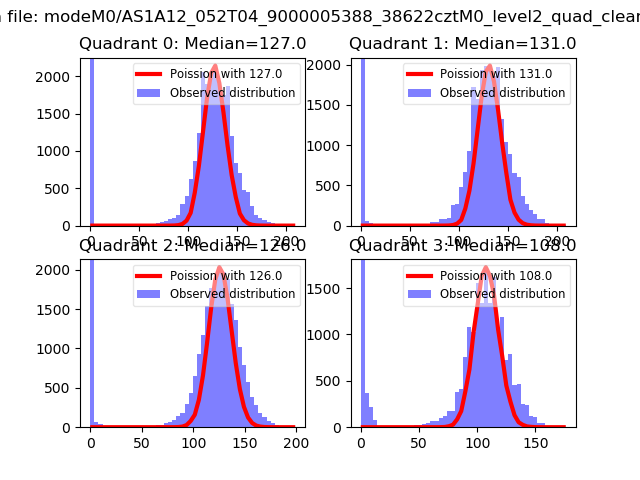 |
 |
| Quadrant-wise count rates Data is divided into 100 sec bins |
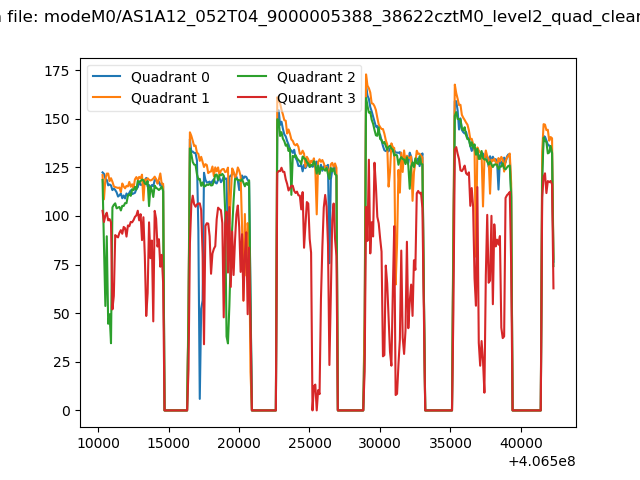 |
|
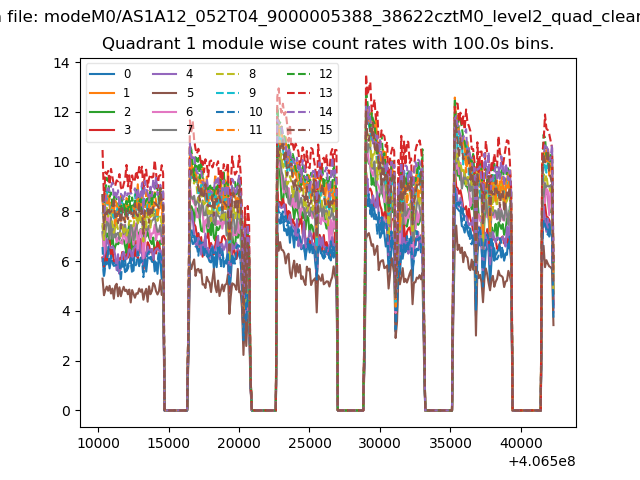
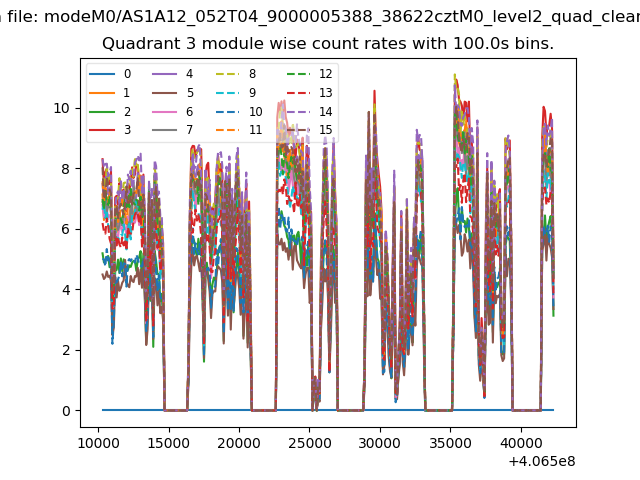
| Module-wise count rates for Quadrant A Data is divided into 100 sec bins |
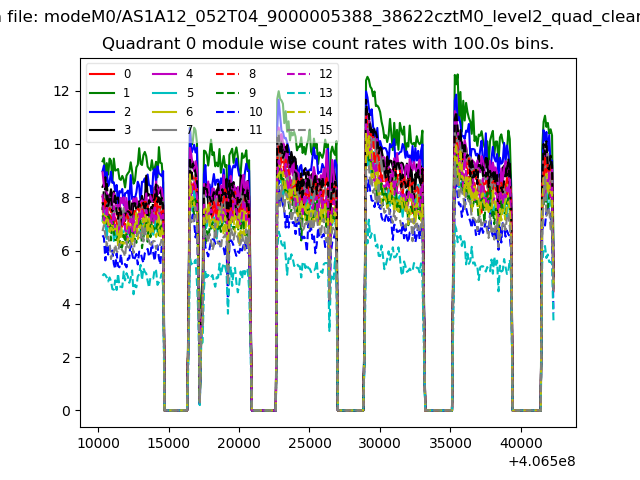 |
 |
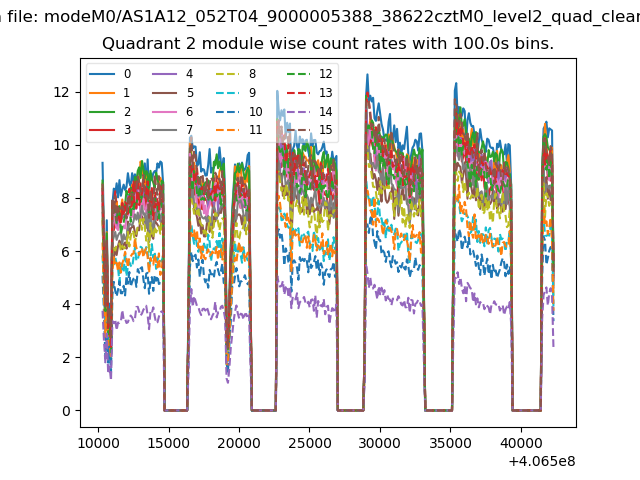
| Module-wise count rates for Quadrant B Data is divided into 100 sec bins |
 |
 |
| Module-wise count rates for Quadrant C Data is divided into 100 sec bins |
 |
 |
| Module-wise count rates for Quadrant D Data is divided into 100 sec bins |
 |
 |
| Parameter | Plot |
|---|---|
| CZT HV Monitor | 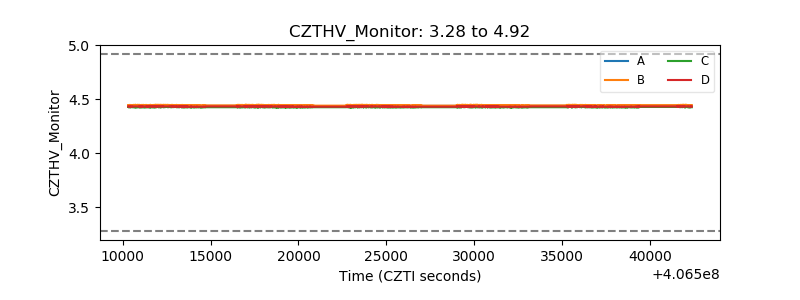 |
| D_VDD | 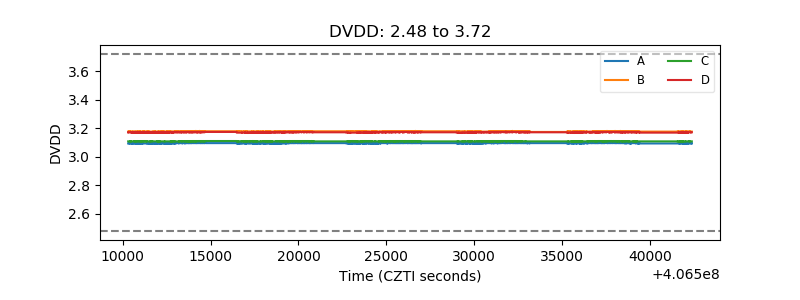 |
| Temperature 1 | 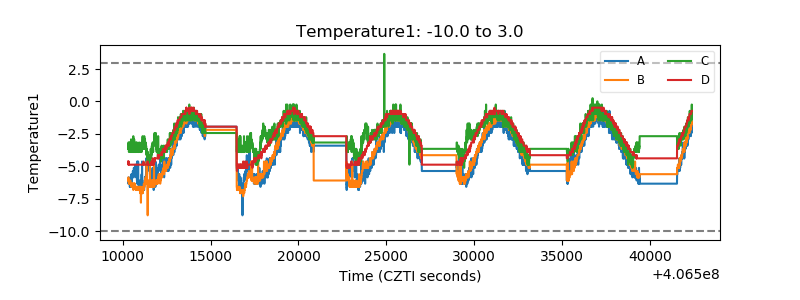 |
| Veto HV Monitor | 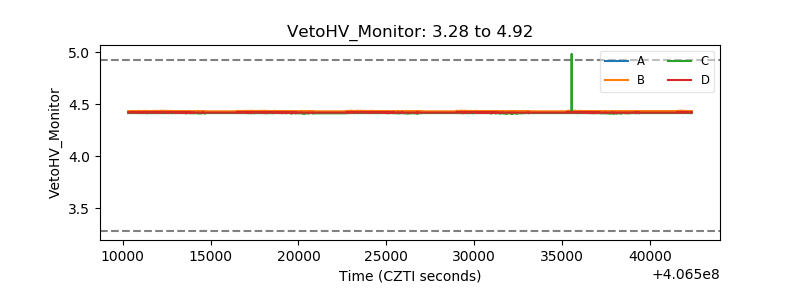 |
| Veto LLD | 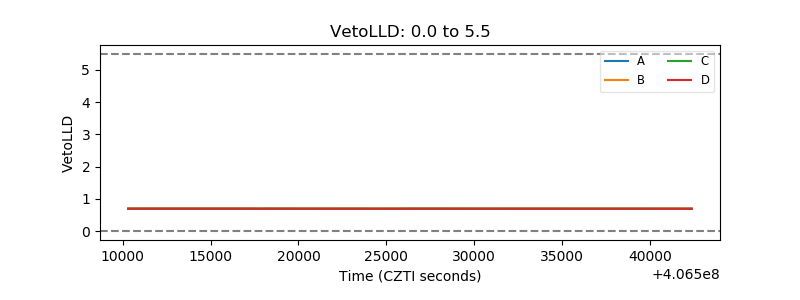 |
| Alpha Counter | 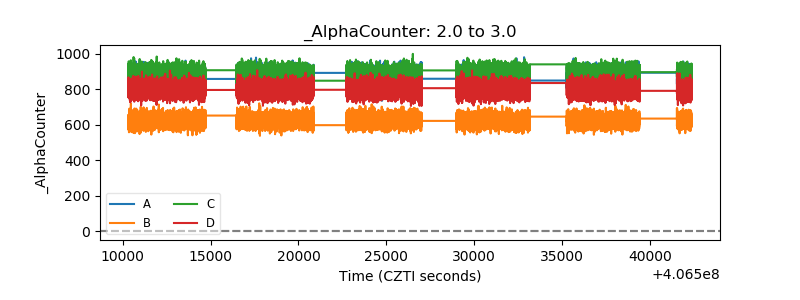 |
| _CPM_Rate | 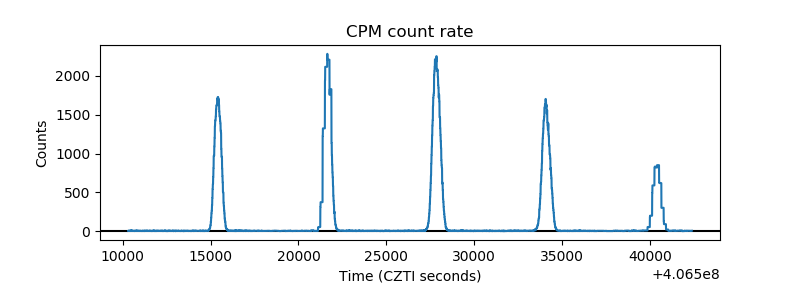 |
| CZT Counter | 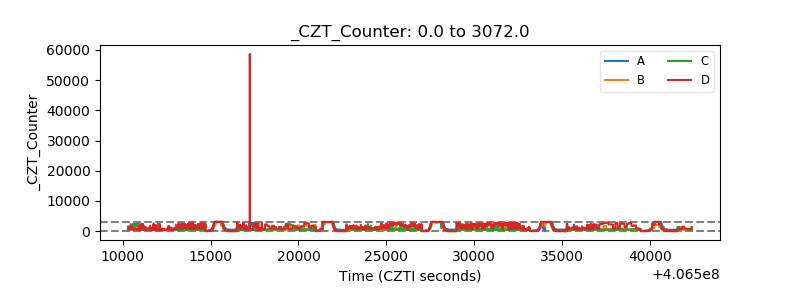 |
| +2.5 Volts monitor | 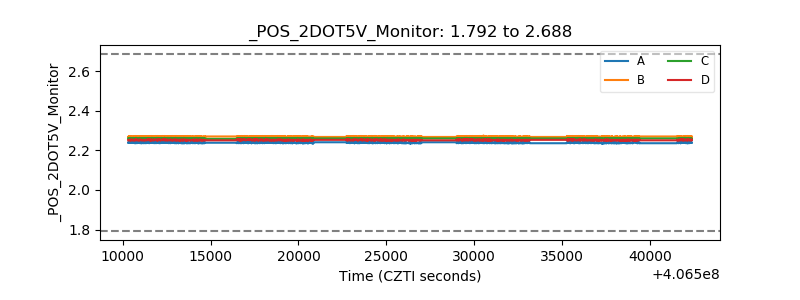 |
| +5 Volts monitor | 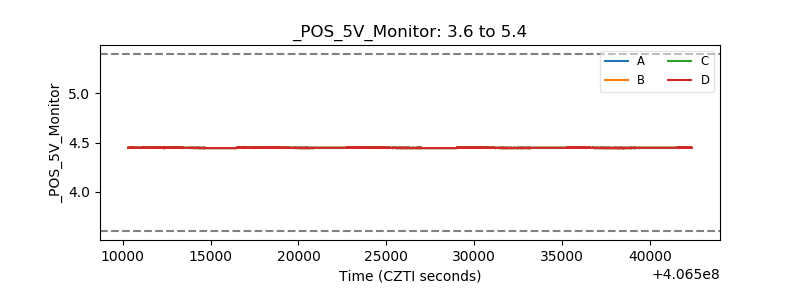 |
| _ROLL_ROT | 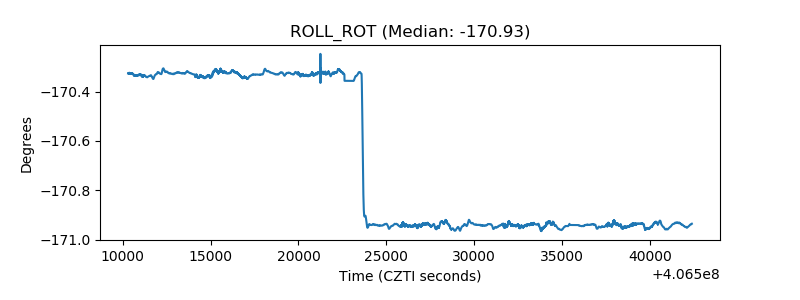 |
| _Roll_DEC | 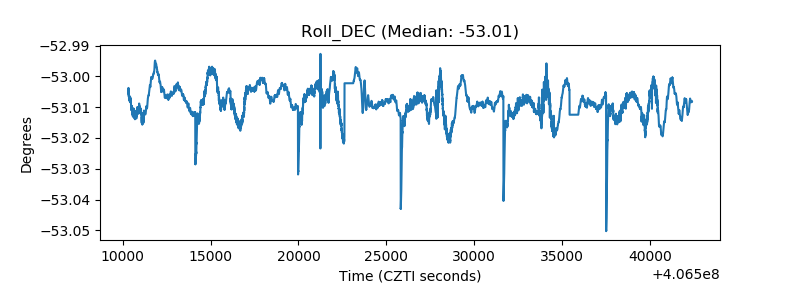 |
| _Roll_RA | 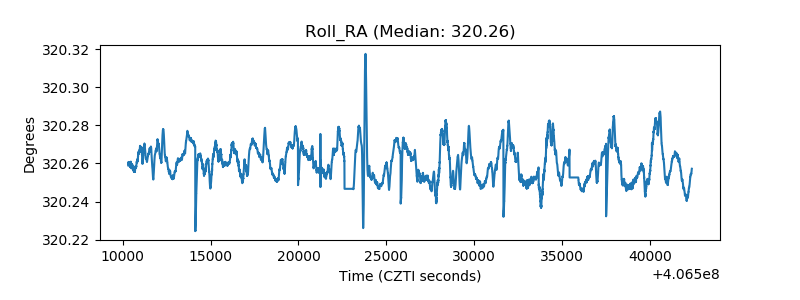 |
| Veto Counter | 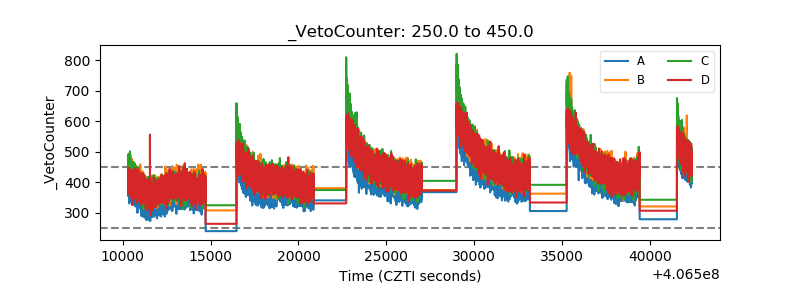 |