| Param | Original file | Final file |
|---|---|---|
| Filename | modeM0/AS1A12_052T04_9000005388_38623cztM0_level2.fits | modeM0/AS1A12_052T04_9000005388_38623cztM0_level2_quad_clean.evt |
| Size (bytes) | 471,130,560 | 86,143,680 |
| Size | 449.3 MB | 82.2 MB |
| Events in quadrant A | 2,794,855 | 632,917 |
| Events in quadrant B | 3,320,680 | 639,505 |
| Events in quadrant C | 2,832,616 | 617,504 |
| Events in quadrant D | 8,105,053 | 370,080 |
| Mode M0 | |||
|---|---|---|---|
| Quadrant | BADHDUFLAG | Total packets | Discarded packets |
| A | 0 | 11224 | 3 |
| B | 0 | 13036 | 2 |
| C | 0 | 11454 | 2 |
| D | 0 | 27532 | 2 |
| Mode SS | |||
|---|---|---|---|
| Quadrant | BADHDUFLAG | Total packets | Discarded packets |
| A | 0 | 100 | 0 |
| B | 0 | 100 | 0 |
| C | 0 | 100 | 0 |
| D | 0 | 100 | 0 |
| Mode M9 | |||
|---|---|---|---|
| Quadrant | BADHDUFLAG | Total packets | Discarded packets |
| A | 0 | 26 | 0 |
| B | 0 | 26 | 0 |
| C | 0 | 26 | 0 |
| D | 0 | 27 | 0 |
| Quadrant | Total seconds | Saturated seconds | Saturation percentage |
|---|---|---|---|
| A | 4974 | 24 | 0.482509% |
| B | 4974 | 88 | 1.769200% |
| C | 4974 | 61 | 1.226377% |
| D | 4974 | 1983 | 39.867310% |
Noise dominated data is calculated using 1-second bins in cleaned event files. If a bin has >2000 counts, and if more than 50% of those come from <1% of pixels, then it is considered to be noise-dominated and hence unusable.
| Quadrant | # 1 sec bins | Bins with >0 counts | Bins with >2000 counts | High rate bins dominated by noise | Noise dominated (total time) | Noise dominated (detector-on time) | Marked lightcurve |
|---|---|---|---|---|---|---|---|
| A | 7067 | 4975 | 9 | 9 | 0.13% | 0.18% | 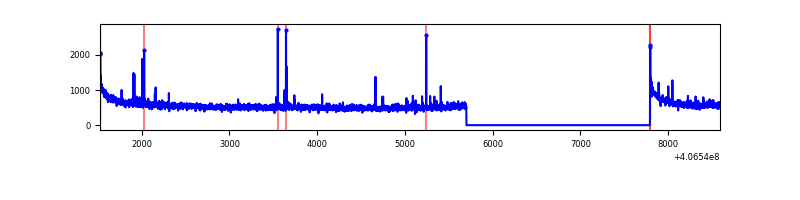 |
| B | 7067 | 4975 | 56 | 56 | 0.79% | 1.13% | 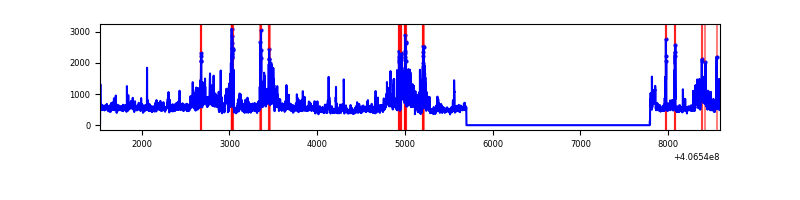 |
| C | 7067 | 4975 | 65 | 65 | 0.92% | 1.31% | 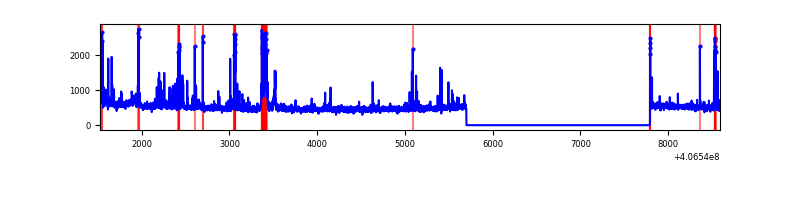 |
| D | 7067 | 4975 | 2064 | 2064 | 29.21% | 41.49% | 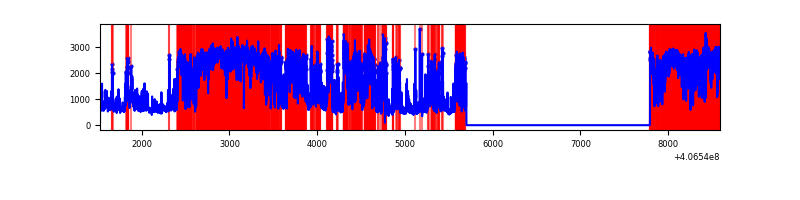 |
Top three noisy pixels from each quadrant. If the there are fewer than three noisy pixels in the level2.evt file, extra rows are filled as -1
| Pixel properties | Quadrant properties | ||||||
|---|---|---|---|---|---|---|---|
| Quadrant | DetID | PixID | Counts | Sigma | Mean | Median | Sigma |
| A | 10 | 83 | 423404 | 3557.19 | 595 | 585 | 118.9 |
| A | 13 | 248 | 33497 | 276.89 | 595 | 585 | 118.9 |
| A | 13 | 6 | 9753 | 77.13 | 595 | 585 | 118.9 |
| B | 4 | 171 | 490880 | 4440.73 | 584 | 570 | 110.4 |
| B | 5 | 184 | 288732 | 2609.88 | 584 | 570 | 110.4 |
| B | 0 | 186 | 70943 | 637.37 | 584 | 570 | 110.4 |
| C | 14 | 254 | 362049 | 2730.39 | 571 | 574 | 132.4 |
| C | 15 | 214 | 204477 | 1540.17 | 571 | 574 | 132.4 |
| C | 0 | 10 | 31863 | 236.34 | 571 | 574 | 132.4 |
| D | 12 | 227 | 3852748 | 32749.95 | 478 | 463 | 117.6 |
| D | 2 | 249 | 833597 | 7082.83 | 478 | 463 | 117.6 |
| D | 2 | 16 | 380119 | 3227.62 | 478 | 463 | 117.6 |
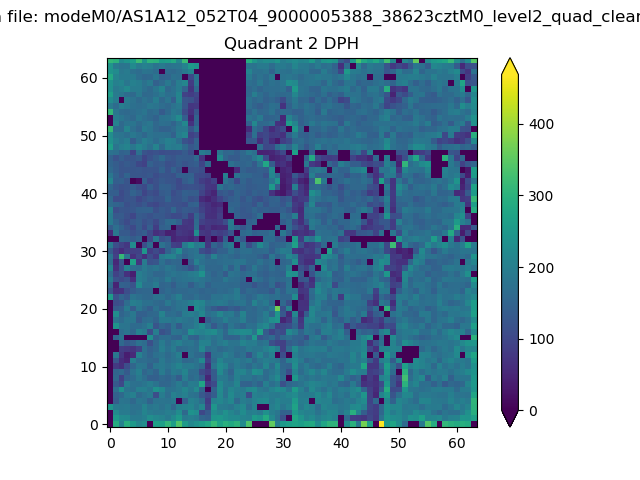
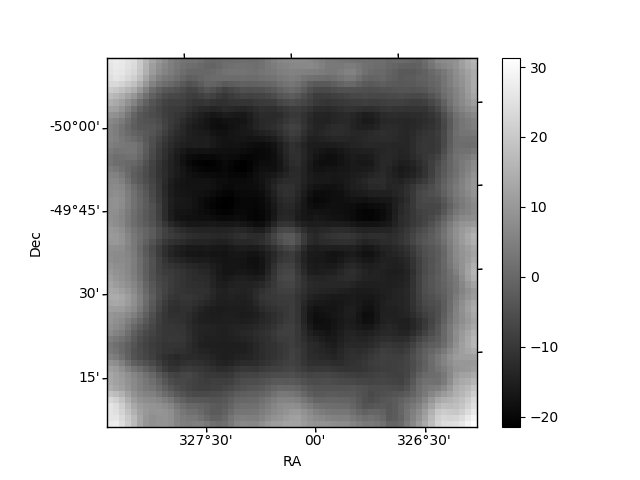
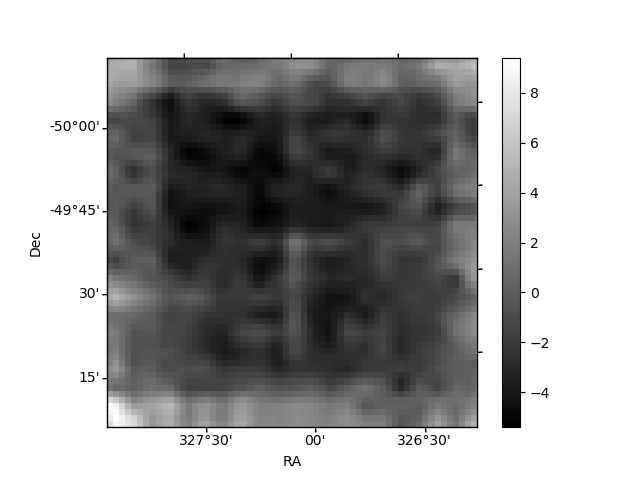
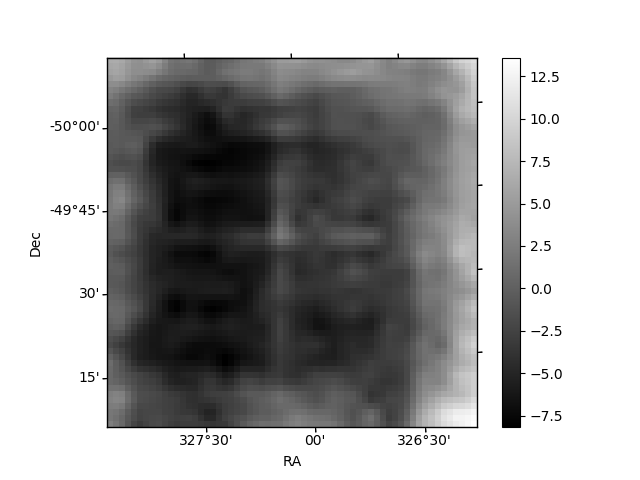
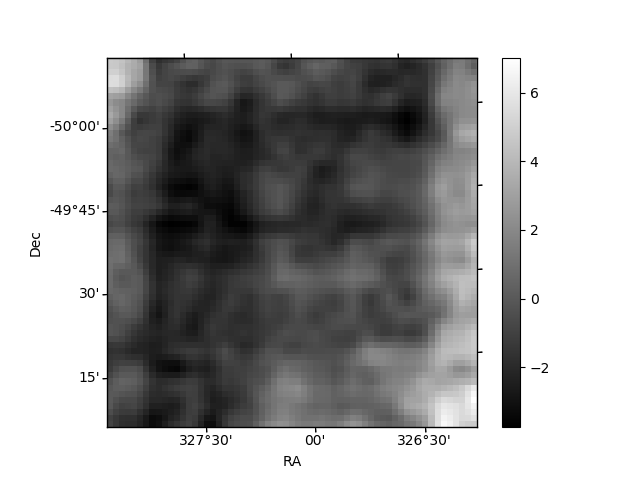
Histogram calculated using DETX and DETY for each event in the final _common_clean file
| Quadrant A | 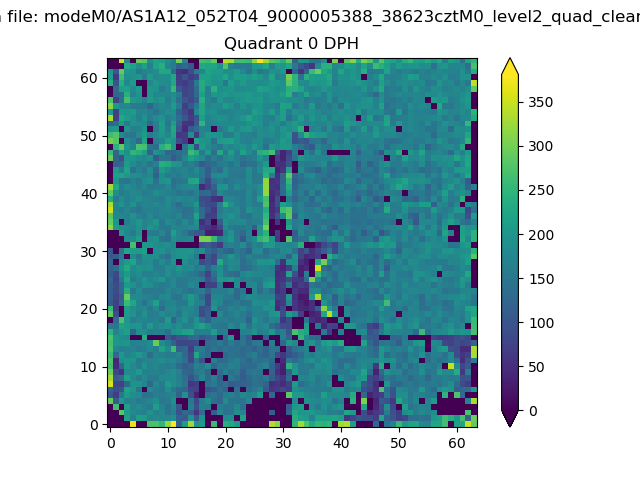 |
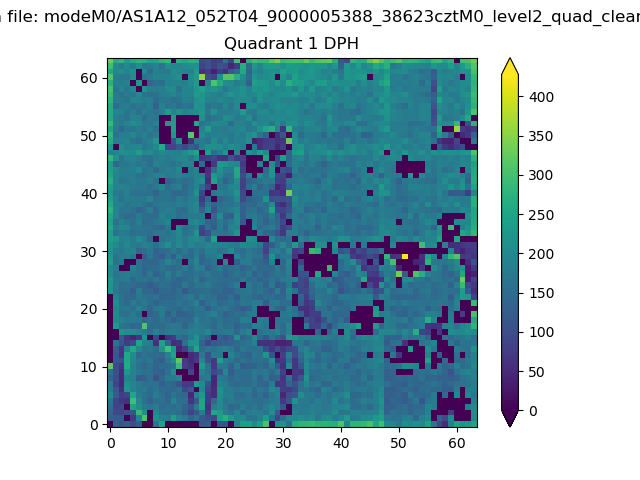 |
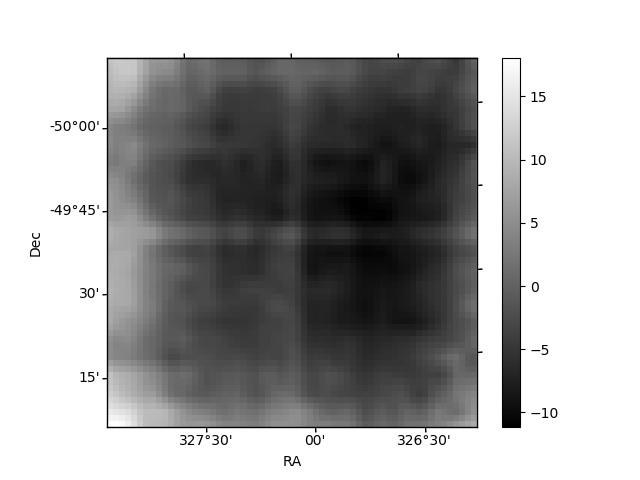
Quadrant B |
|---|---|---|---|
| Quadrant D | 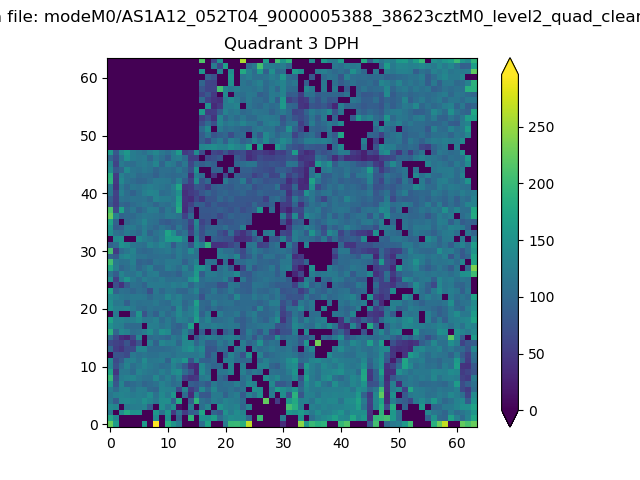 |
 |
Quadrant C |
| Plot type | Count rate plots | Images |
|---|---|---|
| Comparison with Poisson distribution Blue bars denote a histogram of data divided into 1 sec bins. Red curve is a Poisson curve with rate = median count rate of data. |
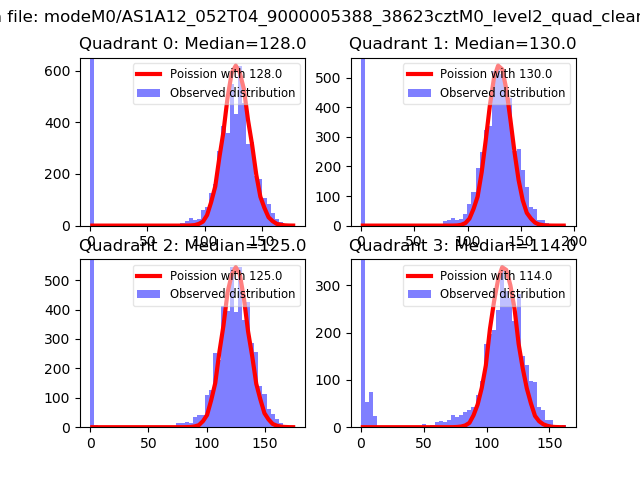 |
 |
| Quadrant-wise count rates Data is divided into 100 sec bins |
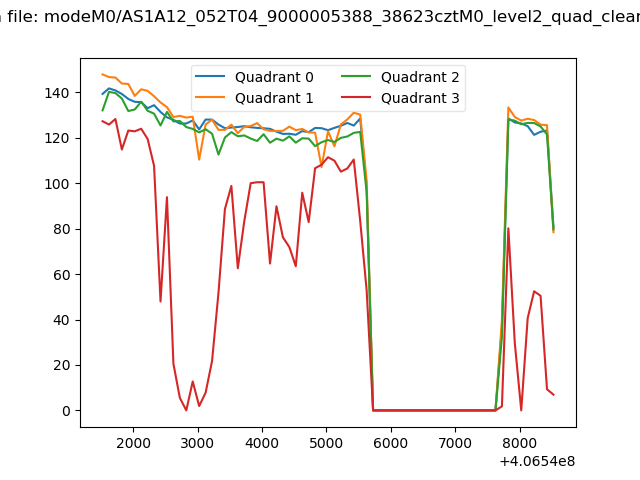 |
|
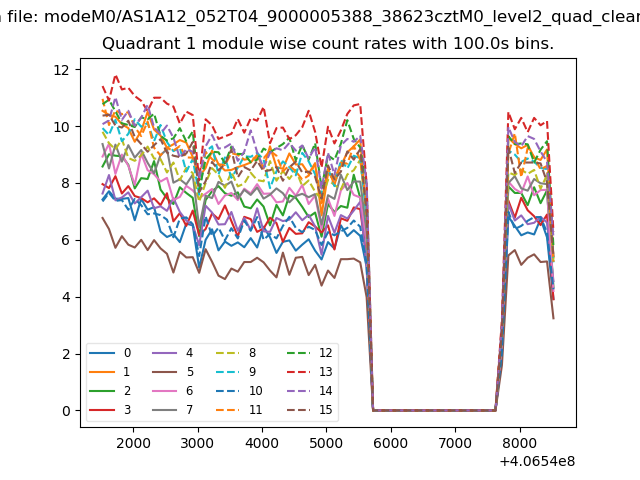
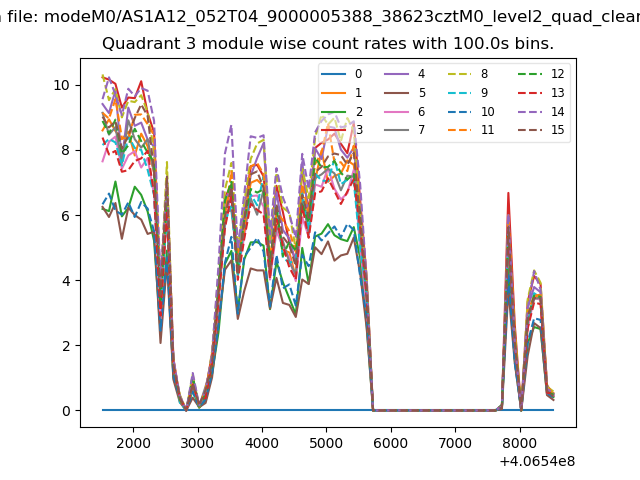
| Module-wise count rates for Quadrant A Data is divided into 100 sec bins |
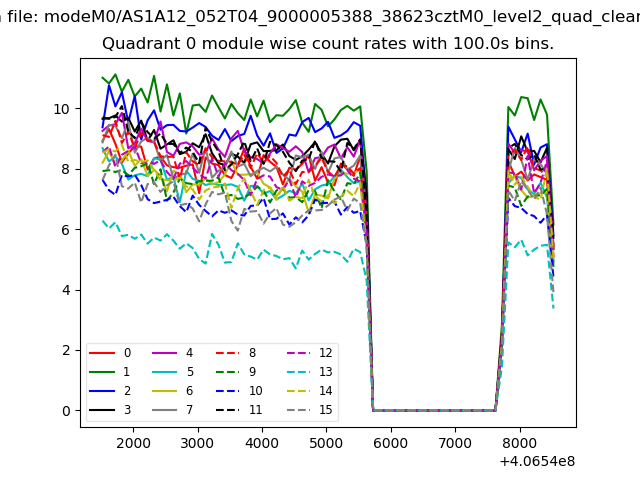 |
 |
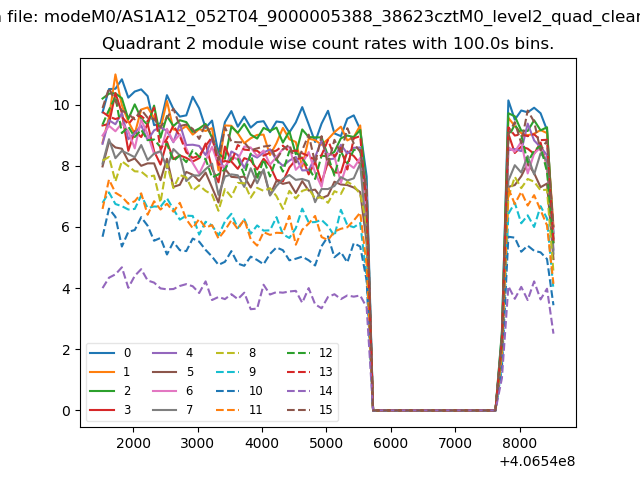
| Module-wise count rates for Quadrant B Data is divided into 100 sec bins |
 |
 |
| Module-wise count rates for Quadrant C Data is divided into 100 sec bins |
 |
 |
| Module-wise count rates for Quadrant D Data is divided into 100 sec bins |
 |
 |
| Parameter | Plot |
|---|---|
| CZT HV Monitor | 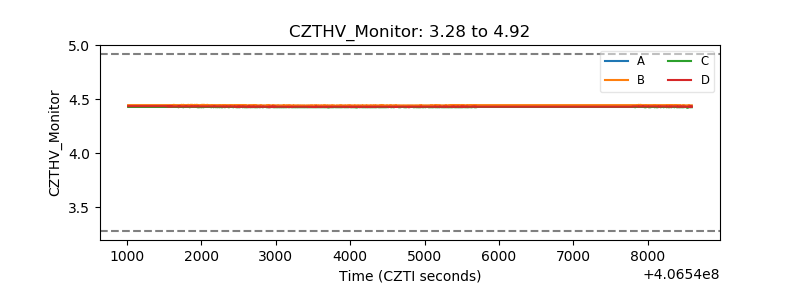 |
| D_VDD | 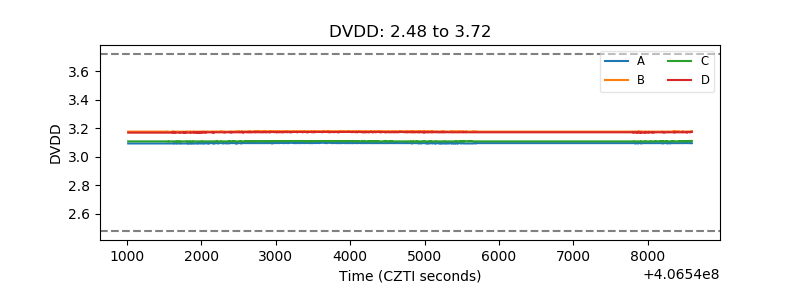 |
| Temperature 1 | 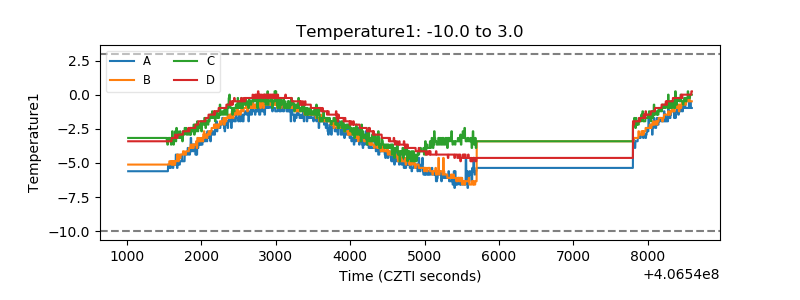 |
| Veto HV Monitor |  |
| Veto LLD | 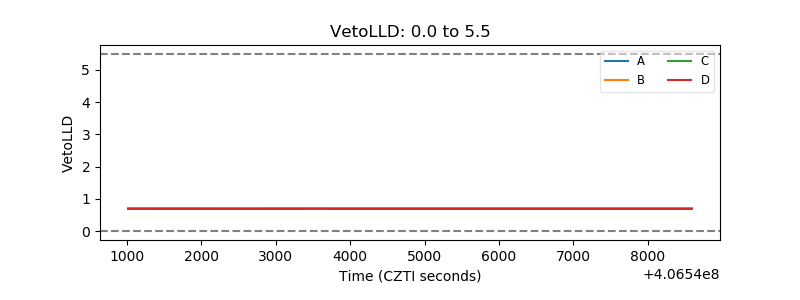 |
| Alpha Counter | 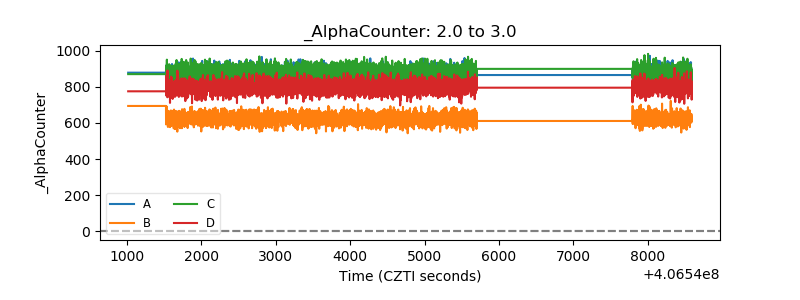 |
| _CPM_Rate | 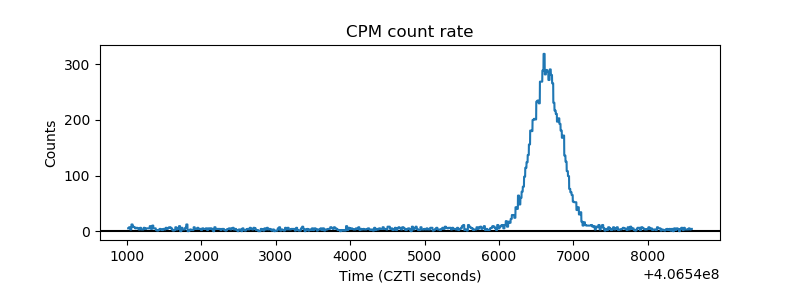 |
| CZT Counter | 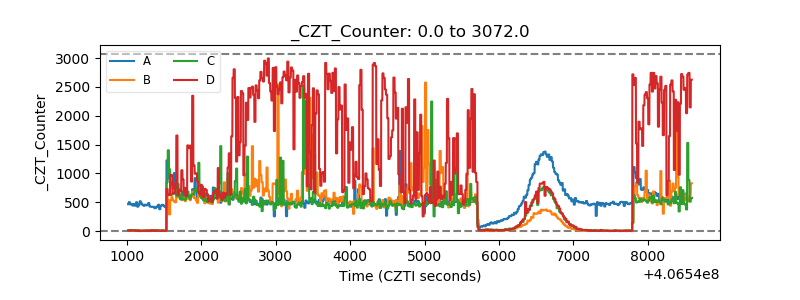 |
| +2.5 Volts monitor | 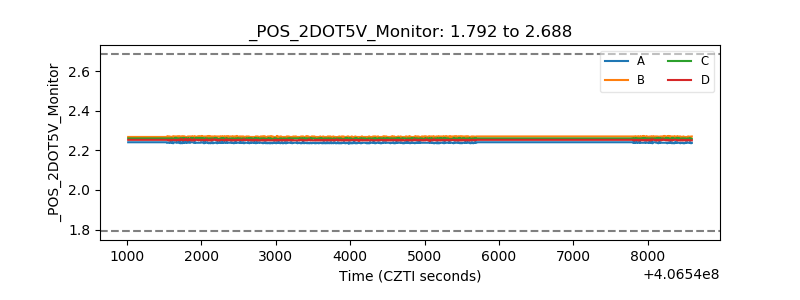 |
| +5 Volts monitor | 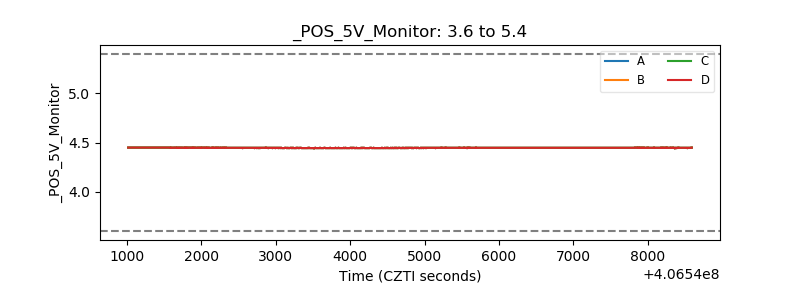 |
| _ROLL_ROT | 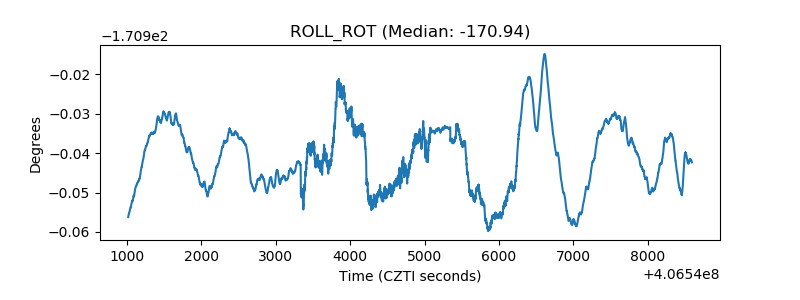 |
| _Roll_DEC | 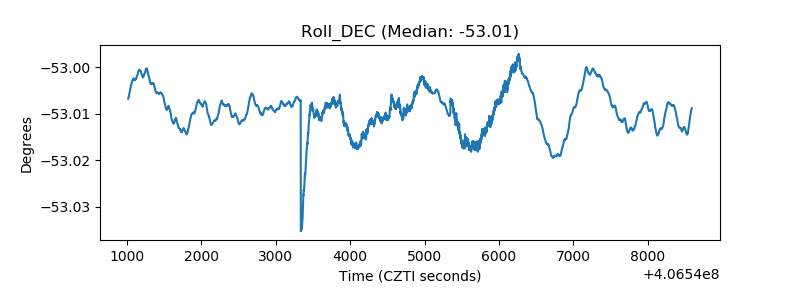 |
| _Roll_RA | 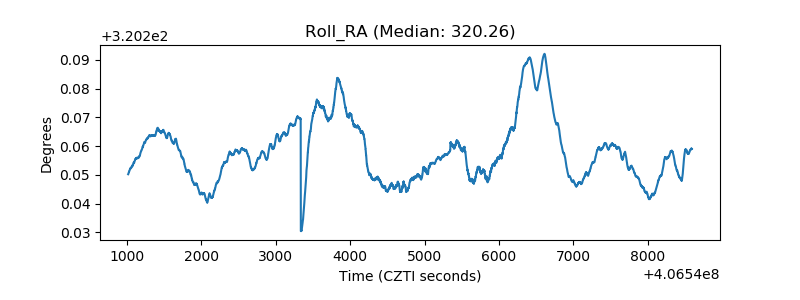 |
| Veto Counter | 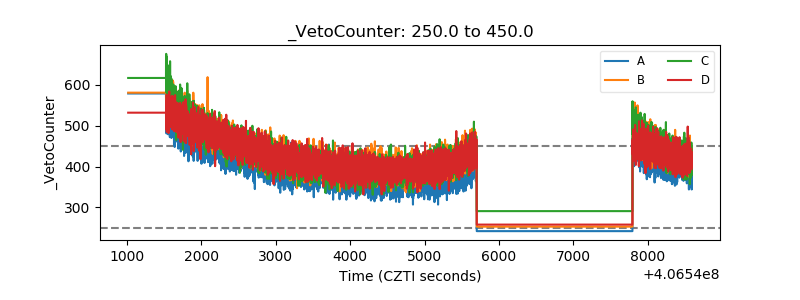 |