| Param | Original file | Final file |
|---|---|---|
| Filename | modeM0/AS1A12_052T04_9000005388_38624cztM0_level2.fits | modeM0/AS1A12_052T04_9000005388_38624cztM0_level2_quad_clean.evt |
| Size (bytes) | 549,812,160 | 87,223,680 |
| Size | 524.3 MB | 83.2 MB |
| Events in quadrant A | 3,099,704 | 650,888 |
| Events in quadrant B | 4,355,304 | 628,877 |
| Events in quadrant C | 3,101,624 | 633,460 |
| Events in quadrant D | 9,369,729 | 343,746 |
| Mode M0 | |||
|---|---|---|---|
| Quadrant | BADHDUFLAG | Total packets | Discarded packets |
| A | 0 | 12454 | 3 |
| B | 0 | 16531 | 2 |
| C | 0 | 12613 | 2 |
| D | 0 | 31621 | 2 |
| Mode SS | |||
|---|---|---|---|
| Quadrant | BADHDUFLAG | Total packets | Discarded packets |
| A | 0 | 112 | 0 |
| B | 0 | 112 | 0 |
| C | 0 | 112 | 0 |
| D | 0 | 112 | 0 |
| Mode M9 | |||
|---|---|---|---|
| Quadrant | BADHDUFLAG | Total packets | Discarded packets |
| A | 0 | 19 | 0 |
| B | 0 | 19 | 0 |
| C | 0 | 19 | 0 |
| D | 0 | 19 | 0 |
| Quadrant | Total seconds | Saturated seconds | Saturation percentage |
|---|---|---|---|
| A | 5485 | 23 | 0.419325% |
| B | 5485 | 363 | 6.618049% |
| C | 5485 | 78 | 1.422060% |
| D | 5486 | 2475 | 45.114838% |
Noise dominated data is calculated using 1-second bins in cleaned event files. If a bin has >2000 counts, and if more than 50% of those come from <1% of pixels, then it is considered to be noise-dominated and hence unusable.
| Quadrant | # 1 sec bins | Bins with >0 counts | Bins with >2000 counts | High rate bins dominated by noise | Noise dominated (total time) | Noise dominated (detector-on time) | Marked lightcurve |
|---|---|---|---|---|---|---|---|
| A | 7368 | 5486 | 18 | 18 | 0.24% | 0.33% | 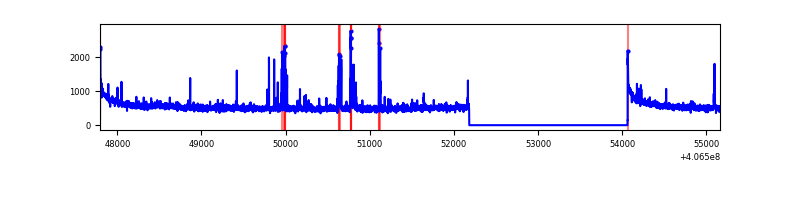 |
| B | 7368 | 5486 | 314 | 314 | 4.26% | 5.72% | 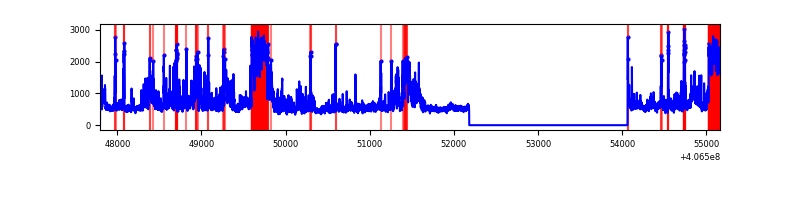 |
| C | 7368 | 5486 | 76 | 76 | 1.03% | 1.39% | 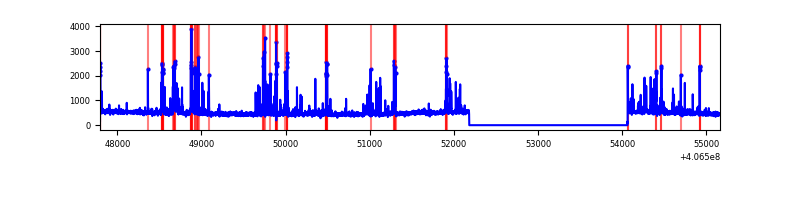 |
| D | 7369 | 5487 | 2556 | 2556 | 34.69% | 46.58% | 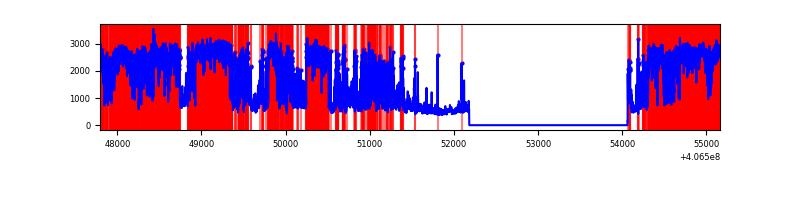 |
Top three noisy pixels from each quadrant. If the there are fewer than three noisy pixels in the level2.evt file, extra rows are filled as -1
| Pixel properties | Quadrant properties | ||||||
|---|---|---|---|---|---|---|---|
| Quadrant | DetID | PixID | Counts | Sigma | Mean | Median | Sigma |
| A | 10 | 83 | 474745 | 3752.38 | 626 | 616 | 126.4 |
| A | 7 | 16 | 97689 | 768.26 | 626 | 616 | 126.4 |
| A | 12 | 189 | 35169 | 273.46 | 626 | 616 | 126.4 |
| B | 4 | 171 | 1187424 | 10203.77 | 611 | 595 | 116.3 |
| B | 5 | 184 | 268903 | 2306.78 | 611 | 595 | 116.3 |
| B | 0 | 186 | 89092 | 760.85 | 611 | 595 | 116.3 |
| C | 14 | 254 | 486473 | 3456.12 | 600 | 603 | 140.6 |
| C | 15 | 214 | 228783 | 1623.1 | 600 | 603 | 140.6 |
| C | 0 | 10 | 24295 | 168.53 | 600 | 603 | 140.6 |
| D | 12 | 227 | 5091696 | 43777.23 | 472 | 459 | 116.3 |
| D | 2 | 249 | 1051247 | 9035.25 | 472 | 459 | 116.3 |
| D | 2 | 16 | 529322 | 4547.45 | 472 | 459 | 116.3 |
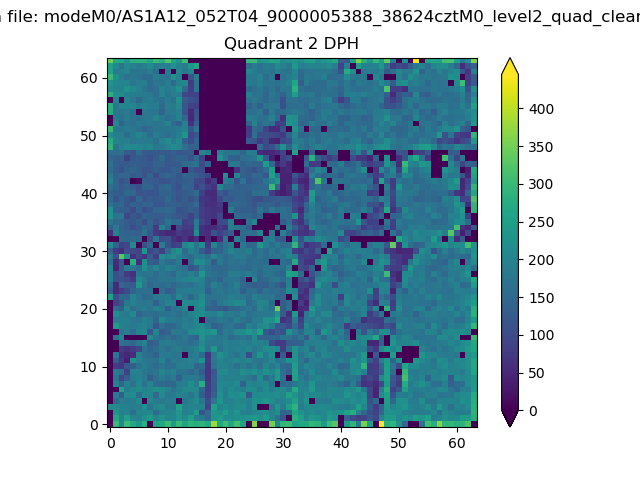
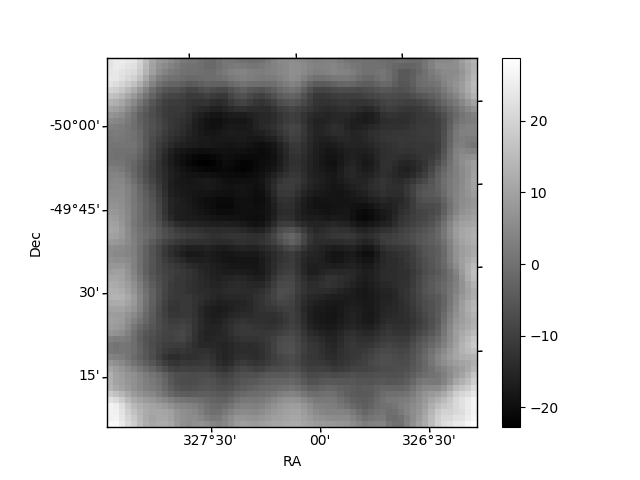
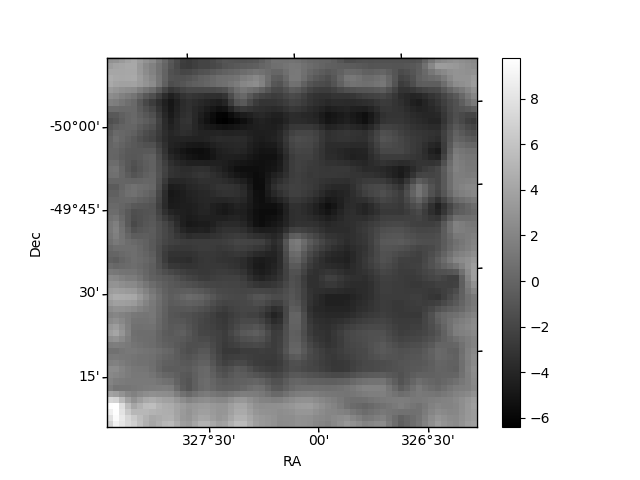
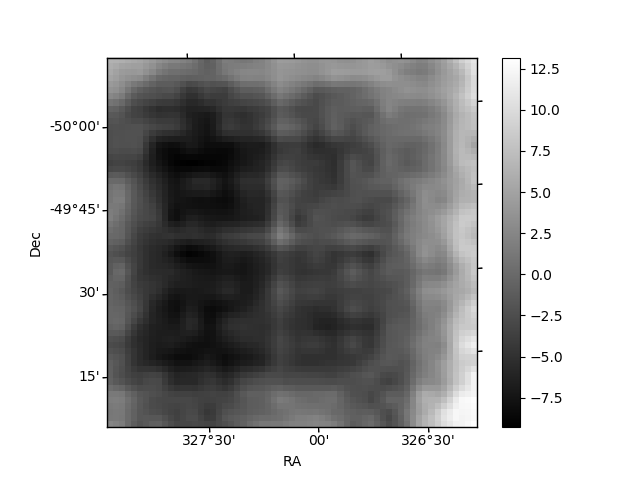
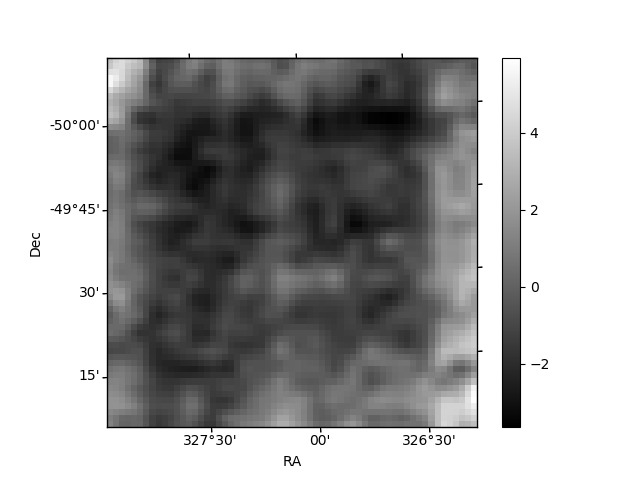
Histogram calculated using DETX and DETY for each event in the final _common_clean file
| Quadrant A | 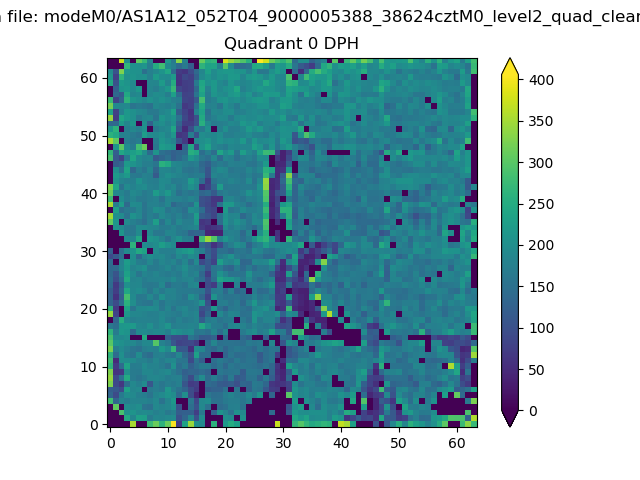 |
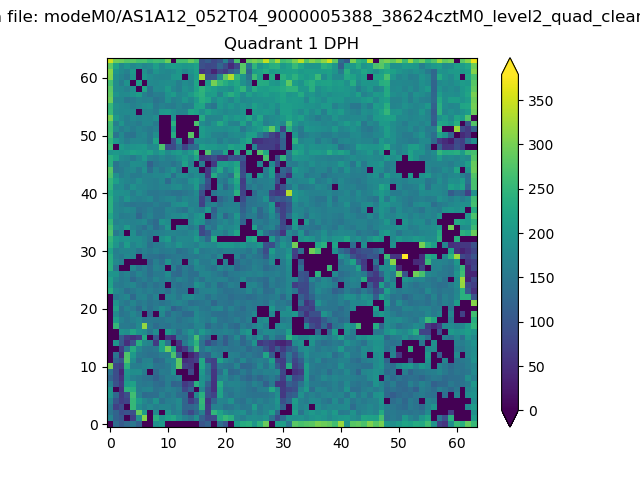 |
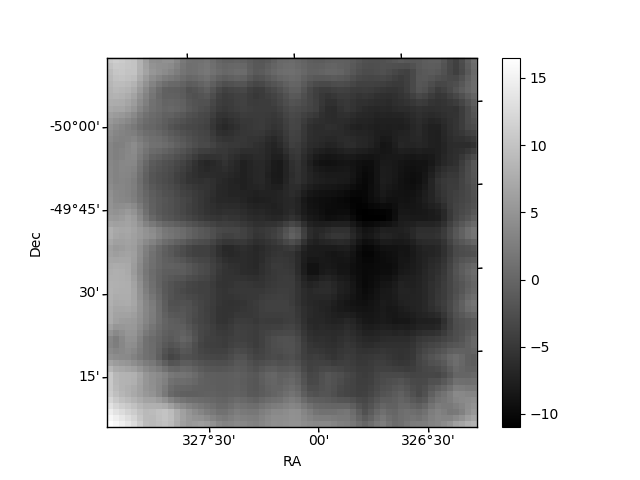
Quadrant B |
|---|---|---|---|
| Quadrant D | 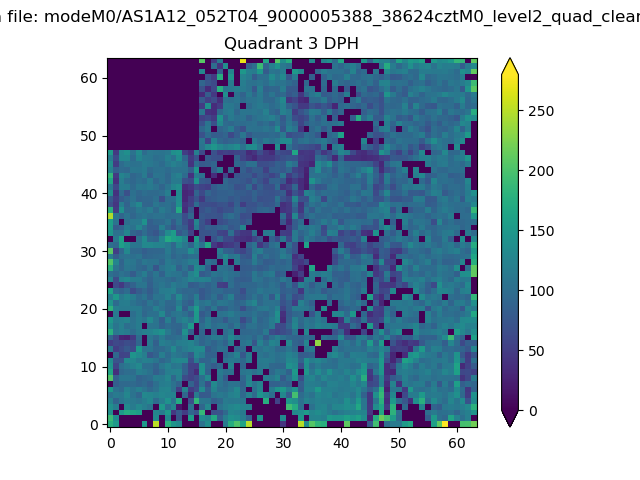 |
 |
Quadrant C |
| Plot type | Count rate plots | Images |
|---|---|---|
| Comparison with Poisson distribution Blue bars denote a histogram of data divided into 1 sec bins. Red curve is a Poisson curve with rate = median count rate of data. |
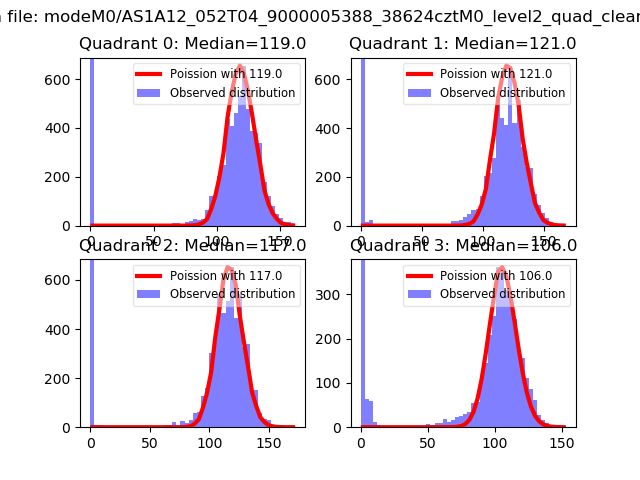 |
 |
| Quadrant-wise count rates Data is divided into 100 sec bins |
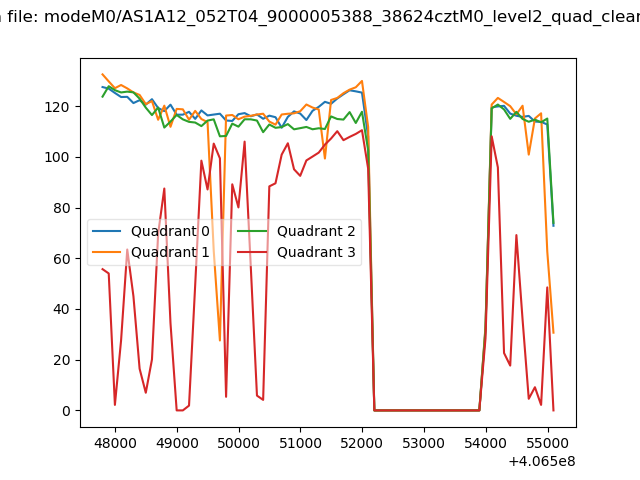 |
|
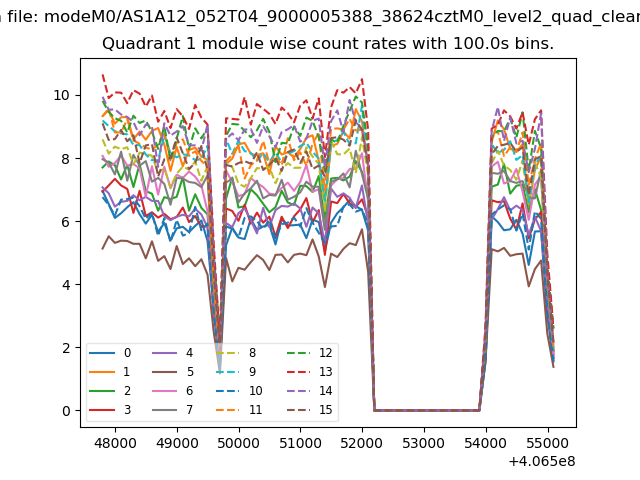
| Module-wise count rates for Quadrant A Data is divided into 100 sec bins |
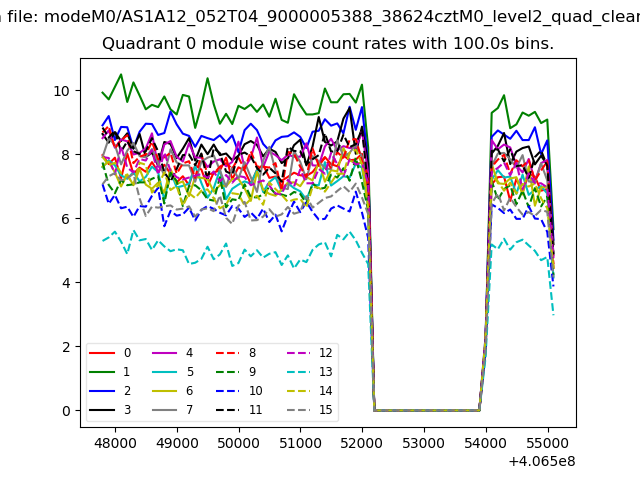 |
 |
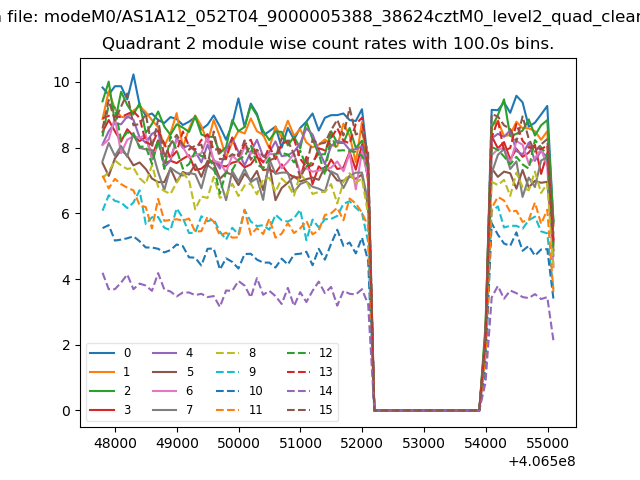
| Module-wise count rates for Quadrant B Data is divided into 100 sec bins |
 |
 |
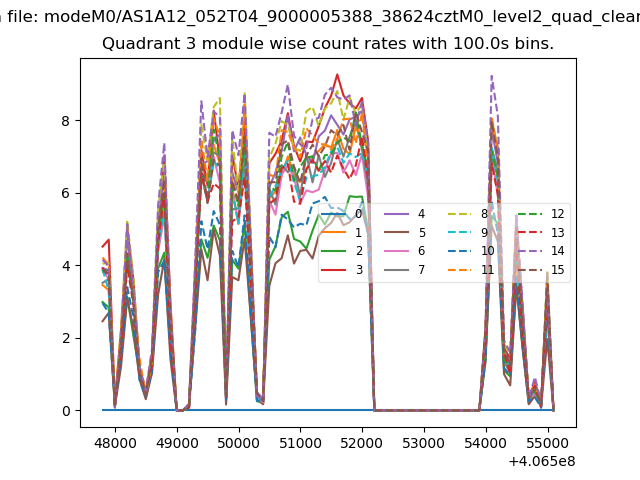
| Module-wise count rates for Quadrant C Data is divided into 100 sec bins |
 |
 |
| Module-wise count rates for Quadrant D Data is divided into 100 sec bins |
 |
 |
| Parameter | Plot |
|---|---|
| CZT HV Monitor | 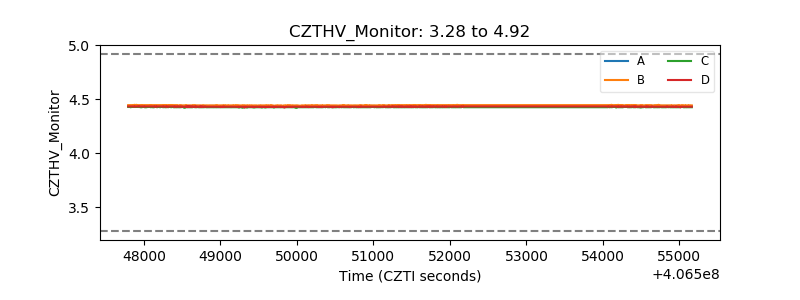 |
| D_VDD | 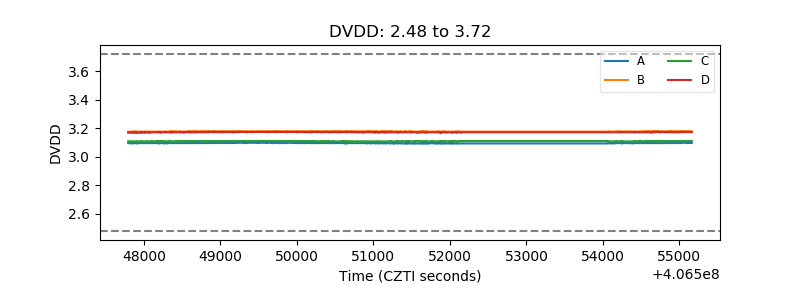 |
| Temperature 1 | 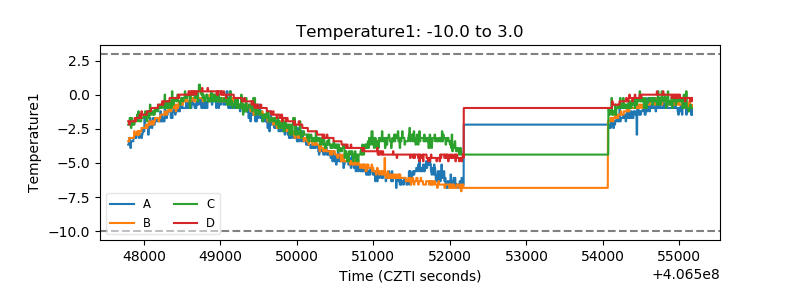 |
| Veto HV Monitor | 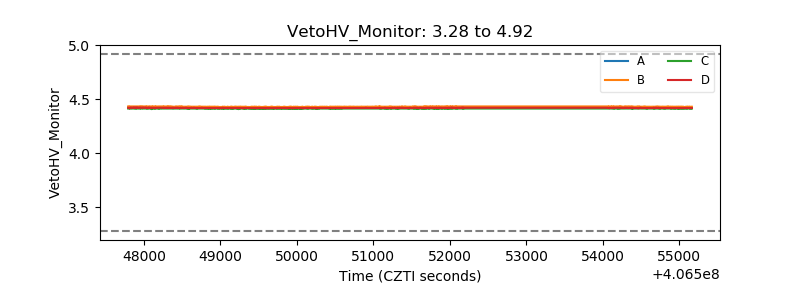 |
| Veto LLD | 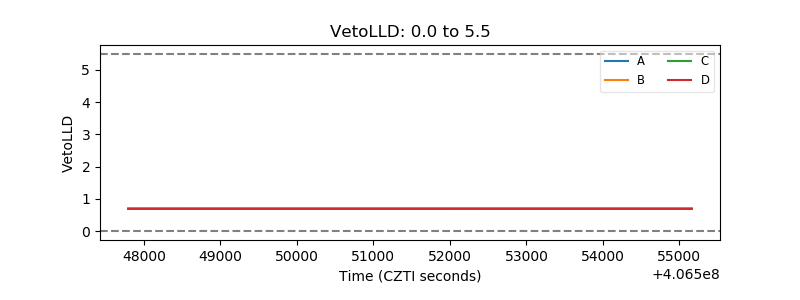 |
| Alpha Counter | 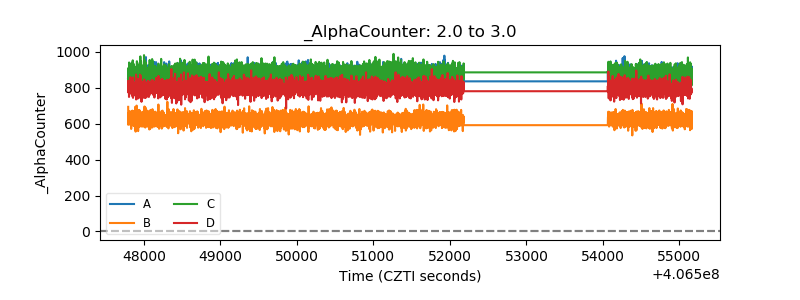 |
| _CPM_Rate | 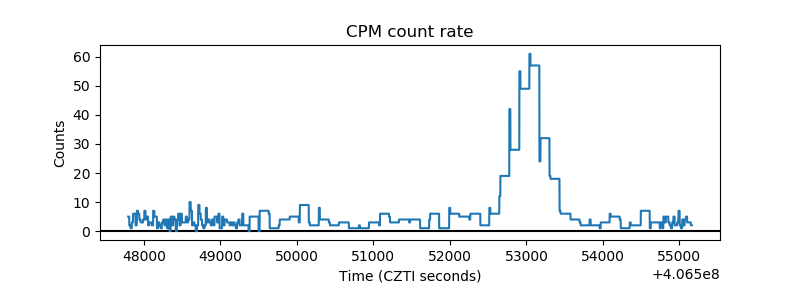 |
| CZT Counter | 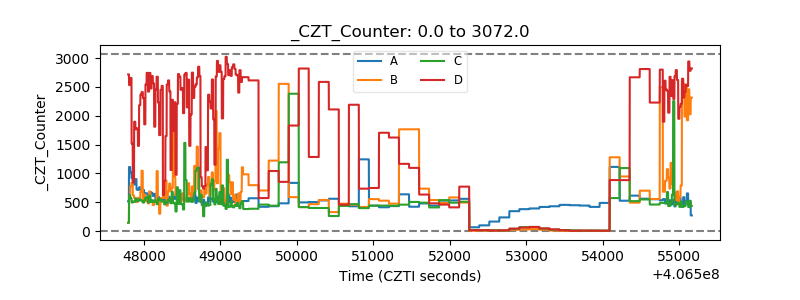 |
| +2.5 Volts monitor | 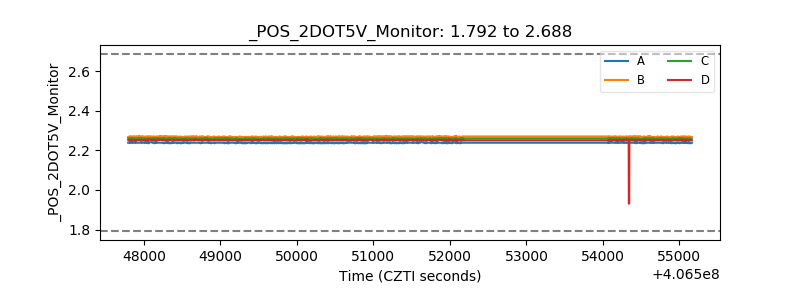 |
| +5 Volts monitor | 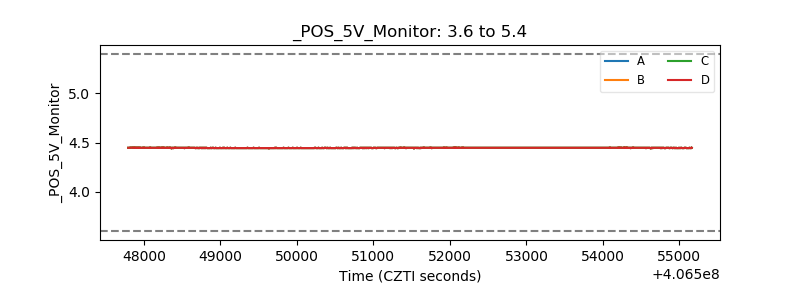 |
| _ROLL_ROT | 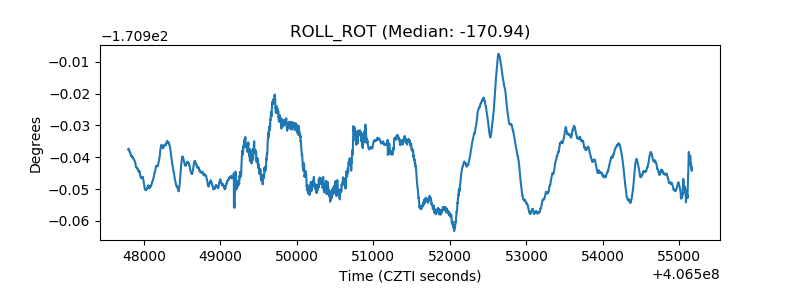 |
| _Roll_DEC | 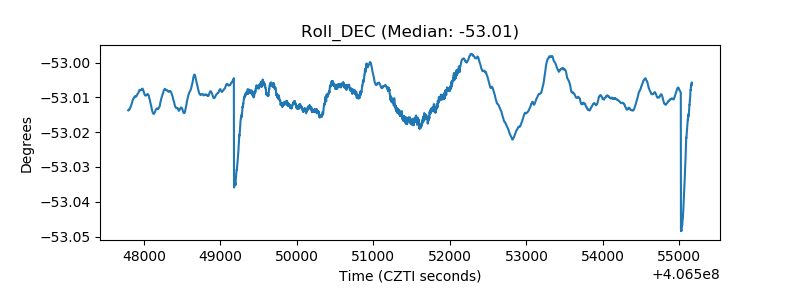 |
| _Roll_RA | 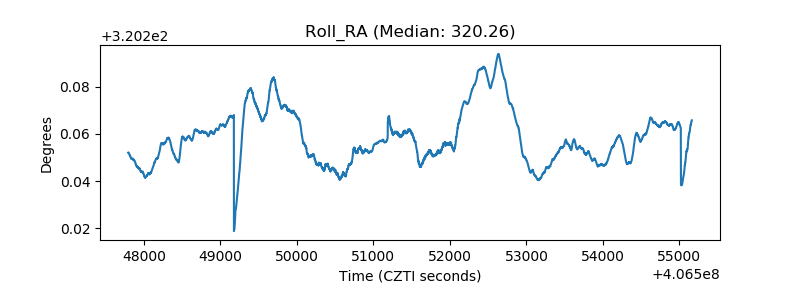 |
| Veto Counter | 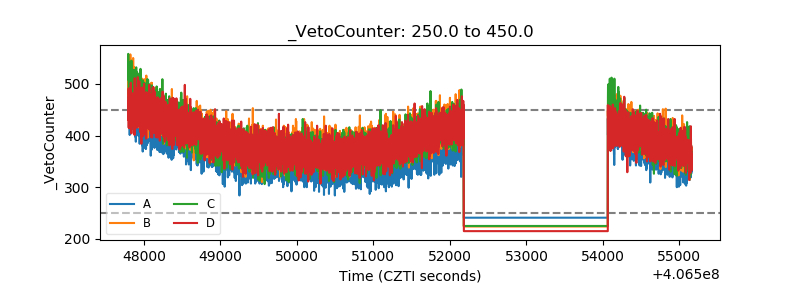 |