| Param | Original file | Final file |
|---|---|---|
| Filename | modeM0/AS1A12_052T04_9000005388_38625cztM0_level2.fits | modeM0/AS1A12_052T04_9000005388_38625cztM0_level2_quad_clean.evt |
| Size (bytes) | 306,221,760 | 41,232,960 |
| Size | 292.0 MB | 39.3 MB |
| Events in quadrant A | 1,460,575 | 321,174 |
| Events in quadrant B | 2,075,816 | 312,011 |
| Events in quadrant C | 1,377,401 | 314,612 |
| Events in quadrant D | 6,201,055 | 99,705 |
| Mode M0 | |||
|---|---|---|---|
| Quadrant | BADHDUFLAG | Total packets | Discarded packets |
| A | 0 | 6103 | 1 |
| B | 0 | 8089 | 1 |
| C | 0 | 6032 | 1 |
| D | 0 | 20274 | 1 |
| Mode SS | |||
|---|---|---|---|
| Quadrant | BADHDUFLAG | Total packets | Discarded packets |
| A | 0 | 56 | 0 |
| B | 0 | 56 | 0 |
| C | 0 | 56 | 0 |
| D | 0 | 56 | 0 |
| Mode M9 | |||
|---|---|---|---|
| Quadrant | BADHDUFLAG | Total packets | Discarded packets |
| A | 0 | 1 | 0 |
| B | 0 | 1 | 0 |
| C | 0 | 1 | 0 |
| D | 0 | 2 | 0 |
| Quadrant | Total seconds | Saturated seconds | Saturation percentage |
|---|---|---|---|
| A | 2814 | 4 | 0.142146% |
| B | 2814 | 151 | 5.366027% |
| C | 2814 | 12 | 0.426439% |
| D | 2814 | 1958 | 69.580668% |
Noise dominated data is calculated using 1-second bins in cleaned event files. If a bin has >2000 counts, and if more than 50% of those come from <1% of pixels, then it is considered to be noise-dominated and hence unusable.
| Quadrant | # 1 sec bins | Bins with >0 counts | Bins with >2000 counts | High rate bins dominated by noise | Noise dominated (total time) | Noise dominated (detector-on time) | Marked lightcurve |
|---|---|---|---|---|---|---|---|
| A | 2814 | 2814 | 1 | 1 | 0.04% | 0.04% | 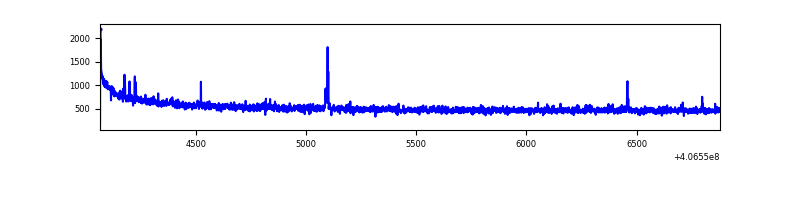 |
| B | 2814 | 2814 | 145 | 145 | 5.15% | 5.15% | 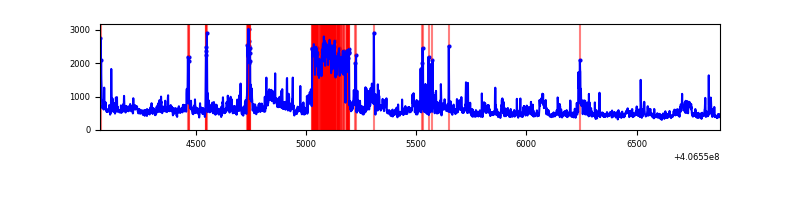 |
| C | 2814 | 2814 | 10 | 10 | 0.36% | 0.36% | 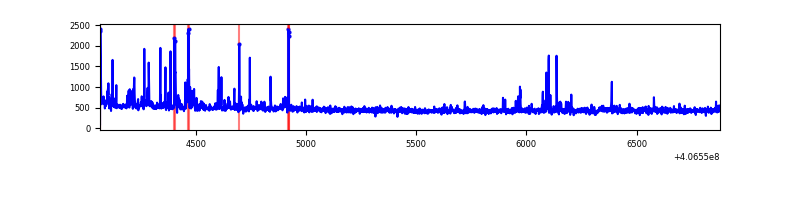 |
| D | 2814 | 2814 | 2012 | 2012 | 71.50% | 71.50% | 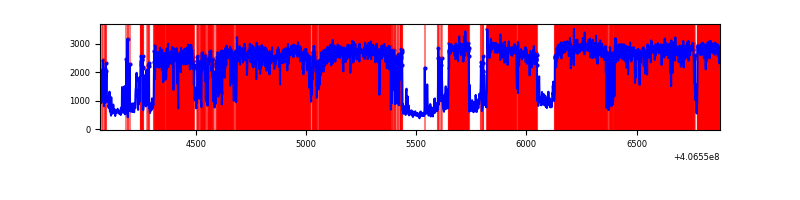 |
Top three noisy pixels from each quadrant. If the there are fewer than three noisy pixels in the level2.evt file, extra rows are filled as -1
| Pixel properties | Quadrant properties | ||||||
|---|---|---|---|---|---|---|---|
| Quadrant | DetID | PixID | Counts | Sigma | Mean | Median | Sigma |
| A | 10 | 83 | 248650 | 3923.51 | 306 | 301 | 63.3 |
| A | 15 | 174 | 9836 | 150.64 | 306 | 301 | 63.3 |
| A | 13 | 6 | 7162 | 108.39 | 306 | 301 | 63.3 |
| B | 4 | 171 | 543363 | 9205.83 | 298 | 290 | 59.0 |
| B | 0 | 183 | 125980 | 2130.62 | 298 | 290 | 59.0 |
| B | 0 | 186 | 60562 | 1021.69 | 298 | 290 | 59.0 |
| C | 15 | 214 | 116188 | 1682.78 | 290 | 292 | 68.9 |
| C | 14 | 254 | 89889 | 1300.92 | 290 | 292 | 68.9 |
| C | 3 | 110 | 15677 | 223.39 | 290 | 292 | 68.9 |
| D | 12 | 227 | 4827333 | 98359.04 | 190 | 184 | 49.1 |
| D | 2 | 16 | 198208 | 4034.98 | 190 | 184 | 49.1 |
| D | 2 | 250 | 140093 | 2850.82 | 190 | 184 | 49.1 |
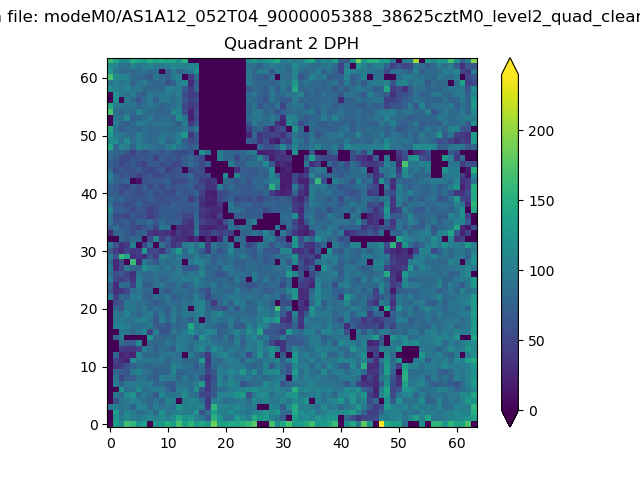
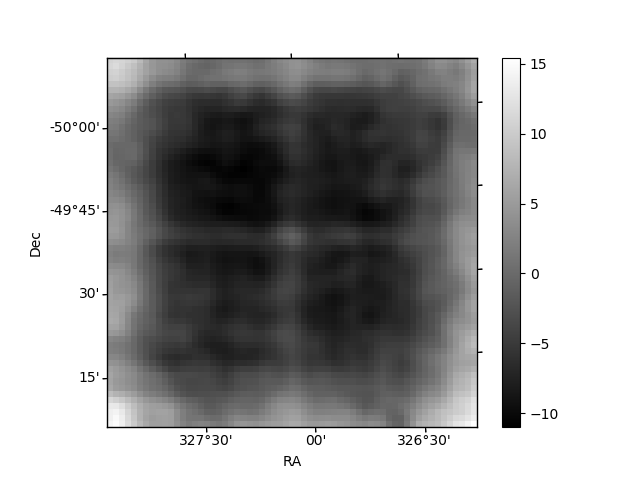
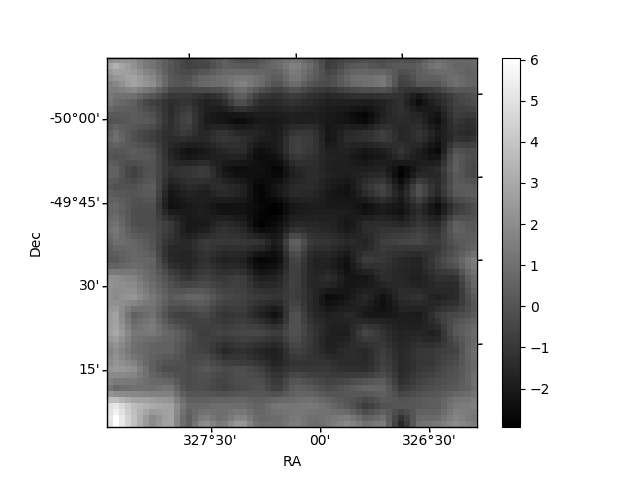
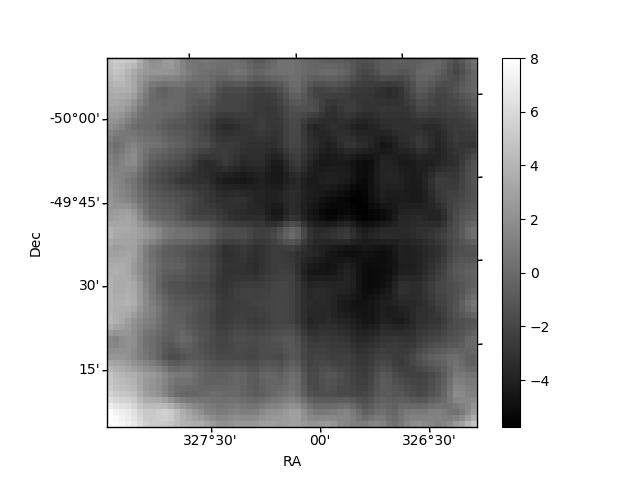
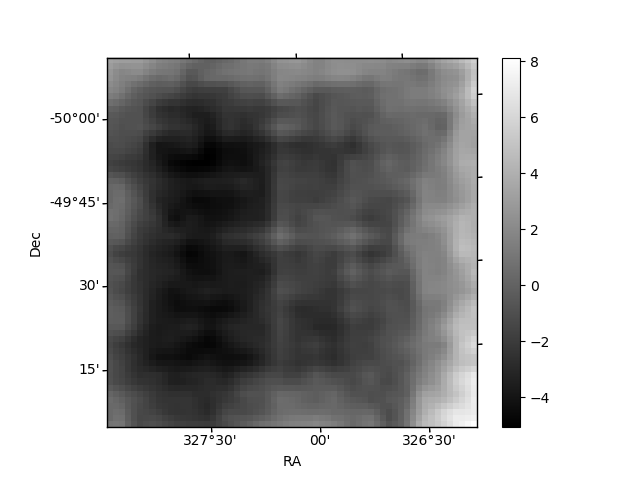
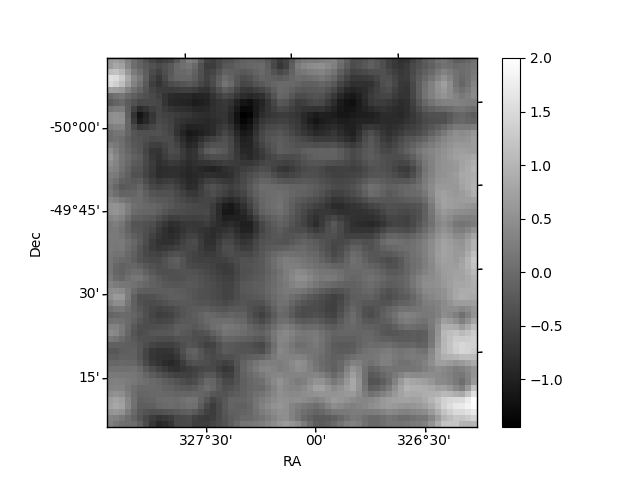
Histogram calculated using DETX and DETY for each event in the final _common_clean file
| Quadrant A | 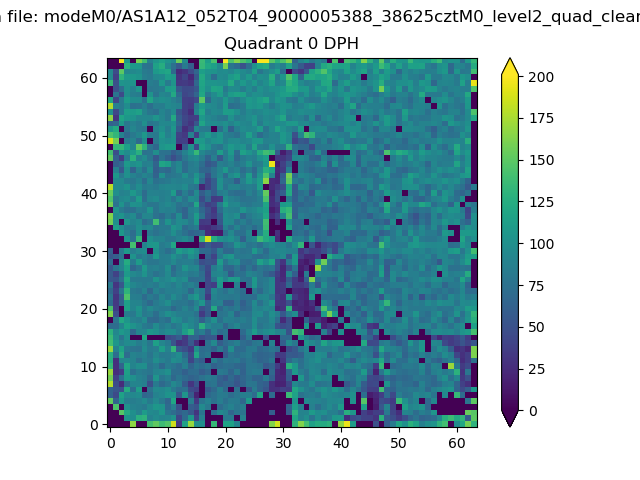 |
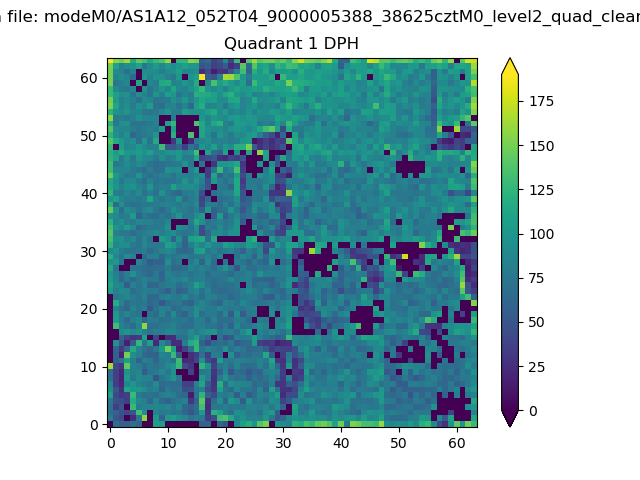 |
Quadrant B |
|---|---|---|---|
| Quadrant D | 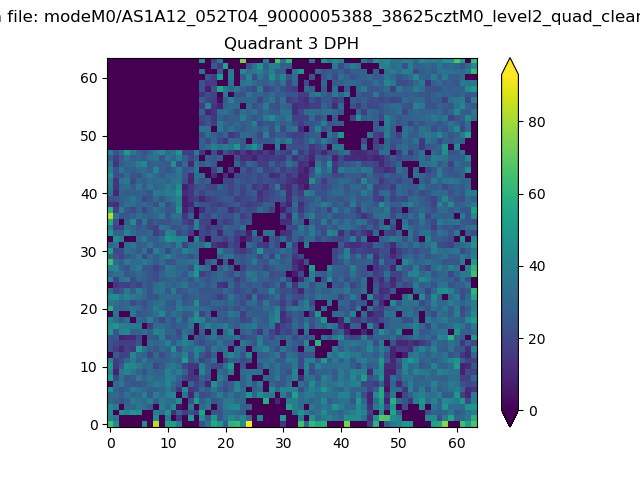 |
 |
Quadrant C |
| Plot type | Count rate plots | Images |
|---|---|---|
| Comparison with Poisson distribution Blue bars denote a histogram of data divided into 1 sec bins. Red curve is a Poisson curve with rate = median count rate of data. |
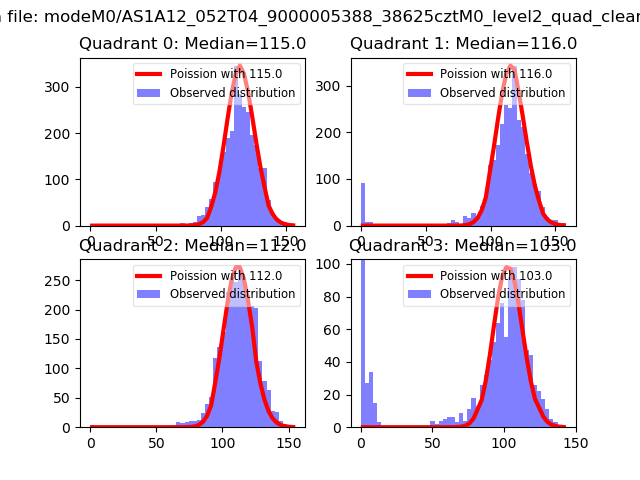 |
 |
| Quadrant-wise count rates Data is divided into 100 sec bins |
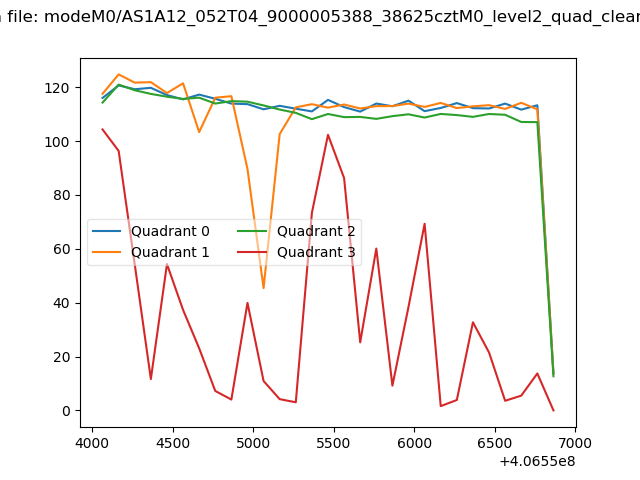 |
|
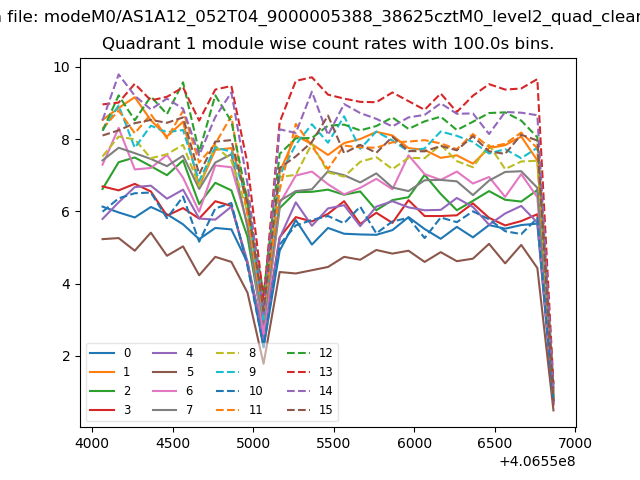
| Module-wise count rates for Quadrant A Data is divided into 100 sec bins |
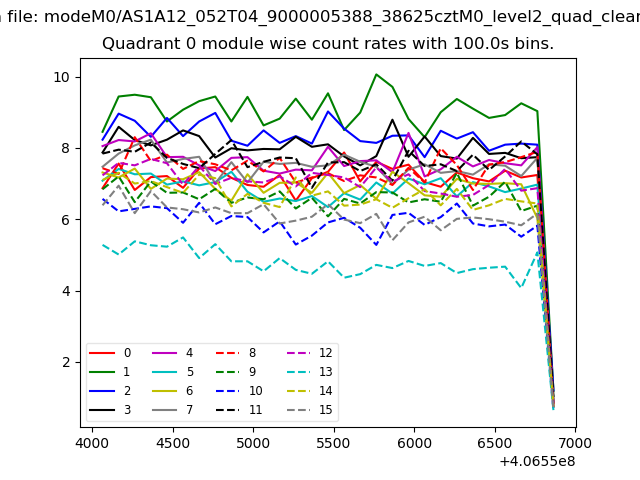 |
 |
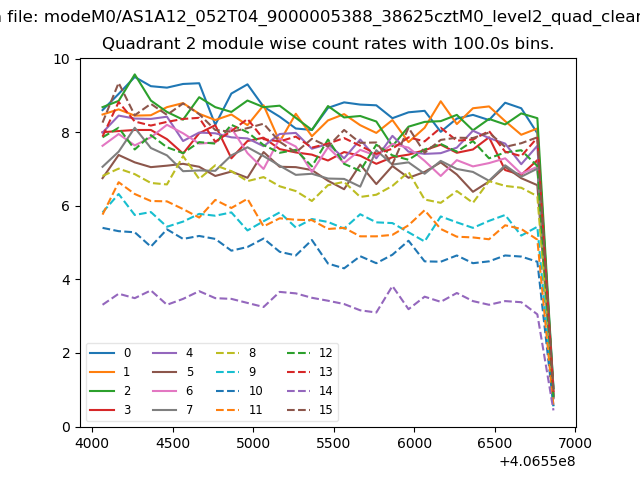
| Module-wise count rates for Quadrant B Data is divided into 100 sec bins |
 |
 |
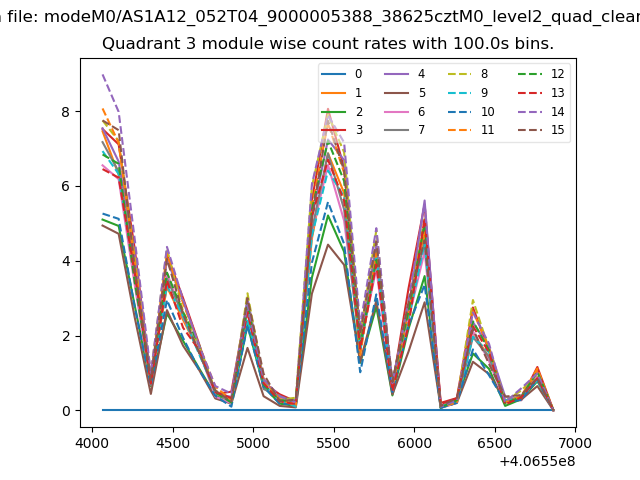
| Module-wise count rates for Quadrant C Data is divided into 100 sec bins |
 |
 |
| Module-wise count rates for Quadrant D Data is divided into 100 sec bins |
 |
 |
| Parameter | Plot |
|---|---|
| CZT HV Monitor | 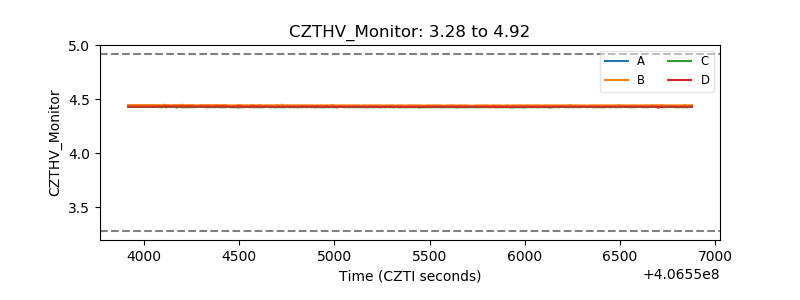 |
| D_VDD | 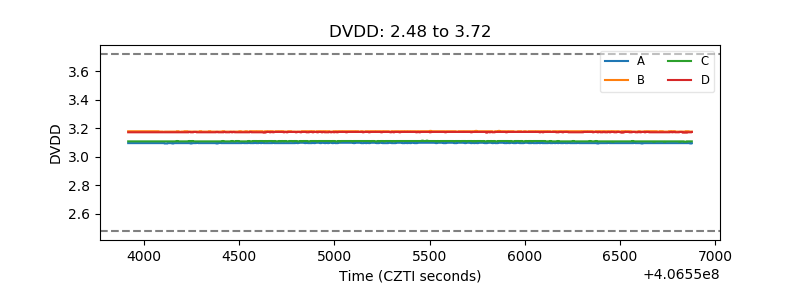 |
| Temperature 1 | 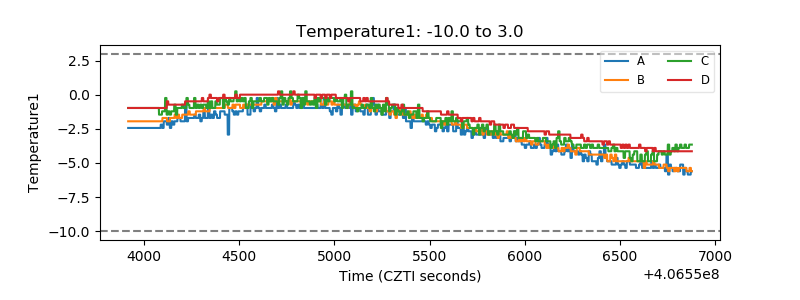 |
| Veto HV Monitor | 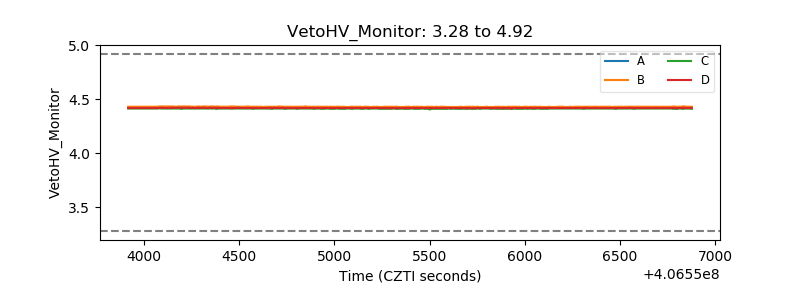 |
| Veto LLD | 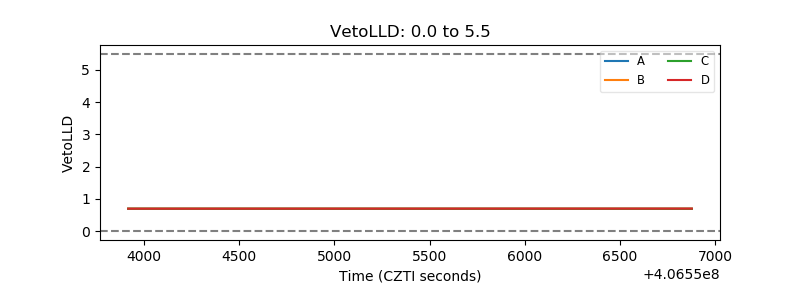 |
| Alpha Counter | 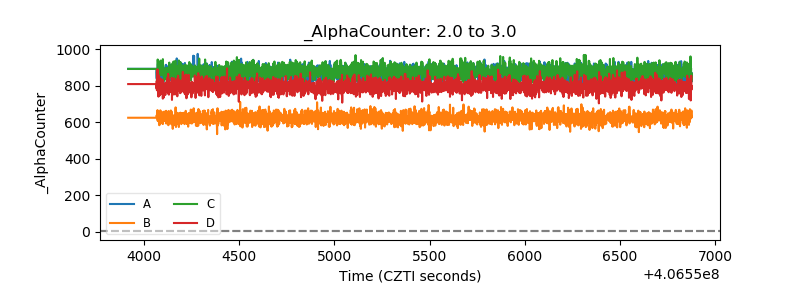 |
| _CPM_Rate | 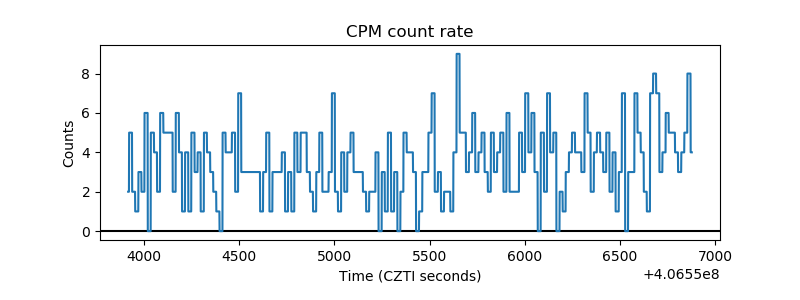 |
| CZT Counter | 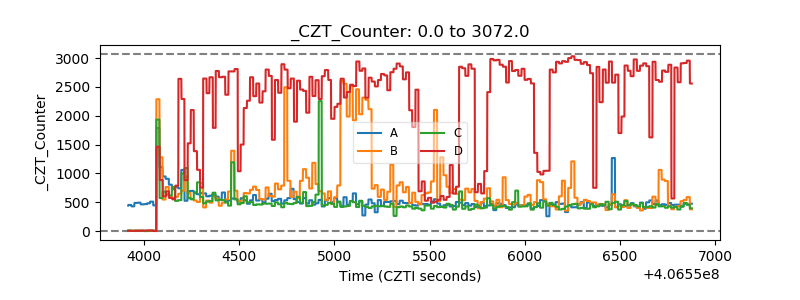 |
| +2.5 Volts monitor | 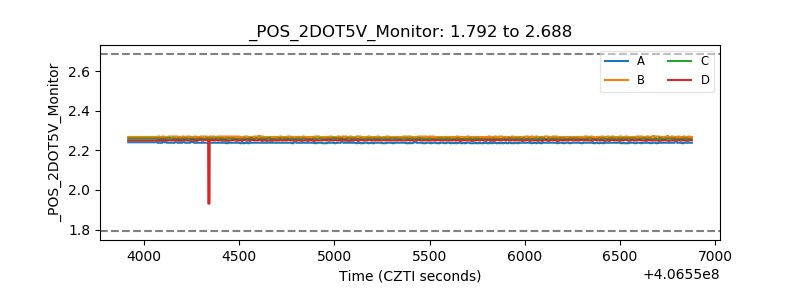 |
| +5 Volts monitor |  |
| _ROLL_ROT | 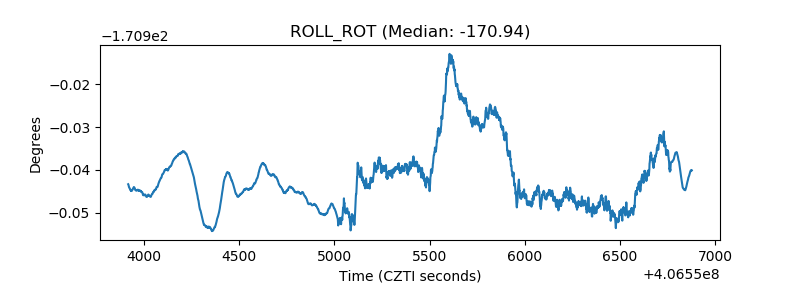 |
| _Roll_DEC | 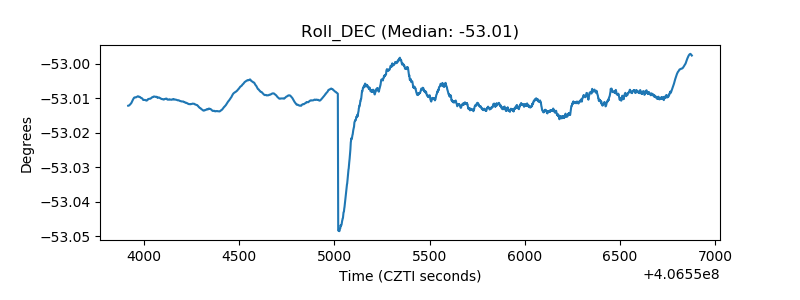 |
| _Roll_RA | 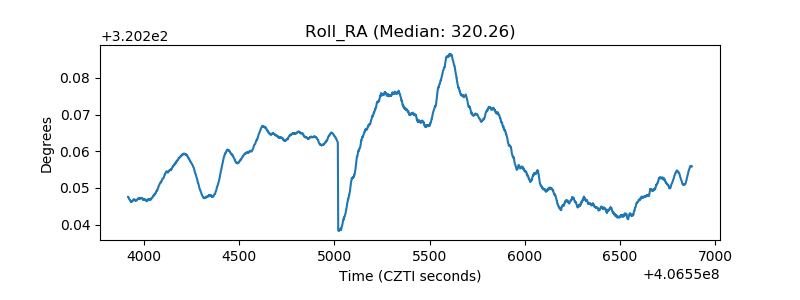 |
| Veto Counter | 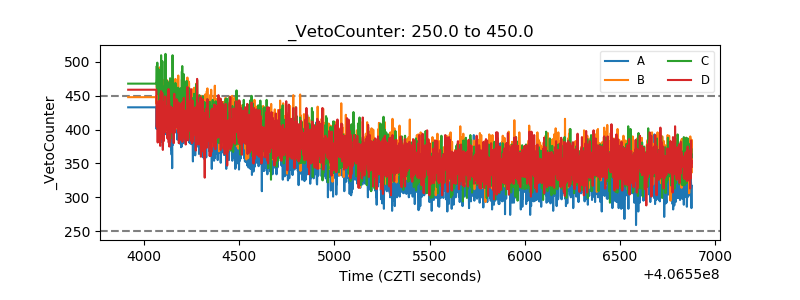 |