| Param | Original file | Final file |
|---|---|---|
| Filename | modeM0/AS1A12_061T03_9000005390_38625cztM0_level2.fits | modeM0/AS1A12_061T03_9000005390_38625cztM0_level2_quad_clean.evt |
| Size (bytes) | 159,252,480 | 33,163,200 |
| Size | 151.9 MB | 31.6 MB |
| Events in quadrant A | 1,092,684 | 228,570 |
| Events in quadrant B | 1,311,558 | 230,561 |
| Events in quadrant C | 993,882 | 225,054 |
| Events in quadrant D | 2,340,978 | 176,825 |
| Mode SS | |||
|---|---|---|---|
| Quadrant | BADHDUFLAG | Total packets | Discarded packets |
| A | 0 | 40 | 0 |
| B | 0 | 40 | 0 |
| C | 0 | 40 | 0 |
| D | 0 | 40 | 0 |
| Mode M9 | |||
|---|---|---|---|
| Quadrant | BADHDUFLAG | Total packets | Discarded packets |
| A | 0 | 16 | 0 |
| B | 0 | 16 | 0 |
| C | 0 | 16 | 0 |
| D | 0 | 16 | 0 |
| Mode M0 | |||
|---|---|---|---|
| Quadrant | BADHDUFLAG | Total packets | Discarded packets |
| A | 0 | 4375 | 2 |
| B | 0 | 5168 | 1 |
| C | 0 | 4058 | 1 |
| D | 0 | 8308 | 1 |
| Quadrant | Total seconds | Saturated seconds | Saturation percentage |
|---|---|---|---|
| A | 1976 | 8 | 0.404858% |
| B | 1976 | 41 | 2.074899% |
| C | 1976 | 2 | 0.101215% |
| D | 1976 | 402 | 20.344130% |
Noise dominated data is calculated using 1-second bins in cleaned event files. If a bin has >2000 counts, and if more than 50% of those come from <1% of pixels, then it is considered to be noise-dominated and hence unusable.
| Quadrant | # 1 sec bins | Bins with >0 counts | Bins with >2000 counts | High rate bins dominated by noise | Noise dominated (total time) | Noise dominated (detector-on time) | Marked lightcurve |
|---|---|---|---|---|---|---|---|
| A | 3529 | 1977 | 5 | 5 | 0.14% | 0.25% | 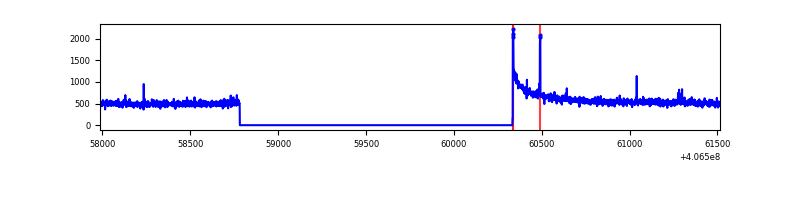 |
| B | 3529 | 1977 | 22 | 22 | 0.62% | 1.11% | 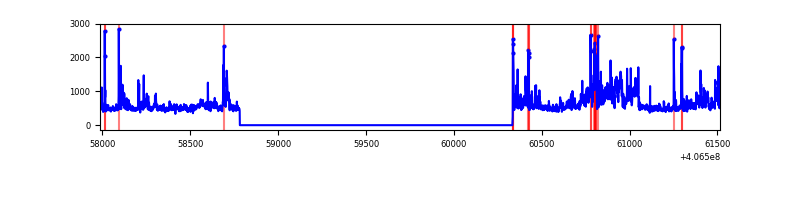 |
| C | 3529 | 1977 | 0 | 0 | 0.00% | 0.00% | 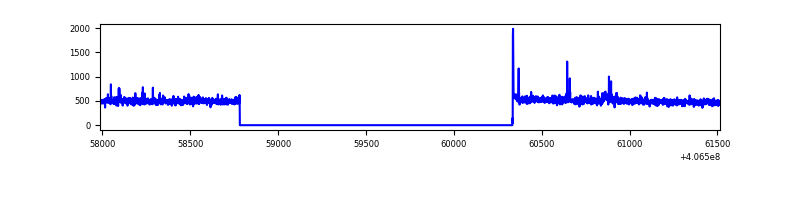 |
| D | 3529 | 1977 | 382 | 382 | 10.82% | 19.32% | 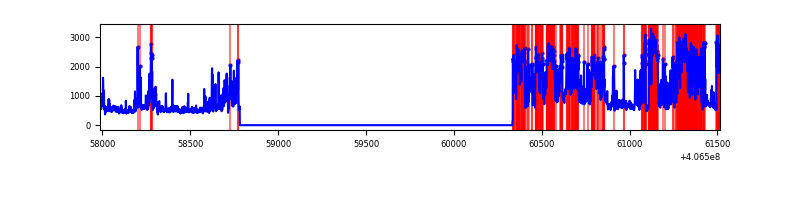 |
Top three noisy pixels from each quadrant. If the there are fewer than three noisy pixels in the level2.evt file, extra rows are filled as -1
| Pixel properties | Quadrant properties | ||||||
|---|---|---|---|---|---|---|---|
| Quadrant | DetID | PixID | Counts | Sigma | Mean | Median | Sigma |
| A | 10 | 83 | 179079 | 3688.0 | 230 | 226 | 48.5 |
| A | 13 | 6 | 7356 | 147.02 | 230 | 226 | 48.5 |
| A | 9 | 143 | 6575 | 130.92 | 230 | 226 | 48.5 |
| B | 4 | 171 | 213342 | 4607.92 | 228 | 221 | 46.3 |
| B | 5 | 184 | 86074 | 1856.24 | 228 | 221 | 46.3 |
| B | 0 | 183 | 37213 | 799.81 | 228 | 221 | 46.3 |
| C | 15 | 214 | 81989 | 1511.32 | 227 | 228 | 54.1 |
| C | 14 | 254 | 18452 | 336.86 | 227 | 228 | 54.1 |
| C | 0 | 10 | 5519 | 97.8 | 227 | 228 | 54.1 |
| D | 12 | 227 | 1082551 | 20330.9 | 211 | 204 | 53.2 |
| D | 2 | 16 | 138816 | 2603.7 | 211 | 204 | 53.2 |
| D | 5 | 222 | 120746 | 2264.27 | 211 | 204 | 53.2 |
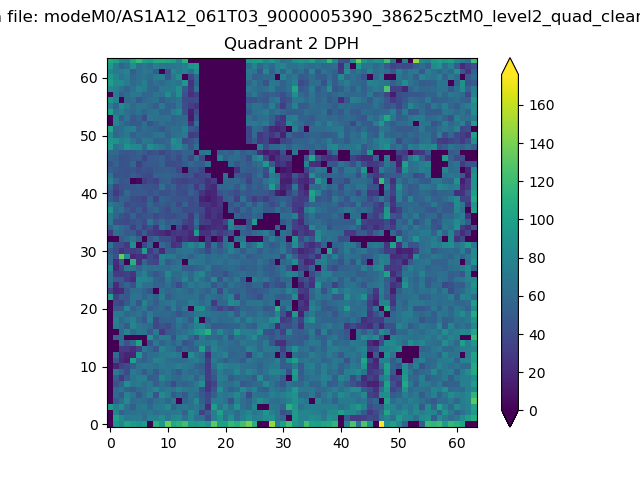
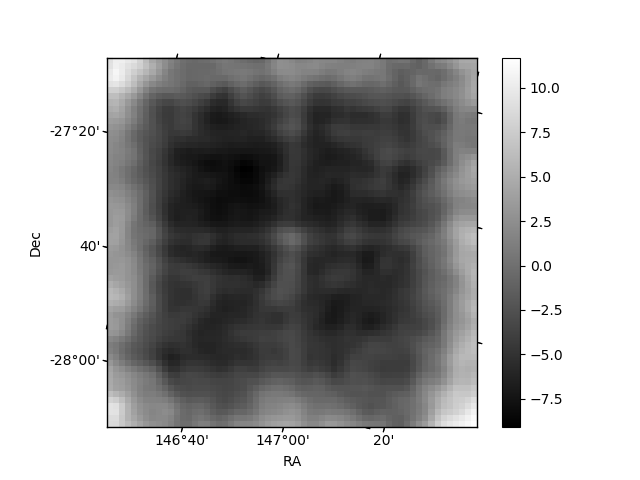
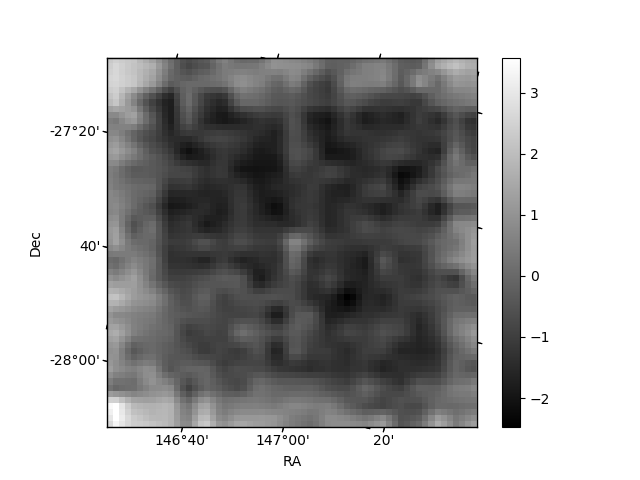
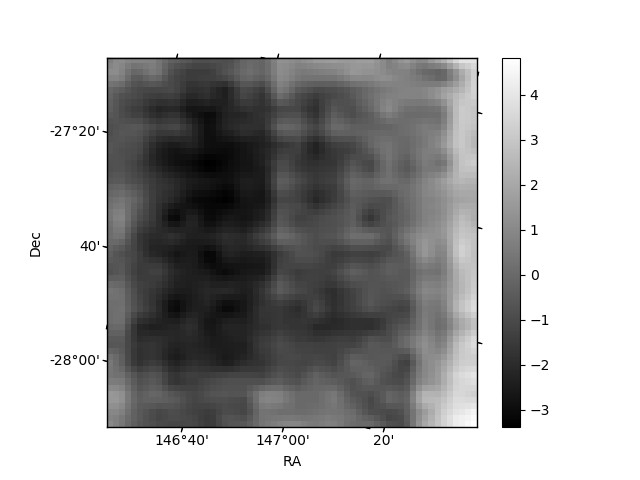
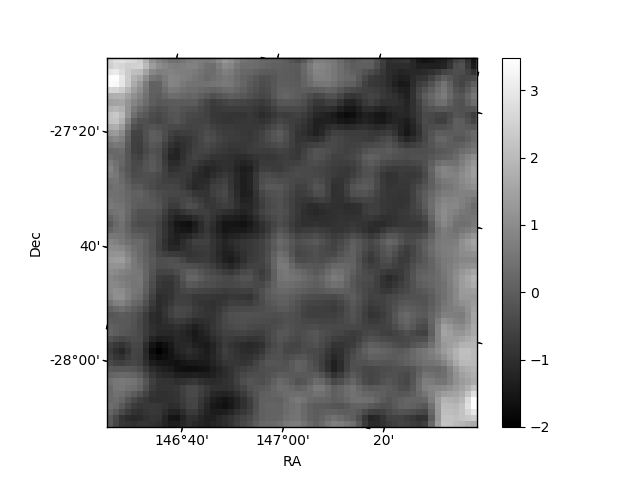
Histogram calculated using DETX and DETY for each event in the final _common_clean file
| Quadrant A | 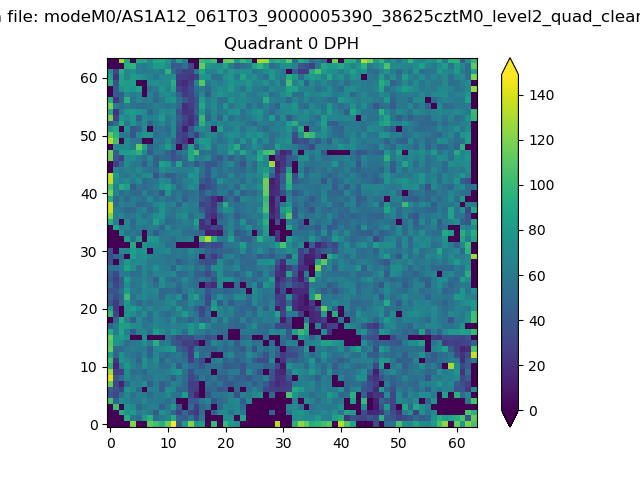 |
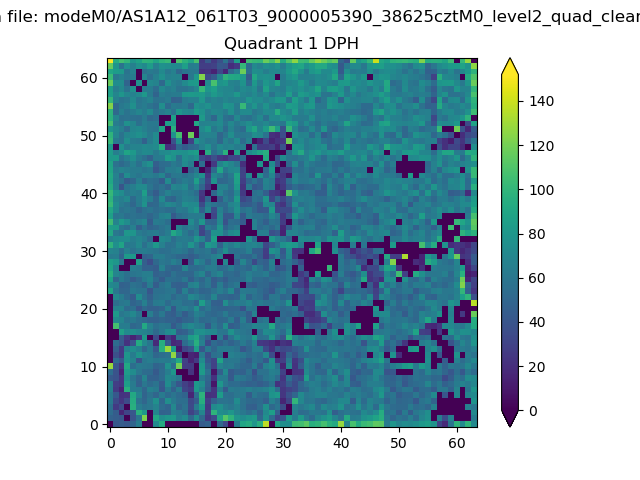 |
Quadrant B |
|---|---|---|---|
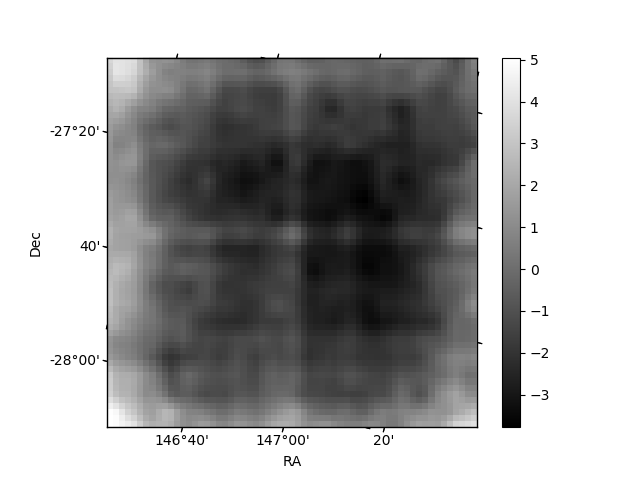
| Quadrant D | 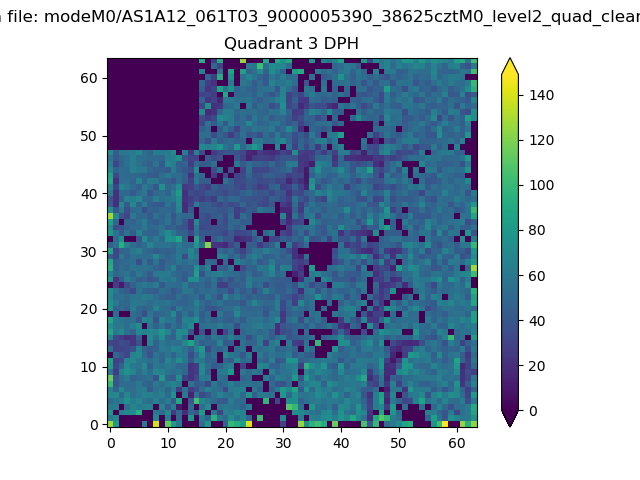 |
 |
Quadrant C |
| Plot type | Count rate plots | Images |
|---|---|---|
| Comparison with Poisson distribution Blue bars denote a histogram of data divided into 1 sec bins. Red curve is a Poisson curve with rate = median count rate of data. |
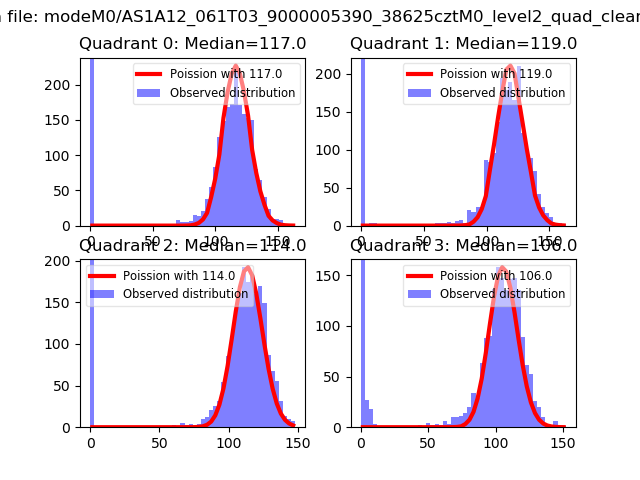 |
 |
| Quadrant-wise count rates Data is divided into 100 sec bins |
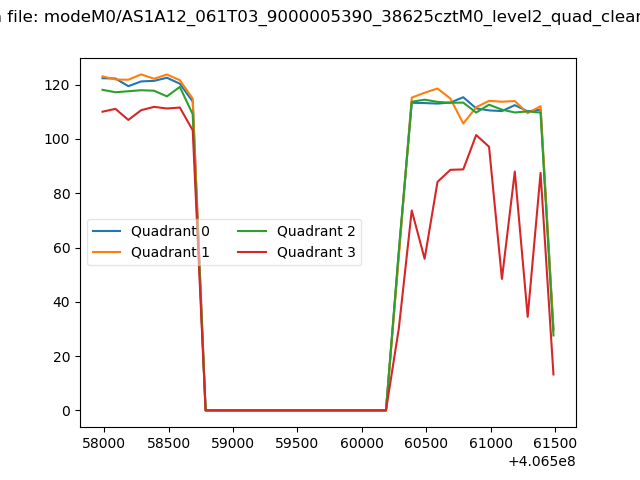 |
|
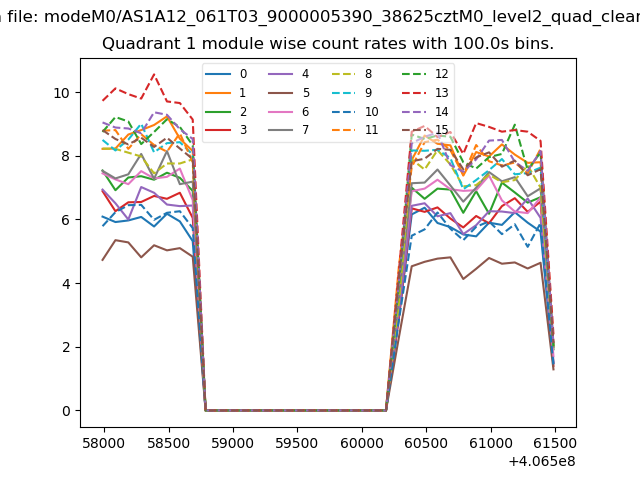
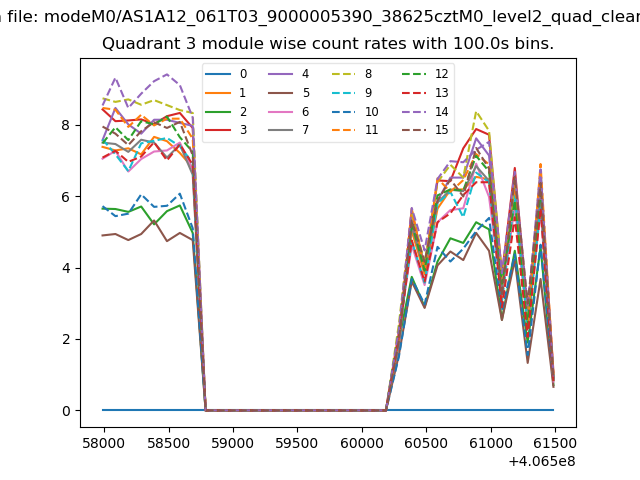
| Module-wise count rates for Quadrant A Data is divided into 100 sec bins |
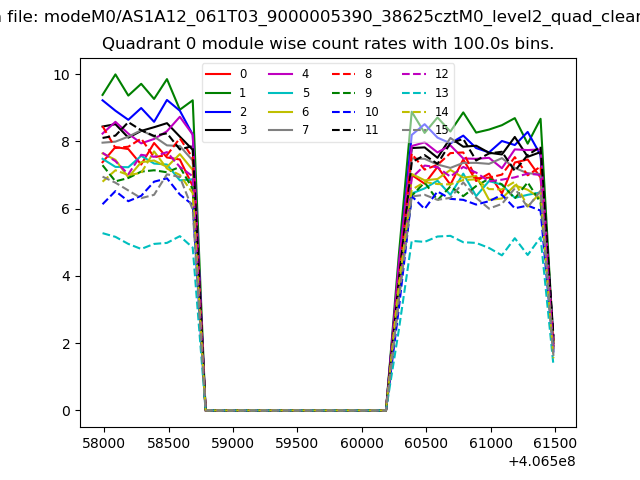 |
 |
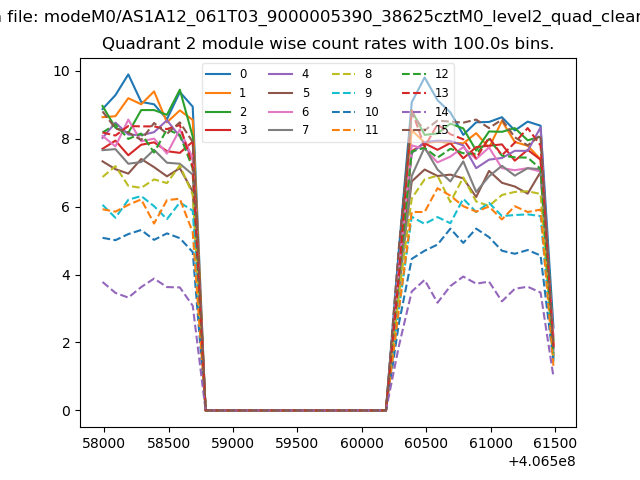
| Module-wise count rates for Quadrant B Data is divided into 100 sec bins |
 |
 |
| Module-wise count rates for Quadrant C Data is divided into 100 sec bins |
 |
 |
| Module-wise count rates for Quadrant D Data is divided into 100 sec bins |
 |
 |
| Parameter | Plot |
|---|---|
| CZT HV Monitor | 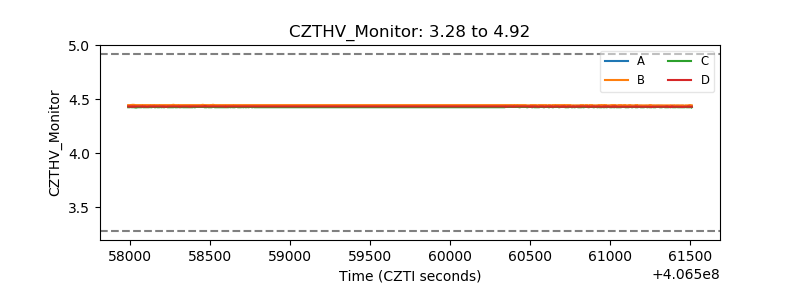 |
| D_VDD | 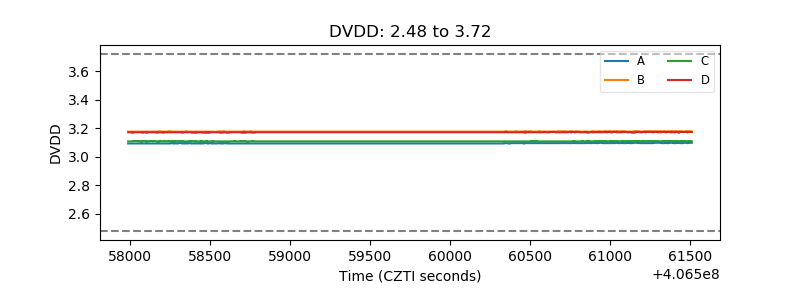 |
| Temperature 1 | 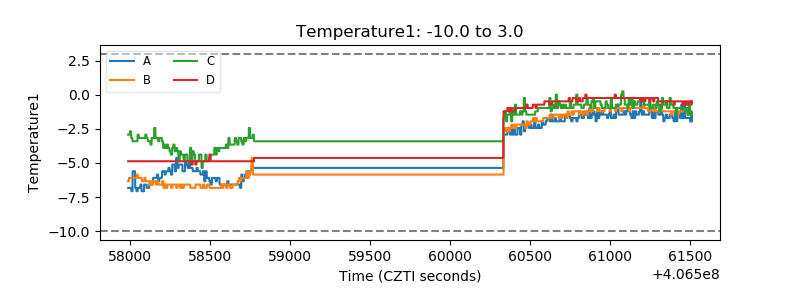 |
| Veto HV Monitor | 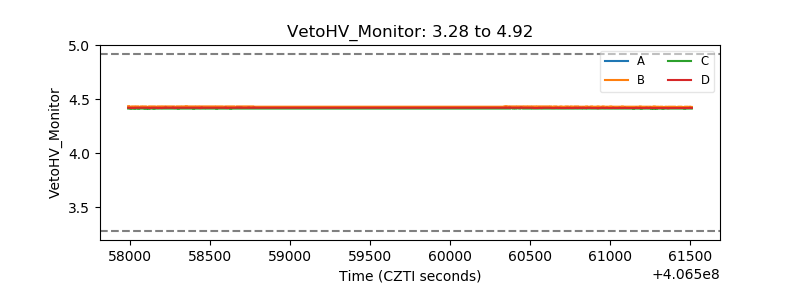 |
| Veto LLD | 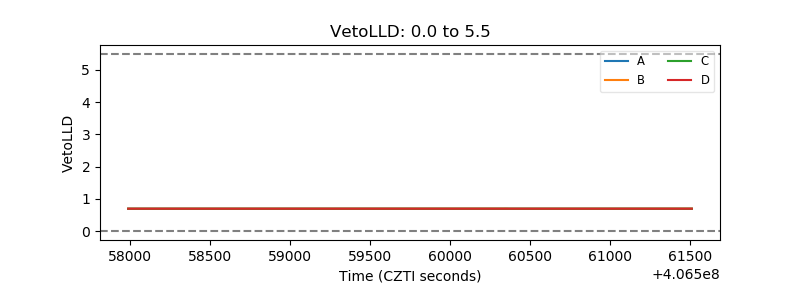 |
| Alpha Counter | 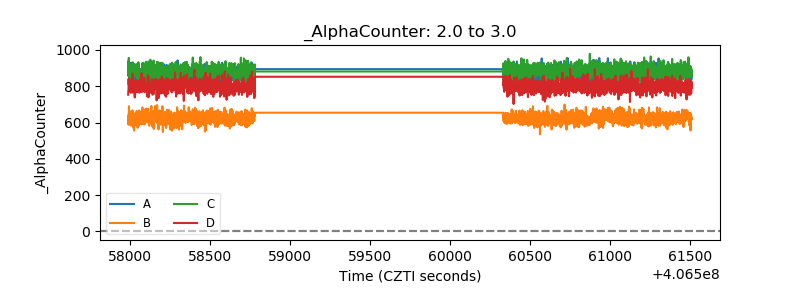 |
| _CPM_Rate | 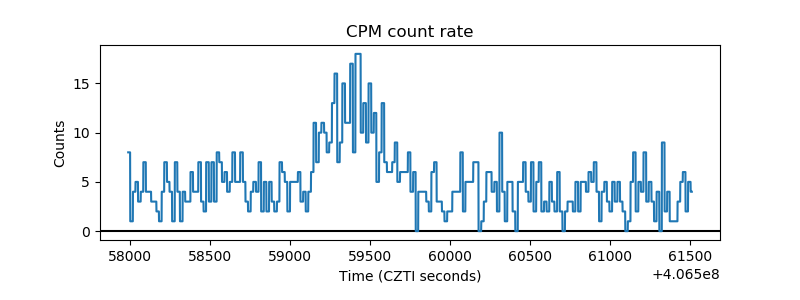 |
| CZT Counter | 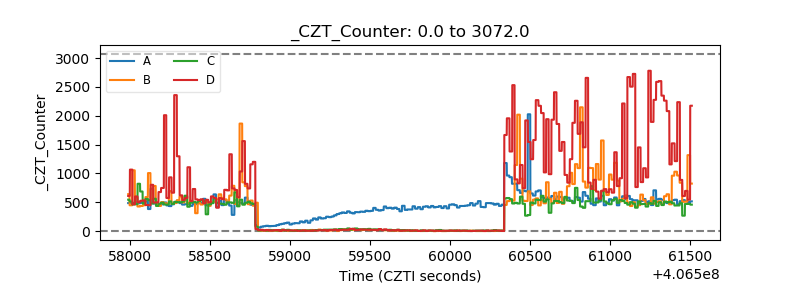 |
| +2.5 Volts monitor | 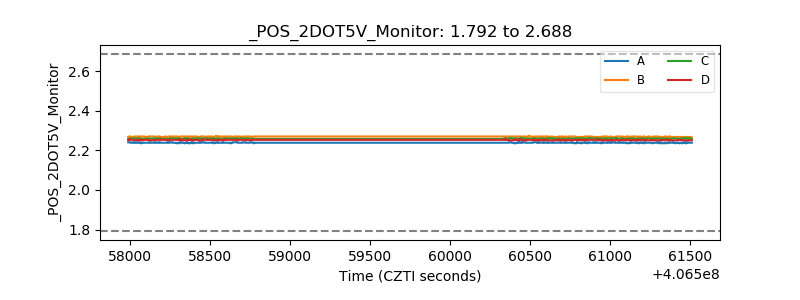 |
| +5 Volts monitor | 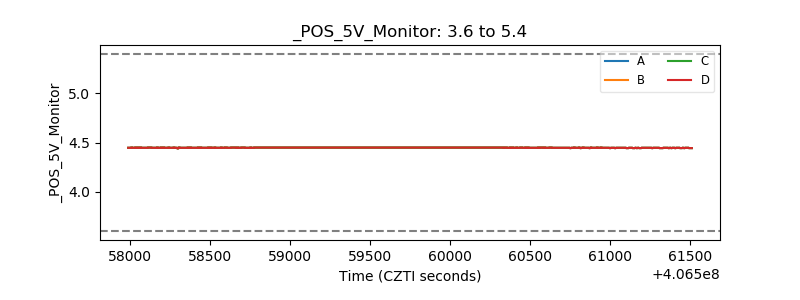 |
| _ROLL_ROT | 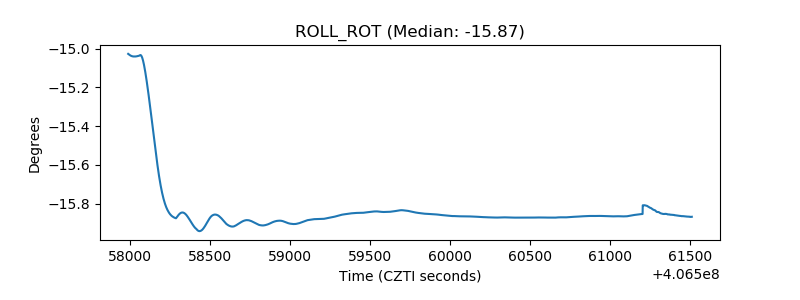 |
| _Roll_DEC | 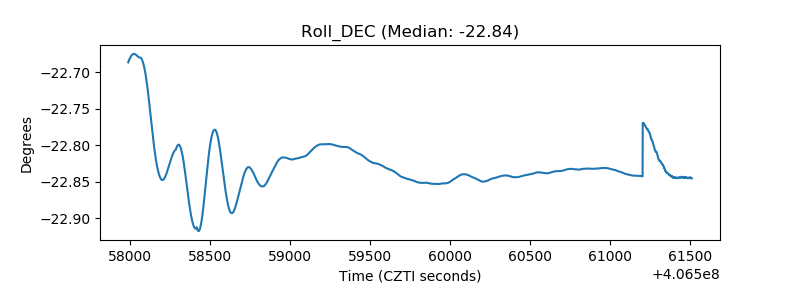 |
| _Roll_RA | 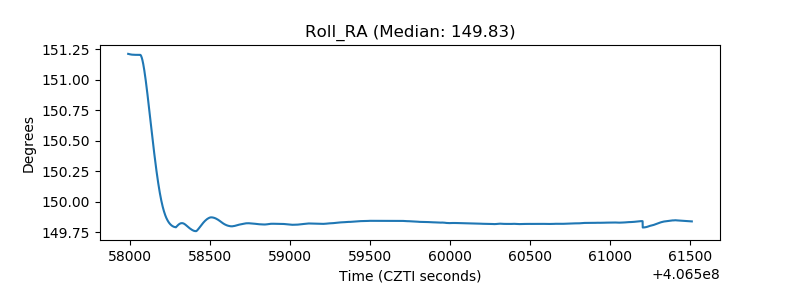 |
| Veto Counter | 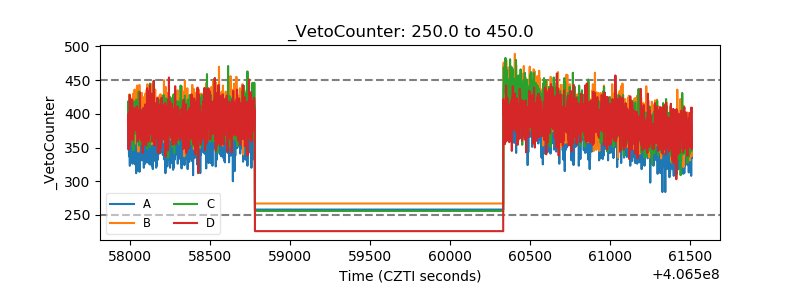 |