| Param | Original file | Final file |
|---|---|---|
| Filename | modeM0/AS1A12_061T03_9000005390_38626cztM0_level2.fits | modeM0/AS1A12_061T03_9000005390_38626cztM0_level2_quad_clean.evt |
| Size (bytes) | 632,704,320 | 88,721,280 |
| Size | 603.4 MB | 84.6 MB |
| Events in quadrant A | 3,305,868 | 681,347 |
| Events in quadrant B | 3,502,877 | 690,753 |
| Events in quadrant C | 3,098,460 | 672,413 |
| Events in quadrant D | 13,043,687 | 219,403 |
| Mode SS | |||
|---|---|---|---|
| Quadrant | BADHDUFLAG | Total packets | Discarded packets |
| A | 0 | 124 | 0 |
| B | 0 | 124 | 0 |
| C | 0 | 124 | 0 |
| D | 0 | 124 | 0 |
| Mode M9 | |||
|---|---|---|---|
| Quadrant | BADHDUFLAG | Total packets | Discarded packets |
| A | 0 | 19 | 0 |
| B | 0 | 19 | 0 |
| C | 0 | 19 | 0 |
| D | 0 | 20 | 0 |
| Mode M0 | |||
|---|---|---|---|
| Quadrant | BADHDUFLAG | Total packets | Discarded packets |
| A | 0 | 13299 | 3 |
| B | 0 | 14297 | 2 |
| C | 0 | 12748 | 2 |
| D | 0 | 42659 | 2 |
| Quadrant | Total seconds | Saturated seconds | Saturation percentage |
|---|---|---|---|
| A | 6045 | 38 | 0.628619% |
| B | 6045 | 68 | 1.124897% |
| C | 6045 | 42 | 0.694789% |
| D | 6045 | 4124 | 68.221671% |
Noise dominated data is calculated using 1-second bins in cleaned event files. If a bin has >2000 counts, and if more than 50% of those come from <1% of pixels, then it is considered to be noise-dominated and hence unusable.
| Quadrant | # 1 sec bins | Bins with >0 counts | Bins with >2000 counts | High rate bins dominated by noise | Noise dominated (total time) | Noise dominated (detector-on time) | Marked lightcurve |
|---|---|---|---|---|---|---|---|
| A | 7387 | 6046 | 26 | 26 | 0.35% | 0.43% | 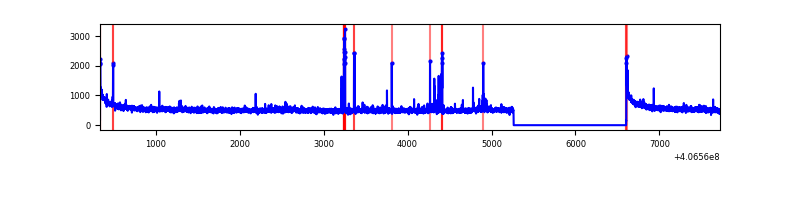 |
| B | 7387 | 6046 | 37 | 37 | 0.50% | 0.61% | 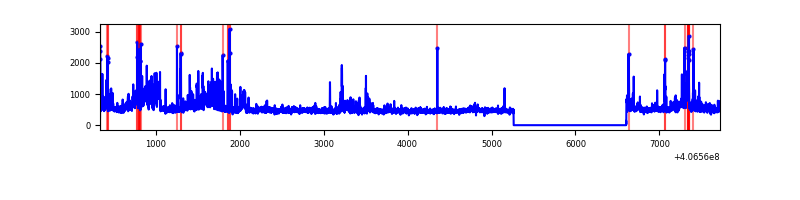 |
| C | 7387 | 6046 | 36 | 36 | 0.49% | 0.60% | 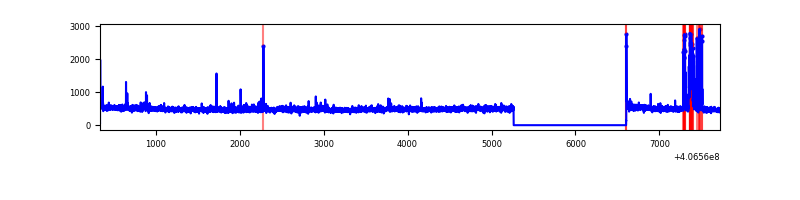 |
| D | 7387 | 6046 | 4070 | 4070 | 55.10% | 67.32% | 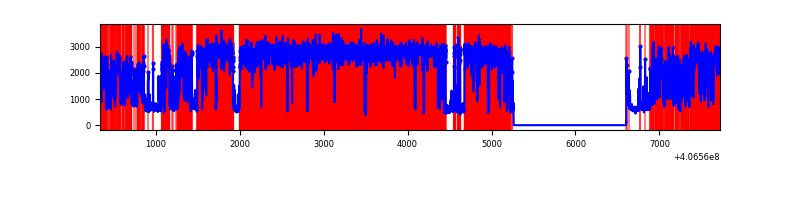 |
Top three noisy pixels from each quadrant. If the there are fewer than three noisy pixels in the level2.evt file, extra rows are filled as -1
| Pixel properties | Quadrant properties | ||||||
|---|---|---|---|---|---|---|---|
| Quadrant | DetID | PixID | Counts | Sigma | Mean | Median | Sigma |
| A | 10 | 83 | 481892 | 3411.58 | 692 | 678 | 141.1 |
| A | 9 | 143 | 87187 | 613.31 | 692 | 678 | 141.1 |
| A | 13 | 248 | 22451 | 154.36 | 692 | 678 | 141.1 |
| B | 4 | 171 | 365548 | 2742.39 | 686 | 667 | 133.1 |
| B | 0 | 183 | 122313 | 914.27 | 686 | 667 | 133.1 |
| B | 5 | 172 | 116404 | 869.86 | 686 | 667 | 133.1 |
| C | 15 | 214 | 246663 | 1568.0 | 675 | 680 | 156.9 |
| C | 3 | 9 | 152230 | 966.04 | 675 | 680 | 156.9 |
| C | 14 | 254 | 22607 | 139.77 | 675 | 680 | 156.9 |
| D | 12 | 227 | 9963353 | 101024.53 | 396 | 384 | 98.6 |
| D | 2 | 249 | 565562 | 5730.91 | 396 | 384 | 98.6 |
| D | 2 | 16 | 348323 | 3528.1 | 396 | 384 | 98.6 |
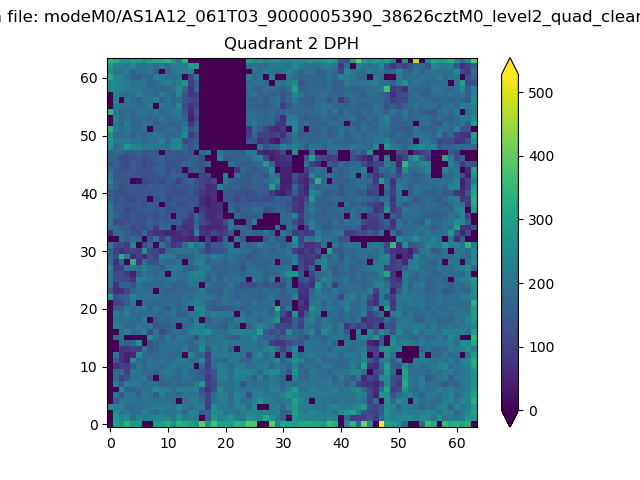
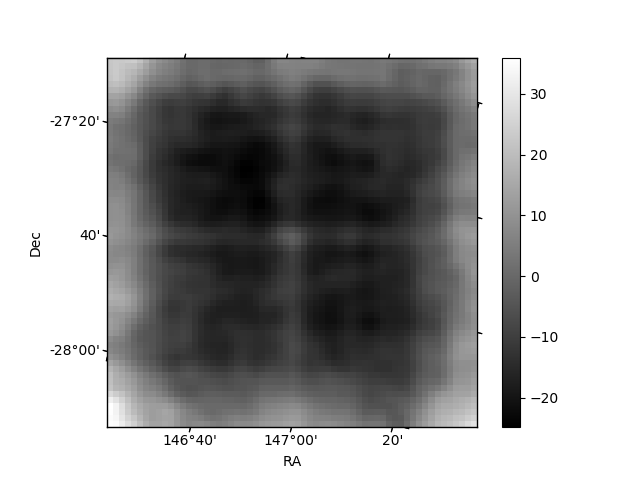
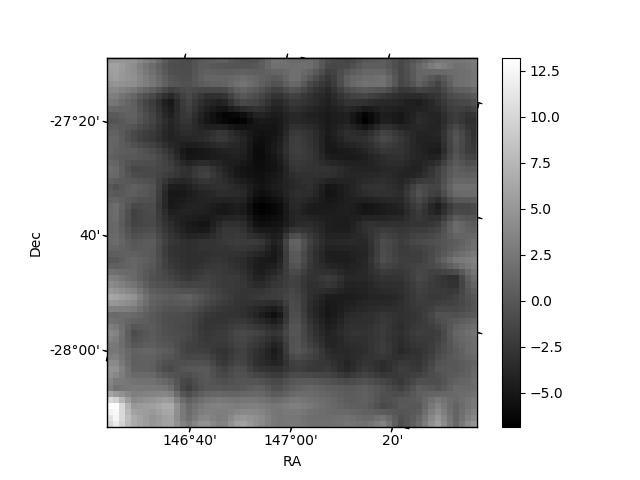
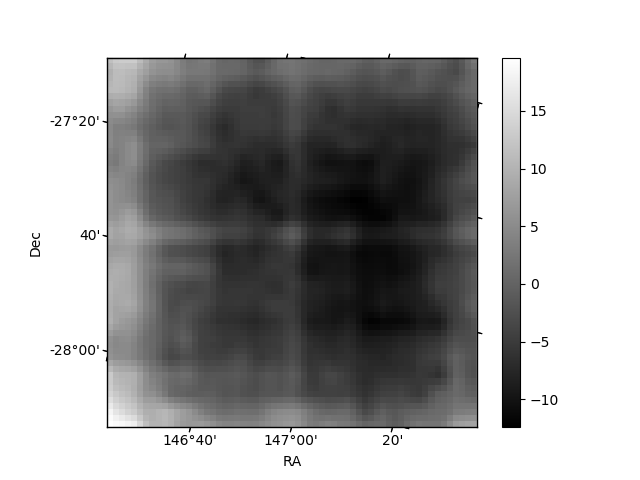
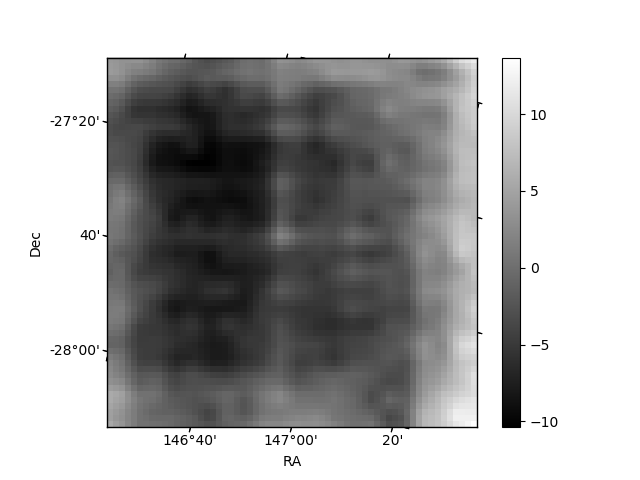
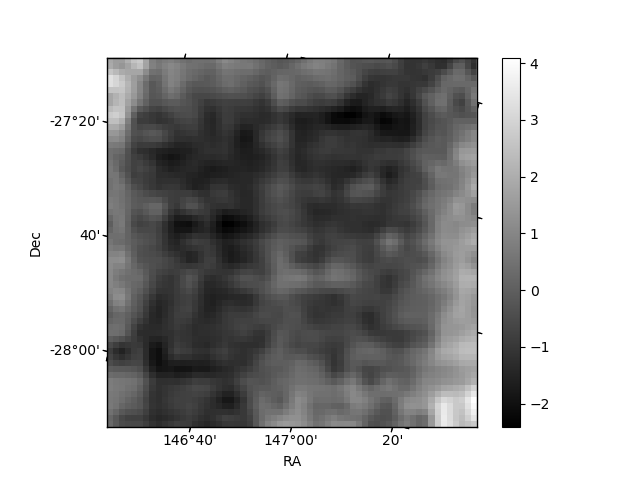
Histogram calculated using DETX and DETY for each event in the final _common_clean file
| Quadrant A | 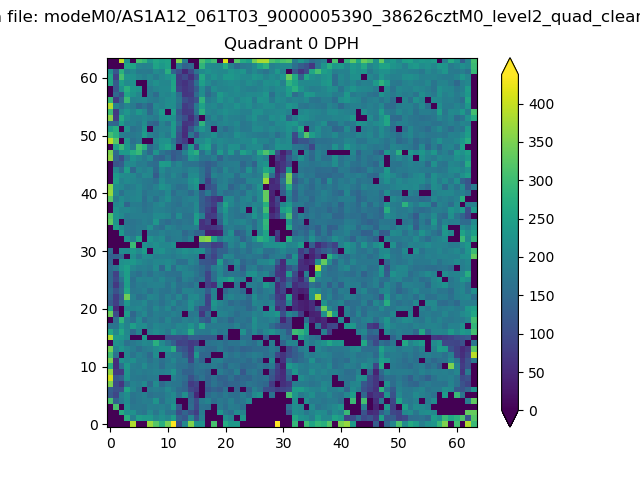 |
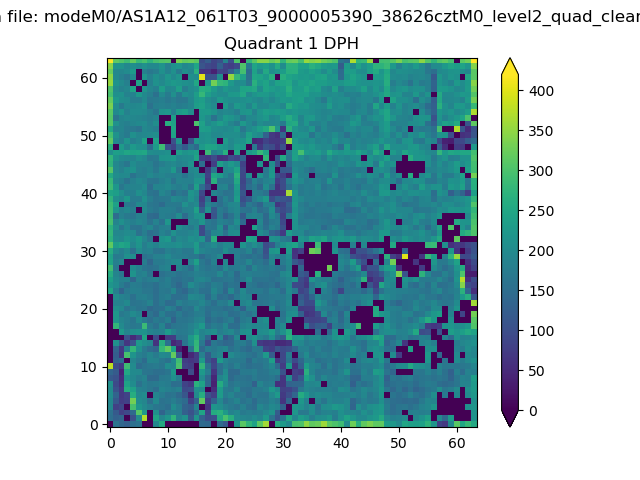 |
Quadrant B |
|---|---|---|---|
| Quadrant D | 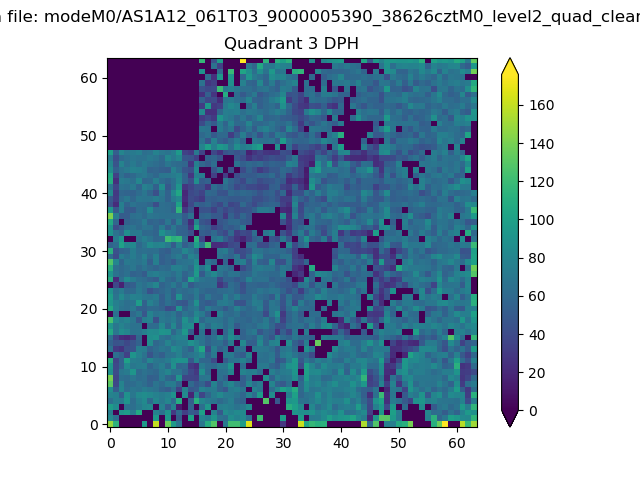 |
 |
Quadrant C |
| Plot type | Count rate plots | Images |
|---|---|---|
| Comparison with Poisson distribution Blue bars denote a histogram of data divided into 1 sec bins. Red curve is a Poisson curve with rate = median count rate of data. |
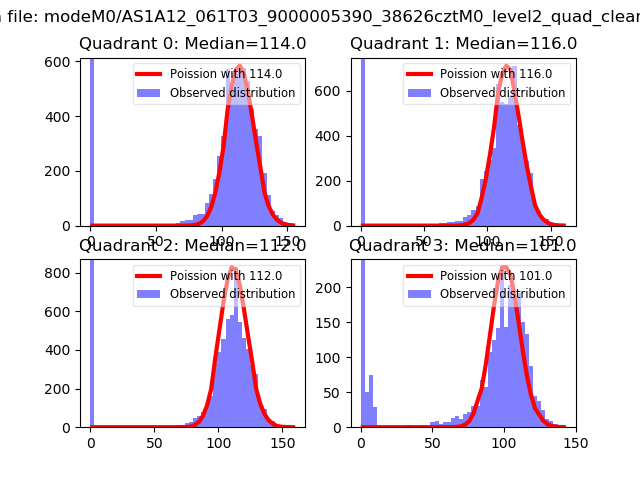 |
 |
| Quadrant-wise count rates Data is divided into 100 sec bins |
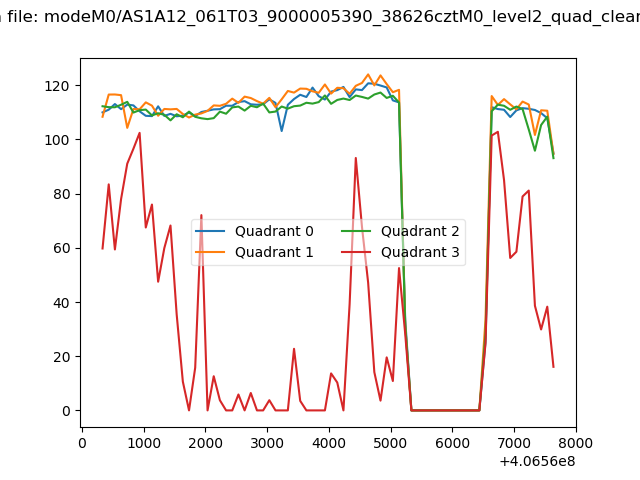 |
|
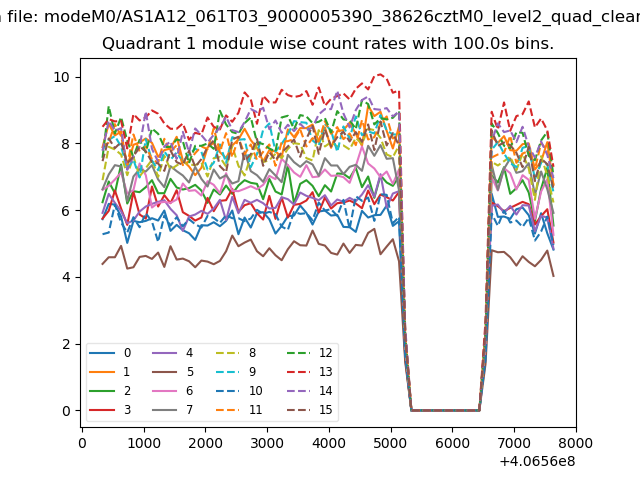
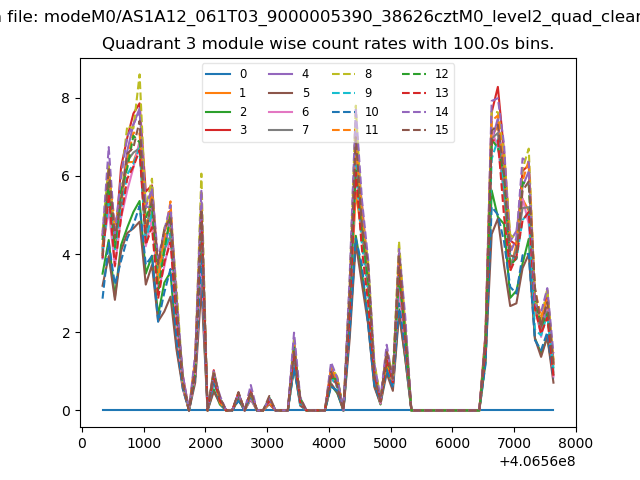
| Module-wise count rates for Quadrant A Data is divided into 100 sec bins |
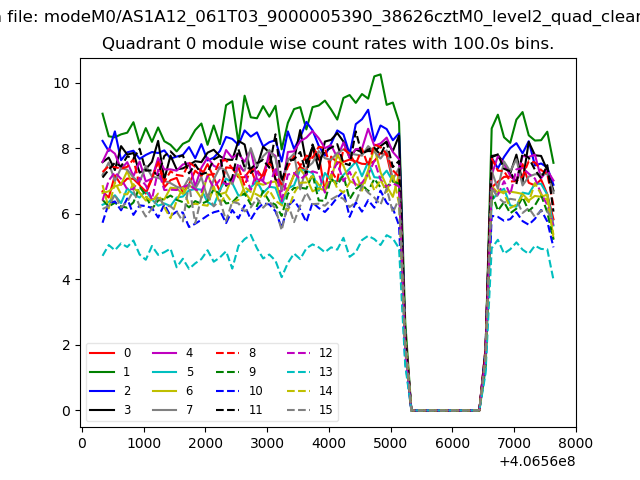 |
 |
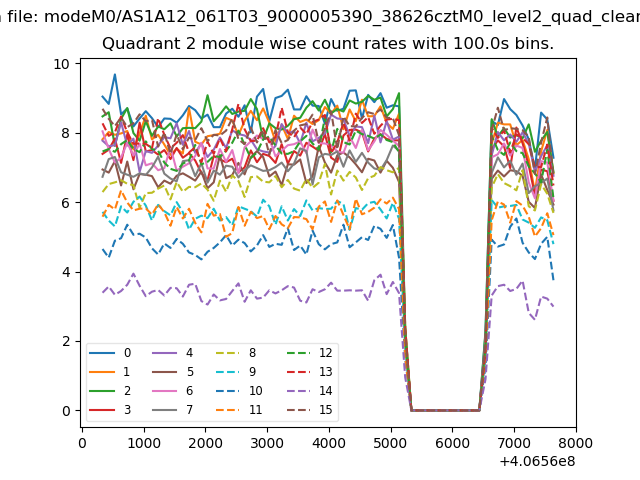
| Module-wise count rates for Quadrant B Data is divided into 100 sec bins |
 |
 |
| Module-wise count rates for Quadrant C Data is divided into 100 sec bins |
 |
 |
| Module-wise count rates for Quadrant D Data is divided into 100 sec bins |
 |
 |
| Parameter | Plot |
|---|---|
| CZT HV Monitor | 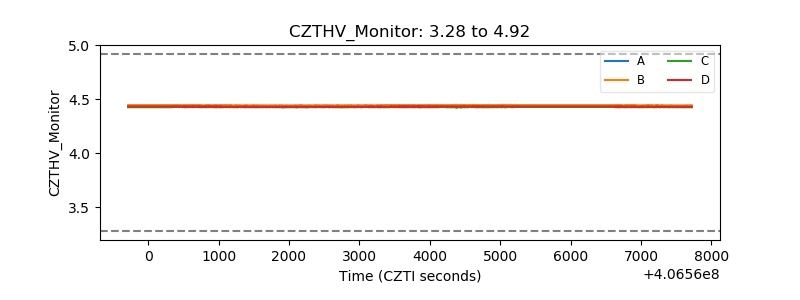 |
| D_VDD | 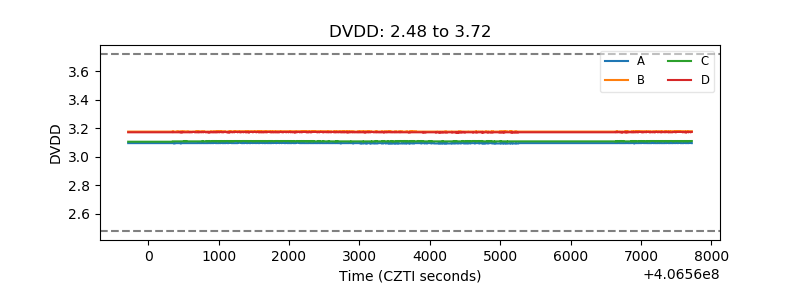 |
| Temperature 1 | 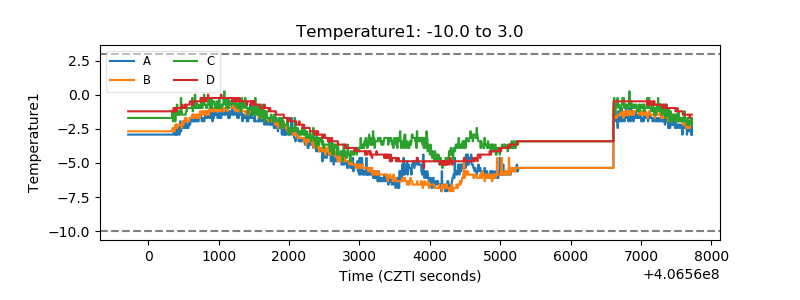 |
| Veto HV Monitor | 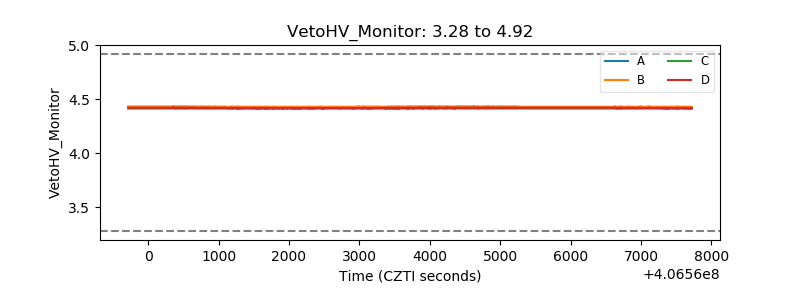 |
| Veto LLD | 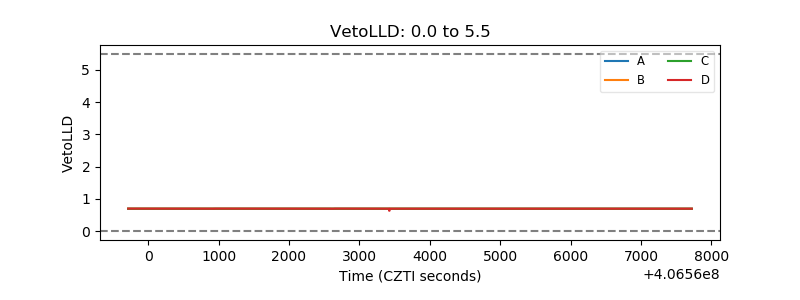 |
| Alpha Counter | 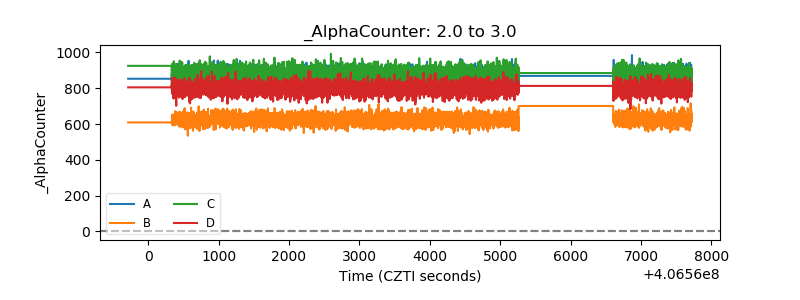 |
| _CPM_Rate | 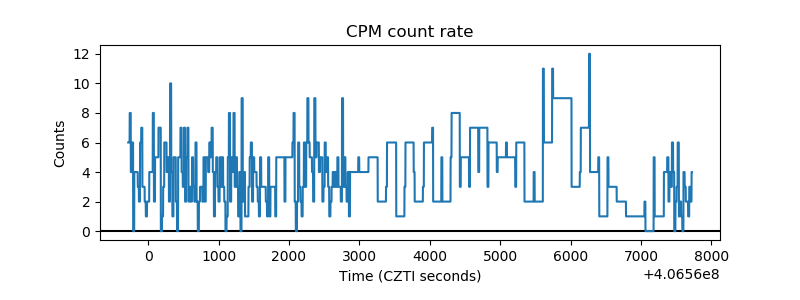 |
| CZT Counter | 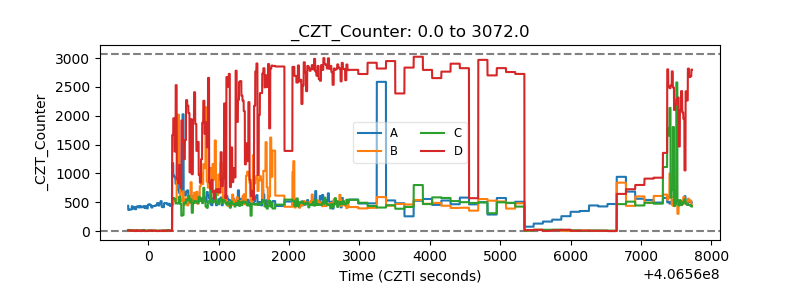 |
| +2.5 Volts monitor | 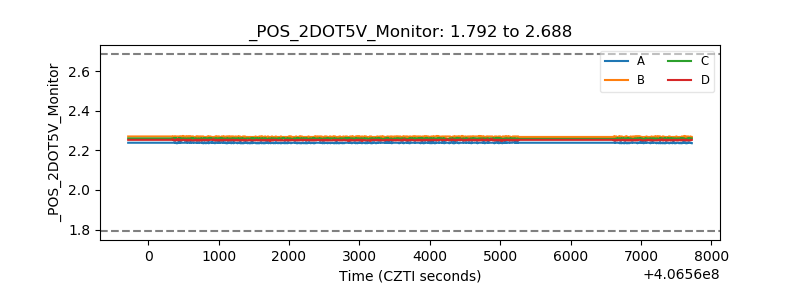 |
| +5 Volts monitor | 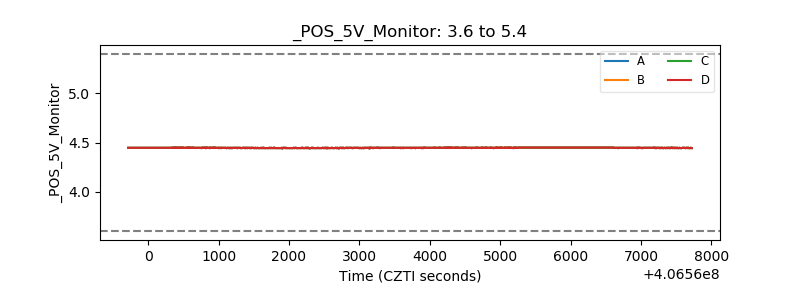 |
| _ROLL_ROT | 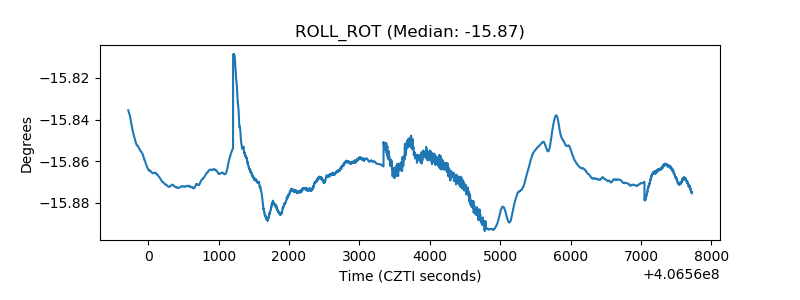 |
| _Roll_DEC | 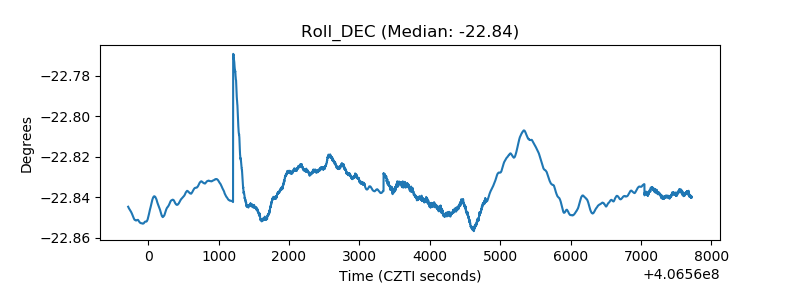 |
| _Roll_RA | 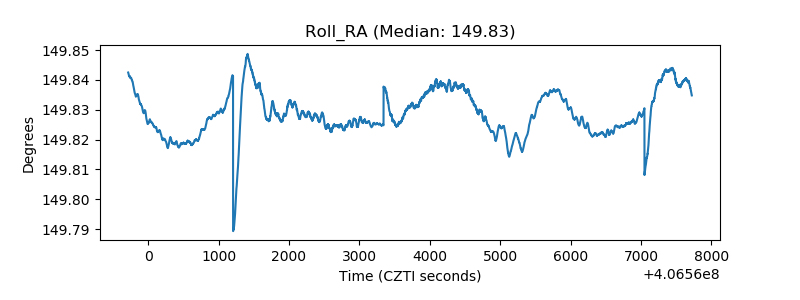 |
| Veto Counter | 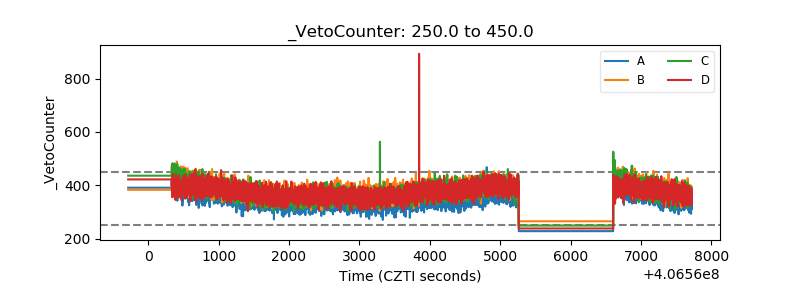 |