| Param | Original file | Final file |
|---|---|---|
| Filename | modeM0/AS1A12_061T03_9000005390_38627cztM0_level2.fits | modeM0/AS1A12_061T03_9000005390_38627cztM0_level2_quad_clean.evt |
| Size (bytes) | 467,406,720 | 97,536,960 |
| Size | 445.8 MB | 93.0 MB |
| Events in quadrant A | 3,299,307 | 674,702 |
| Events in quadrant B | 3,589,709 | 682,255 |
| Events in quadrant C | 3,111,909 | 666,325 |
| Events in quadrant D | 6,834,077 | 510,019 |
| Mode SS | |||
|---|---|---|---|
| Quadrant | BADHDUFLAG | Total packets | Discarded packets |
| A | 0 | 124 | 0 |
| B | 0 | 124 | 0 |
| C | 0 | 124 | 0 |
| D | 0 | 124 | 0 |
| Mode M9 | |||
|---|---|---|---|
| Quadrant | BADHDUFLAG | Total packets | Discarded packets |
| A | 0 | 20 | 0 |
| B | 0 | 20 | 0 |
| C | 0 | 20 | 0 |
| D | 0 | 21 | 0 |
| Mode M0 | |||
|---|---|---|---|
| Quadrant | BADHDUFLAG | Total packets | Discarded packets |
| A | 0 | 13331 | 3 |
| B | 0 | 14409 | 2 |
| C | 0 | 12800 | 2 |
| D | 0 | 24384 | 2 |
| Quadrant | Total seconds | Saturated seconds | Saturation percentage |
|---|---|---|---|
| A | 6005 | 47 | 0.782681% |
| B | 6005 | 105 | 1.748543% |
| C | 6005 | 53 | 0.882598% |
| D | 6005 | 1264 | 21.049126% |
Noise dominated data is calculated using 1-second bins in cleaned event files. If a bin has >2000 counts, and if more than 50% of those come from <1% of pixels, then it is considered to be noise-dominated and hence unusable.
| Quadrant | # 1 sec bins | Bins with >0 counts | Bins with >2000 counts | High rate bins dominated by noise | Noise dominated (total time) | Noise dominated (detector-on time) | Marked lightcurve |
|---|---|---|---|---|---|---|---|
| A | 7318 | 6006 | 28 | 28 | 0.38% | 0.47% | 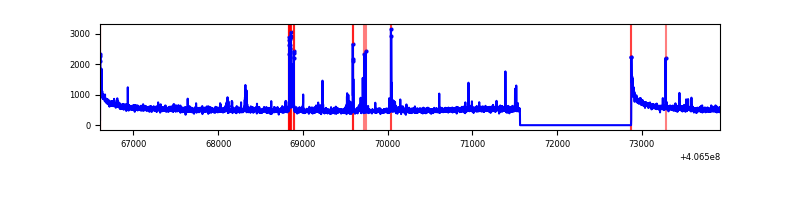 |
| B | 7318 | 6006 | 54 | 54 | 0.74% | 0.90% | 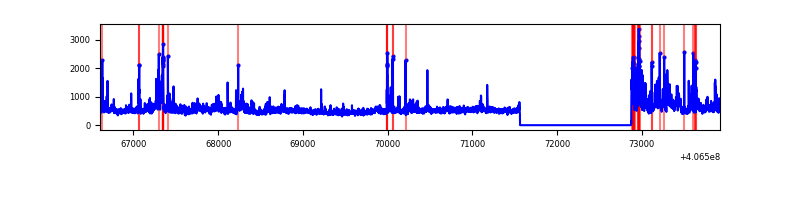 |
| C | 7318 | 6006 | 44 | 44 | 0.60% | 0.73% | 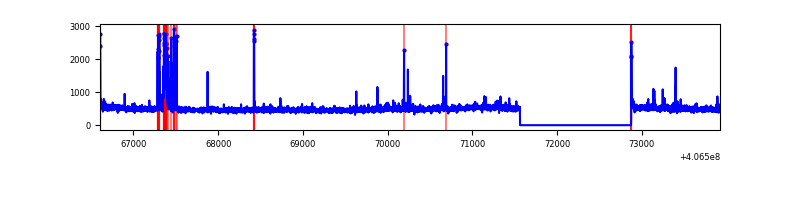 |
| D | 7318 | 6006 | 1253 | 1253 | 17.12% | 20.86% | 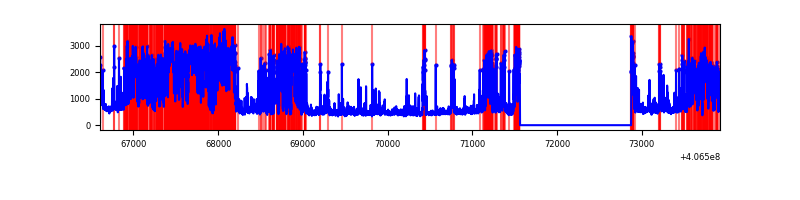 |
Top three noisy pixels from each quadrant. If the there are fewer than three noisy pixels in the level2.evt file, extra rows are filled as -1
| Pixel properties | Quadrant properties | ||||||
|---|---|---|---|---|---|---|---|
| Quadrant | DetID | PixID | Counts | Sigma | Mean | Median | Sigma |
| A | 10 | 83 | 473804 | 3398.48 | 683 | 670 | 139.2 |
| A | 9 | 143 | 145258 | 1038.56 | 683 | 670 | 139.2 |
| A | 15 | 174 | 15753 | 108.34 | 683 | 670 | 139.2 |
| B | 4 | 171 | 650665 | 4956.52 | 680 | 661 | 131.1 |
| B | 5 | 172 | 86680 | 655.93 | 680 | 661 | 131.1 |
| B | 0 | 183 | 77021 | 582.27 | 680 | 661 | 131.1 |
| C | 15 | 214 | 243269 | 1553.18 | 670 | 674 | 156.2 |
| C | 3 | 9 | 165164 | 1053.12 | 670 | 674 | 156.2 |
| C | 14 | 254 | 53093 | 335.61 | 670 | 674 | 156.2 |
| D | 12 | 227 | 1813455 | 12008.38 | 614 | 597 | 151.0 |
| D | 2 | 249 | 966588 | 6398.73 | 614 | 597 | 151.0 |
| D | 2 | 250 | 478893 | 3168.24 | 614 | 597 | 151.0 |
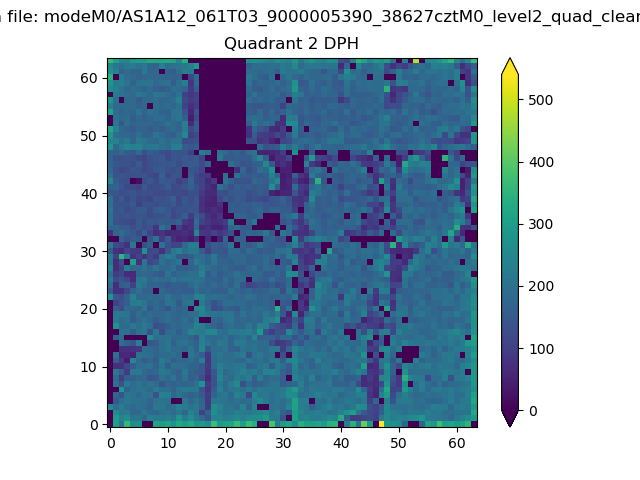
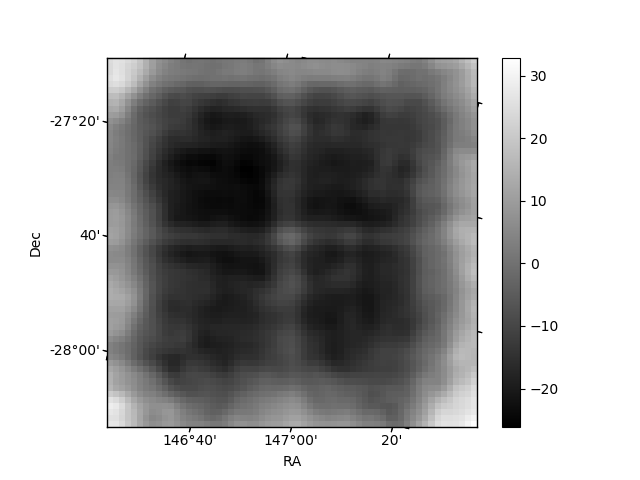
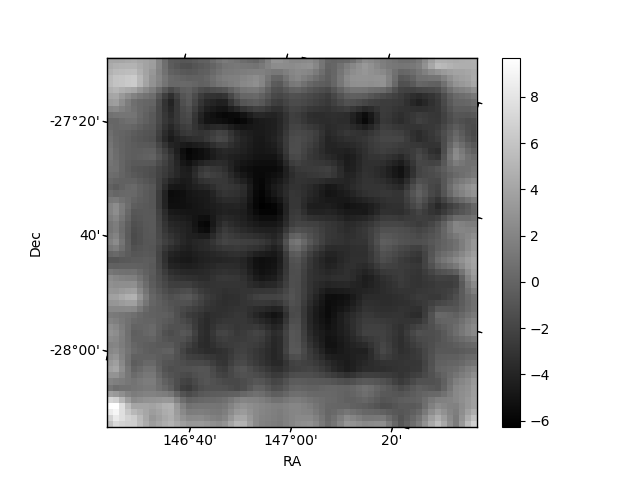
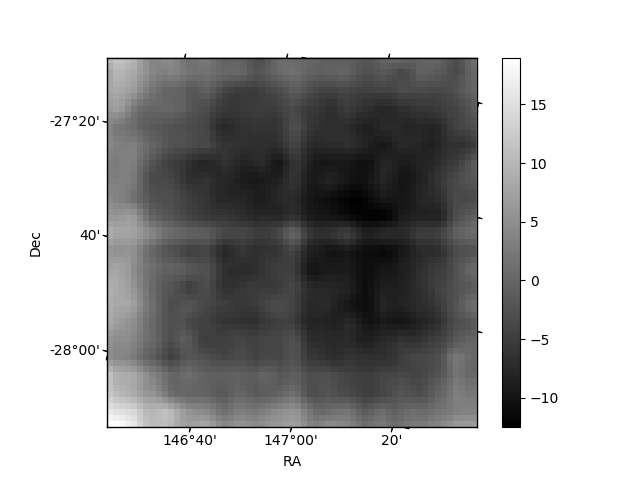
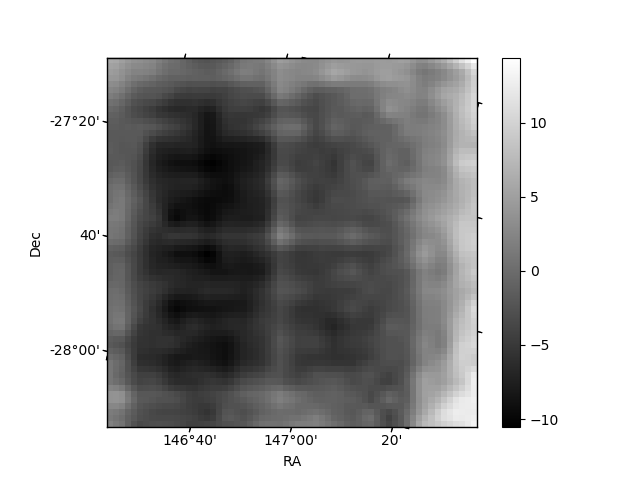
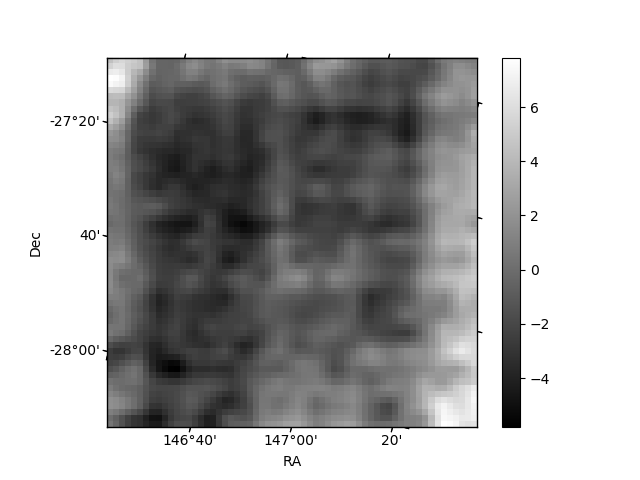
Histogram calculated using DETX and DETY for each event in the final _common_clean file
| Quadrant A | 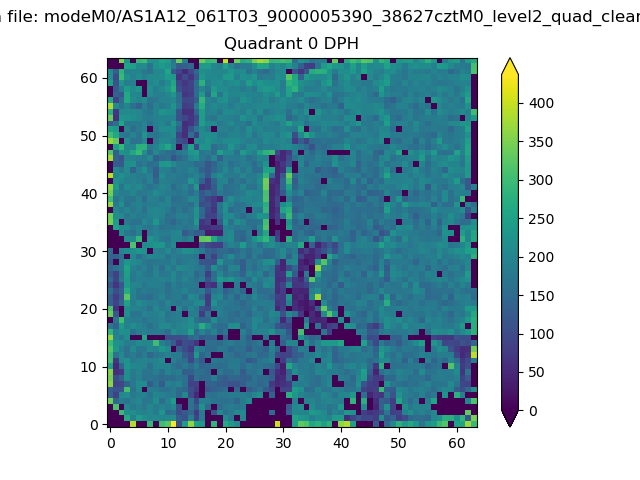 |
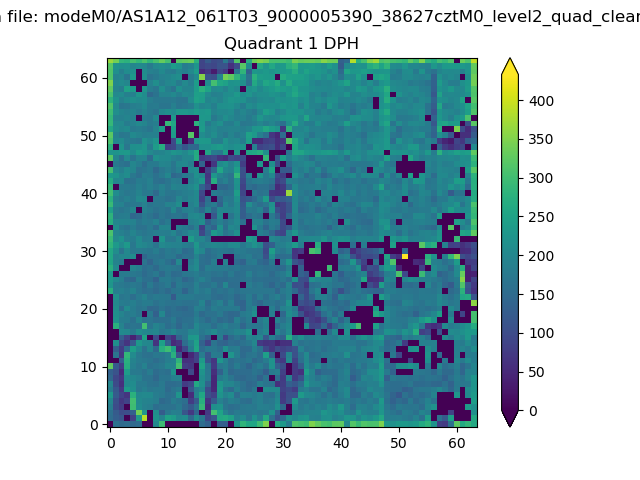 |
Quadrant B |
|---|---|---|---|
| Quadrant D | 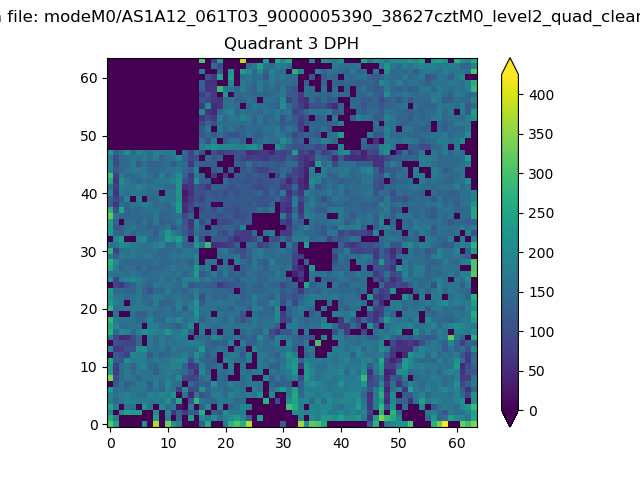 |
 |
Quadrant C |
| Plot type | Count rate plots | Images |
|---|---|---|
| Comparison with Poisson distribution Blue bars denote a histogram of data divided into 1 sec bins. Red curve is a Poisson curve with rate = median count rate of data. |
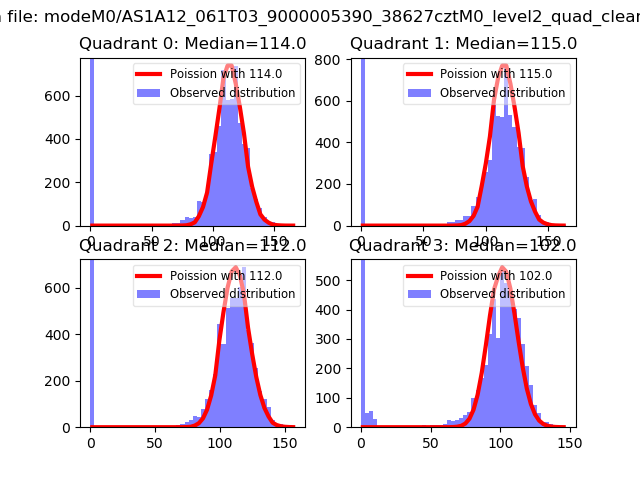 |
 |
| Quadrant-wise count rates Data is divided into 100 sec bins |
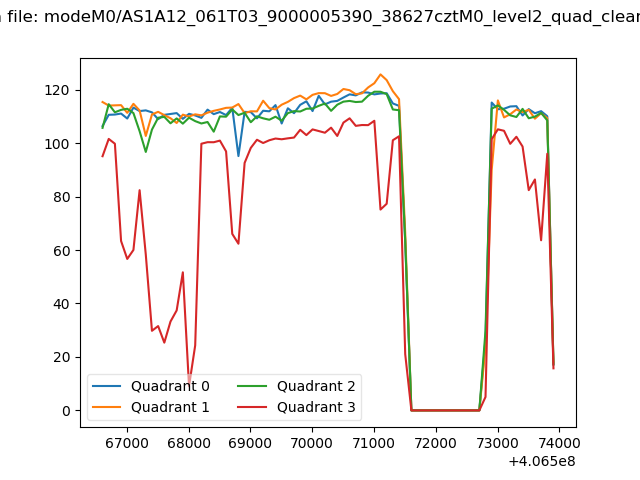 |
|
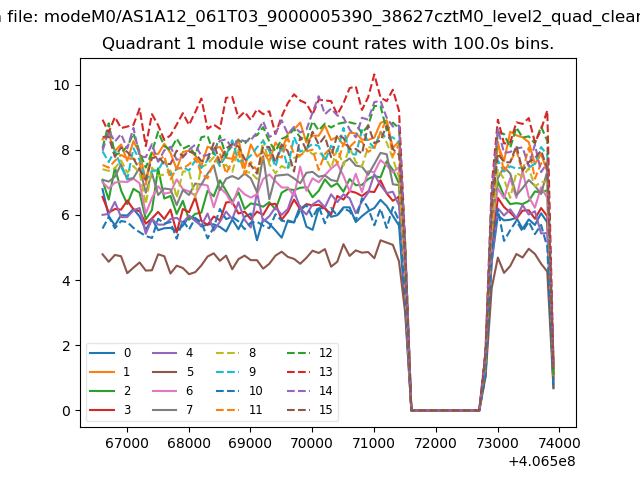
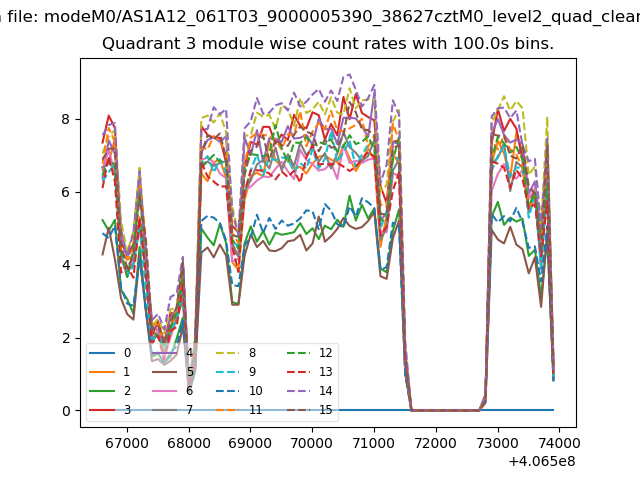
| Module-wise count rates for Quadrant A Data is divided into 100 sec bins |
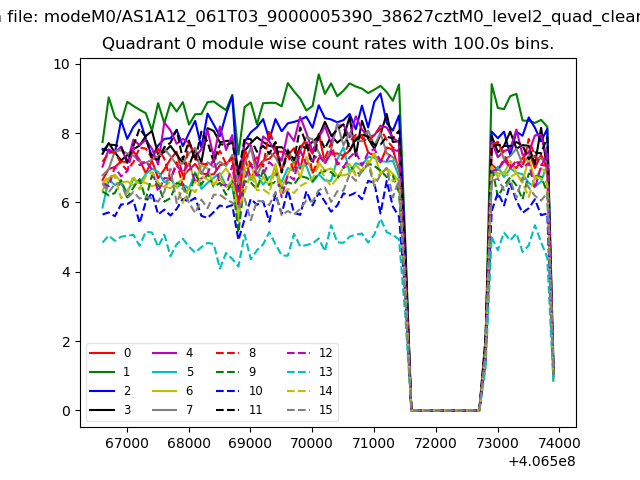 |
 |
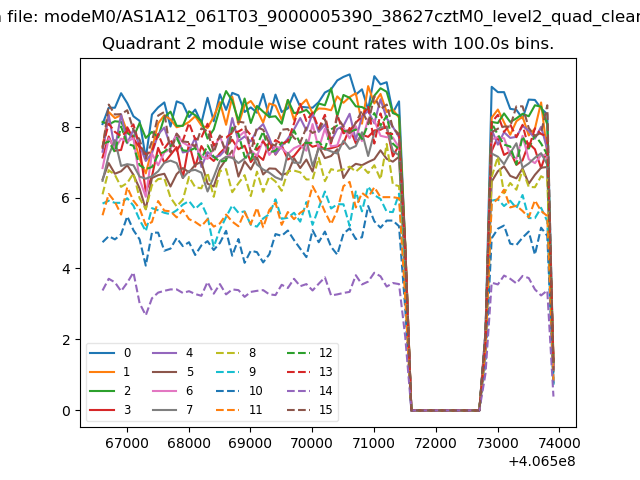
| Module-wise count rates for Quadrant B Data is divided into 100 sec bins |
 |
 |
| Module-wise count rates for Quadrant C Data is divided into 100 sec bins |
 |
 |
| Module-wise count rates for Quadrant D Data is divided into 100 sec bins |
 |
 |
| Parameter | Plot |
|---|---|
| CZT HV Monitor | 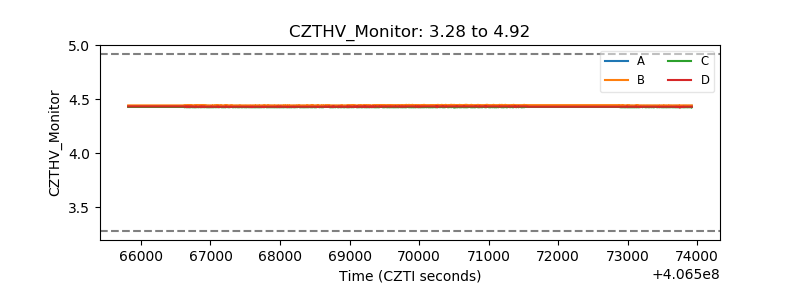 |
| D_VDD | 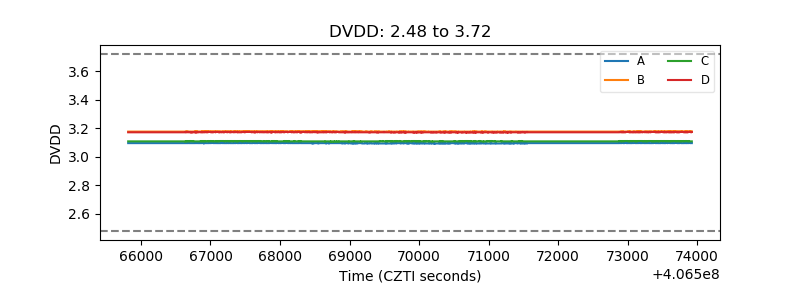 |
| Temperature 1 | 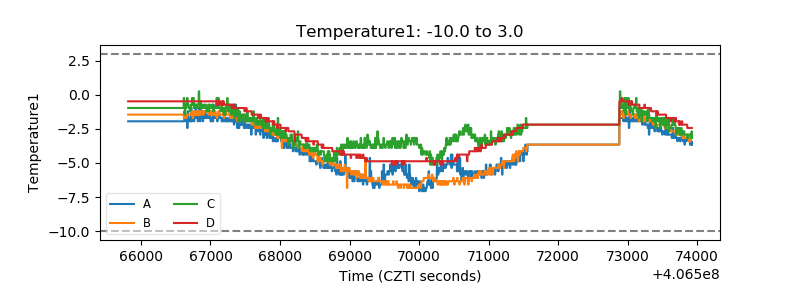 |
| Veto HV Monitor | 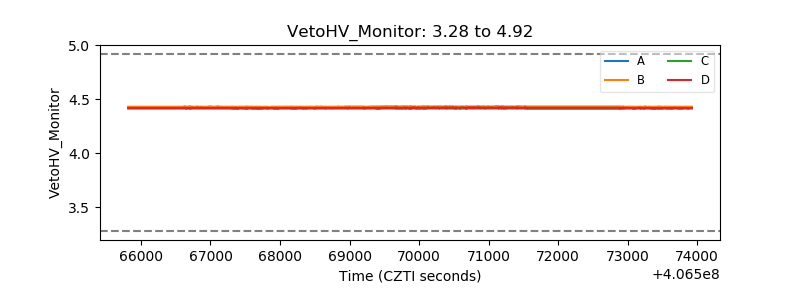 |
| Veto LLD | 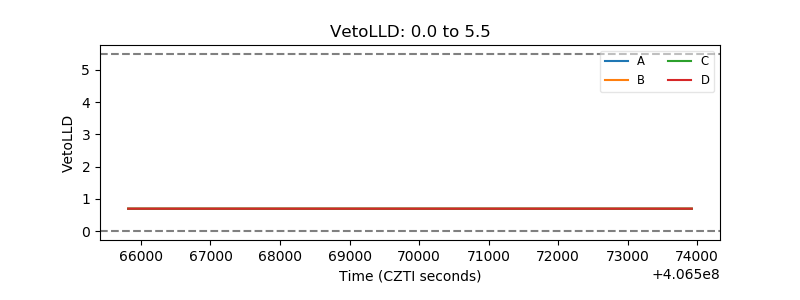 |
| Alpha Counter | 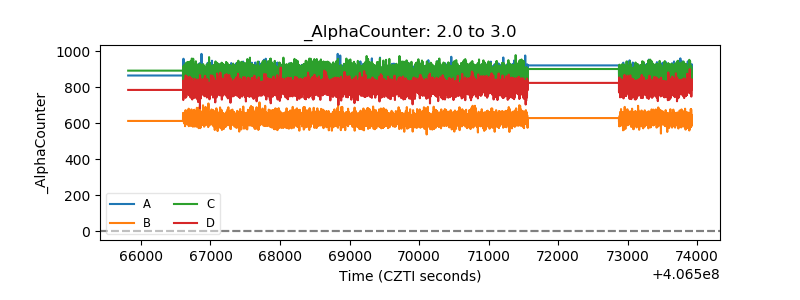 |
| _CPM_Rate | 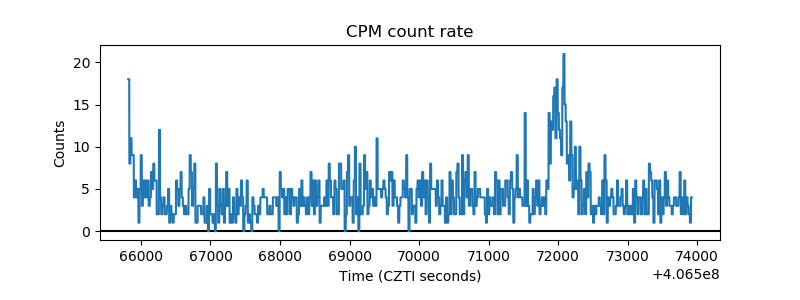 |
| CZT Counter | 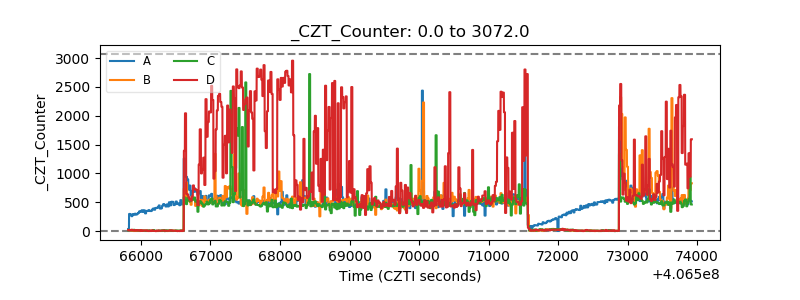 |
| +2.5 Volts monitor | 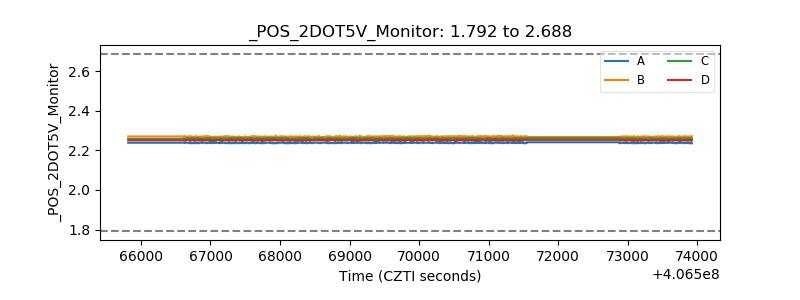 |
| +5 Volts monitor | 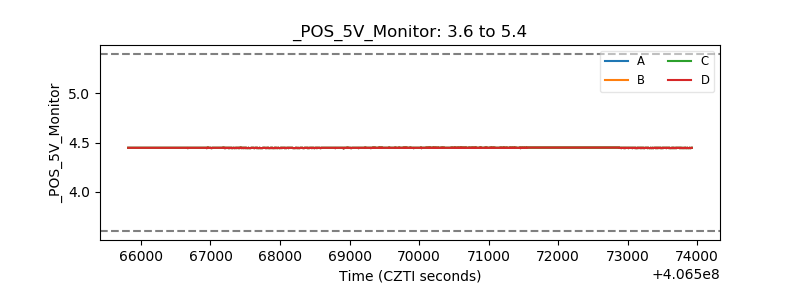 |
| _ROLL_ROT | 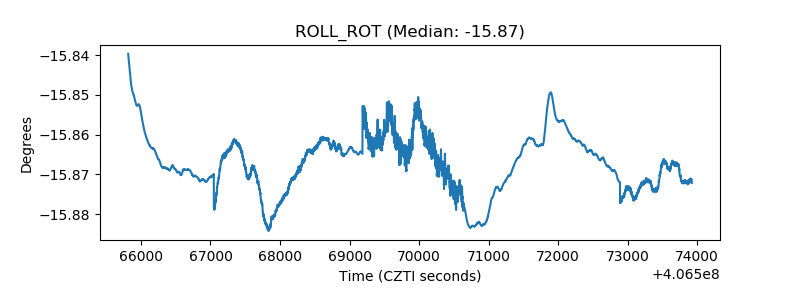 |
| _Roll_DEC | 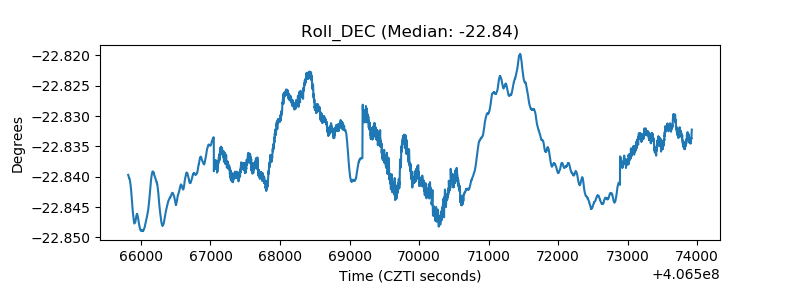 |
| _Roll_RA | 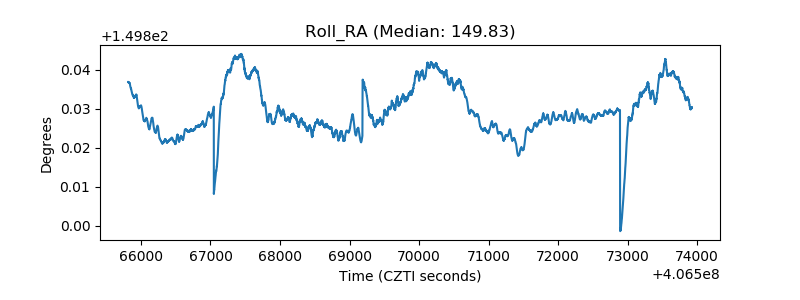 |
| Veto Counter | 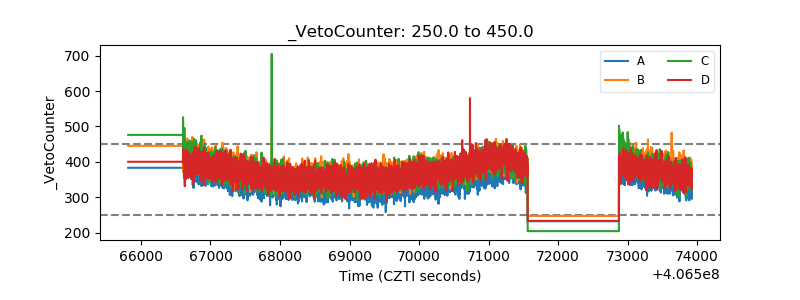 |