| Param | Original file | Final file |
|---|---|---|
| Filename | modeM0/AS1A12_061T03_9000005390_38629cztM0_level2.fits | modeM0/AS1A12_061T03_9000005390_38629cztM0_level2_quad_clean.evt |
| Size (bytes) | 966,502,080 | 167,287,680 |
| Size | 921.7 MB | 159.5 MB |
| Events in quadrant A | 5,688,999 | 1,214,224 |
| Events in quadrant B | 6,569,096 | 1,222,928 |
| Events in quadrant C | 5,688,777 | 1,187,050 |
| Events in quadrant D | 16,991,803 | 691,603 |
| Mode SS | |||
|---|---|---|---|
| Quadrant | BADHDUFLAG | Total packets | Discarded packets |
| A | 0 | 222 | 0 |
| B | 0 | 222 | 0 |
| C | 0 | 222 | 0 |
| D | 0 | 222 | 0 |
| Mode M9 | |||
|---|---|---|---|
| Quadrant | BADHDUFLAG | Total packets | Discarded packets |
| A | 0 | 41 | 0 |
| B | 0 | 41 | 0 |
| C | 0 | 41 | 0 |
| D | 0 | 41 | 0 |
| Mode M0 | |||
|---|---|---|---|
| Quadrant | BADHDUFLAG | Total packets | Discarded packets |
| A | 0 | 23437 | 4 |
| B | 0 | 26601 | 3 |
| C | 0 | 23452 | 3 |
| D | 0 | 57673 | 3 |
| Quadrant | Total seconds | Saturated seconds | Saturation percentage |
|---|---|---|---|
| A | 10823 | 50 | 0.461979% |
| B | 10823 | 237 | 2.189781% |
| C | 10823 | 95 | 0.877760% |
| D | 10823 | 4378 | 40.450892% |
Noise dominated data is calculated using 1-second bins in cleaned event files. If a bin has >2000 counts, and if more than 50% of those come from <1% of pixels, then it is considered to be noise-dominated and hence unusable.
| Quadrant | # 1 sec bins | Bins with >0 counts | Bins with >2000 counts | High rate bins dominated by noise | Noise dominated (total time) | Noise dominated (detector-on time) | Marked lightcurve |
|---|---|---|---|---|---|---|---|
| A | 14912 | 10826 | 24 | 24 | 0.16% | 0.22% | 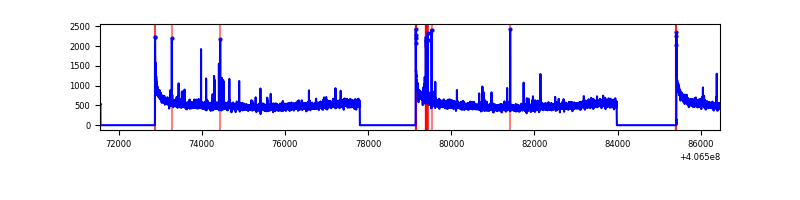 |
| B | 14912 | 10826 | 128 | 128 | 0.86% | 1.18% | 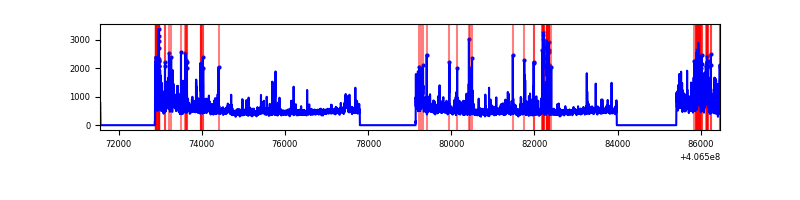 |
| C | 14912 | 10826 | 84 | 84 | 0.56% | 0.78% | 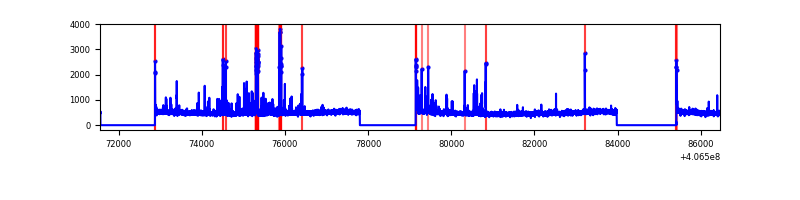 |
| D | 14912 | 10826 | 4445 | 4445 | 29.81% | 41.06% | 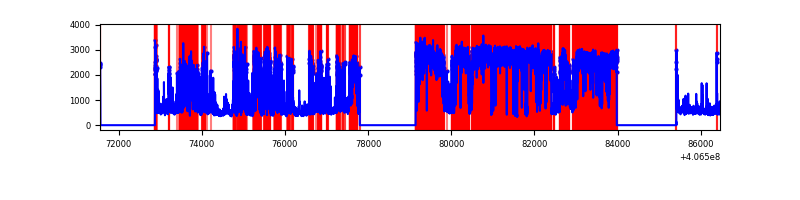 |
Top three noisy pixels from each quadrant. If the there are fewer than three noisy pixels in the level2.evt file, extra rows are filled as -1
| Pixel properties | Quadrant properties | ||||||
|---|---|---|---|---|---|---|---|
| Quadrant | DetID | PixID | Counts | Sigma | Mean | Median | Sigma |
| A | 10 | 83 | 779356 | 3107.53 | 1232 | 1208 | 250.4 |
| A | 0 | 247 | 42268 | 163.97 | 1232 | 1208 | 250.4 |
| A | 9 | 143 | 39497 | 152.91 | 1232 | 1208 | 250.4 |
| B | 4 | 171 | 748061 | 3204.2 | 1219 | 1186 | 233.1 |
| B | 0 | 183 | 532002 | 2277.27 | 1219 | 1186 | 233.1 |
| B | 5 | 184 | 250755 | 1070.69 | 1219 | 1186 | 233.1 |
| C | 15 | 214 | 428057 | 1509.22 | 1205 | 1213 | 282.8 |
| C | 14 | 254 | 293777 | 1034.44 | 1205 | 1213 | 282.8 |
| C | 3 | 9 | 209075 | 734.95 | 1205 | 1213 | 282.8 |
| D | 12 | 227 | 10073425 | 43407.74 | 941 | 914 | 232.0 |
| D | 2 | 249 | 749730 | 3227.04 | 941 | 914 | 232.0 |
| D | 2 | 250 | 740900 | 3188.99 | 941 | 914 | 232.0 |
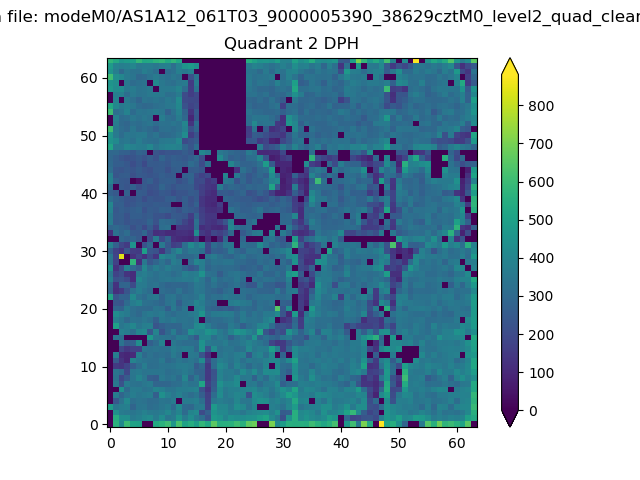
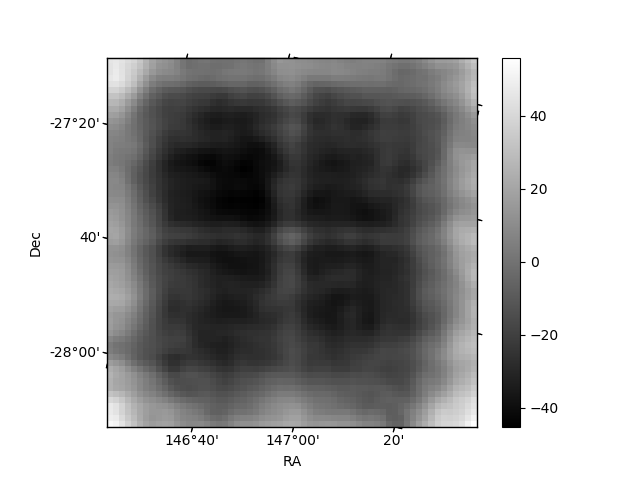
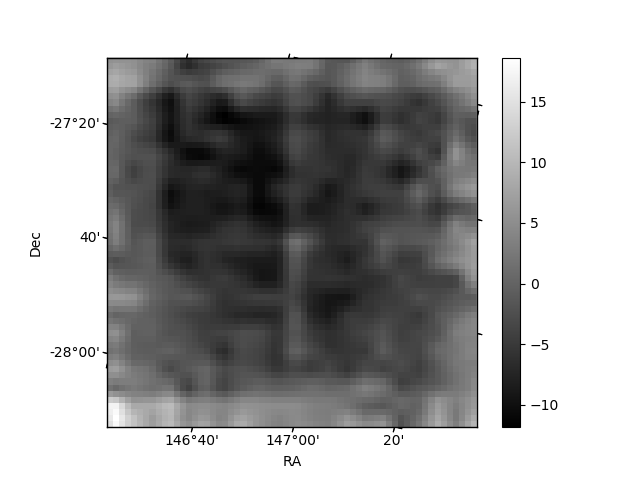
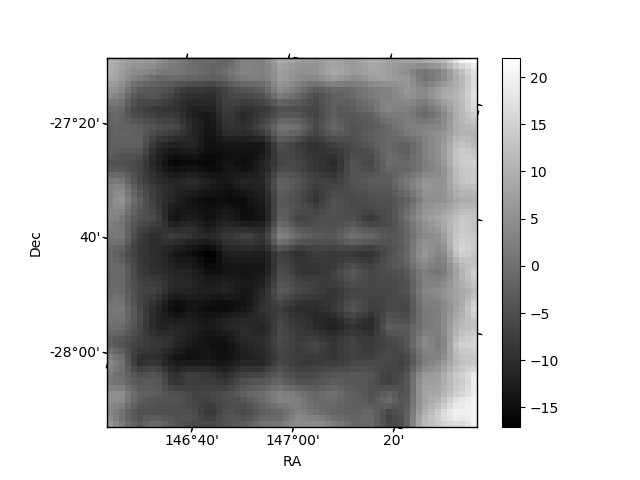
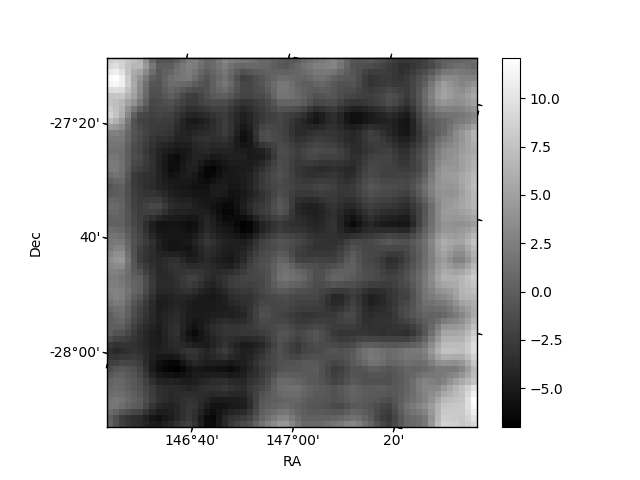
Histogram calculated using DETX and DETY for each event in the final _common_clean file
| Quadrant A | 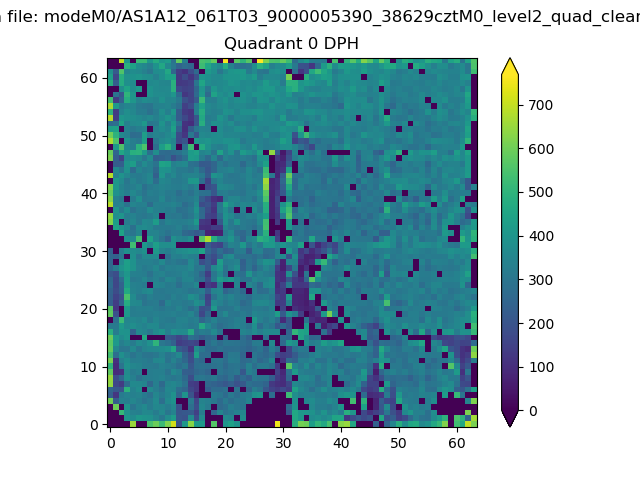 |
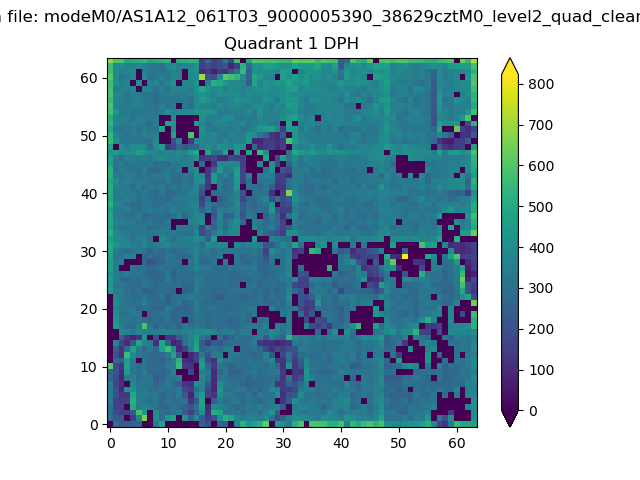 |
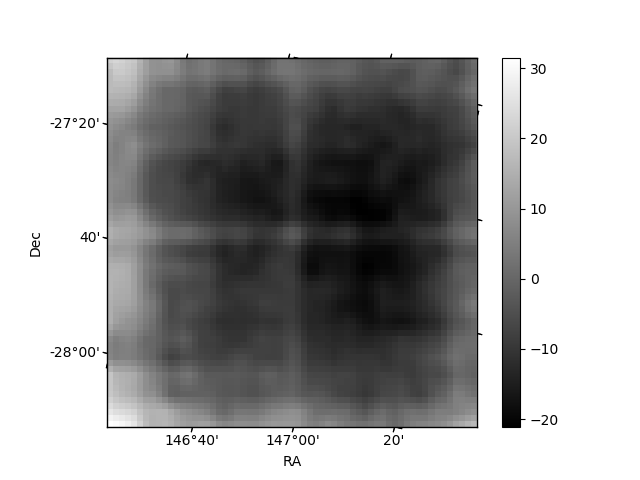
Quadrant B |
|---|---|---|---|
| Quadrant D | 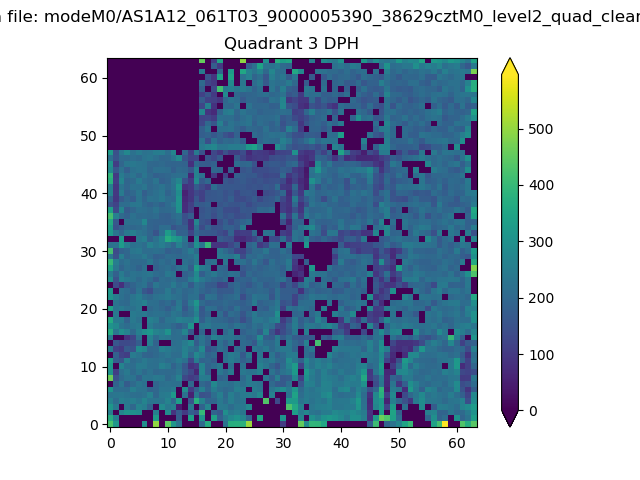 |
 |
Quadrant C |
| Plot type | Count rate plots | Images |
|---|---|---|
| Comparison with Poisson distribution Blue bars denote a histogram of data divided into 1 sec bins. Red curve is a Poisson curve with rate = median count rate of data. |
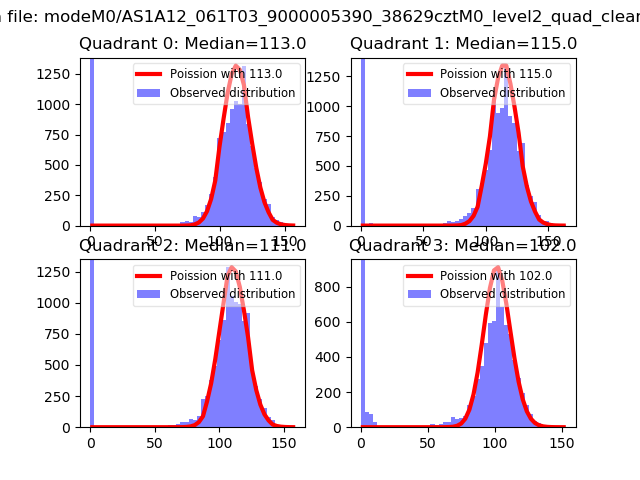 |
 |
| Quadrant-wise count rates Data is divided into 100 sec bins |
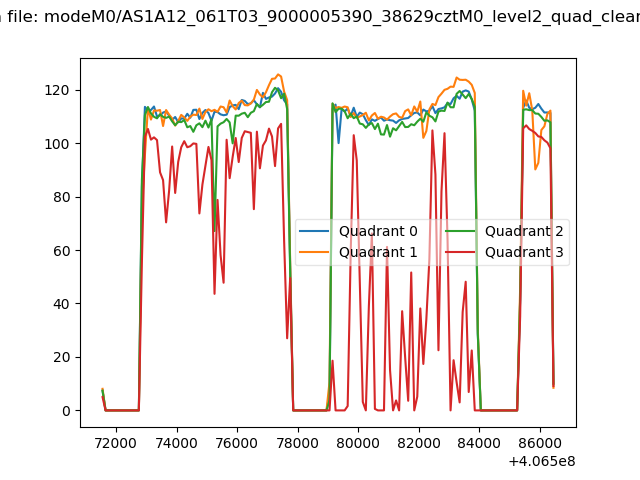 |
|
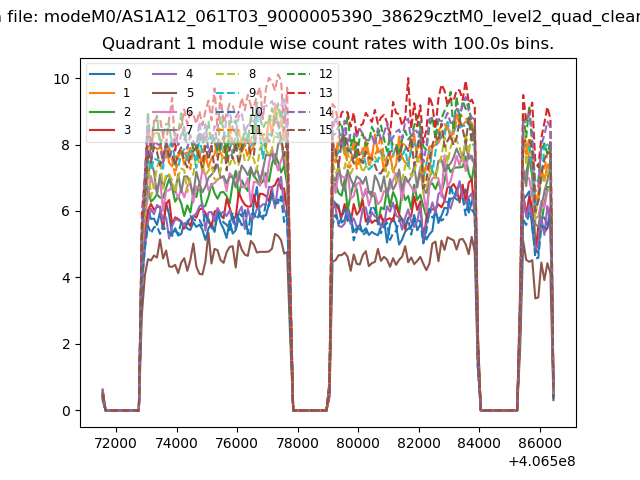
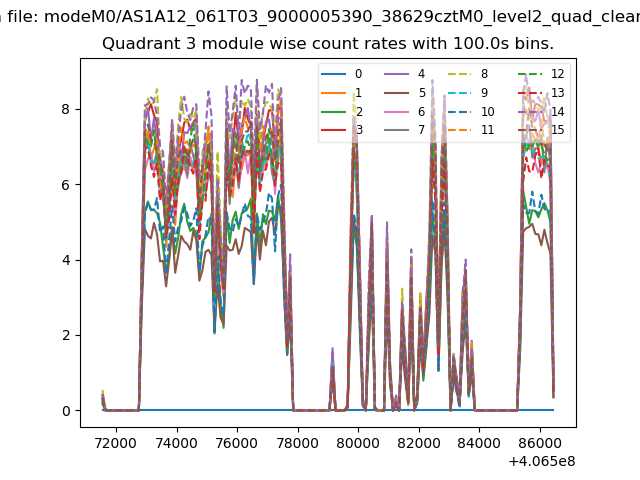
| Module-wise count rates for Quadrant A Data is divided into 100 sec bins |
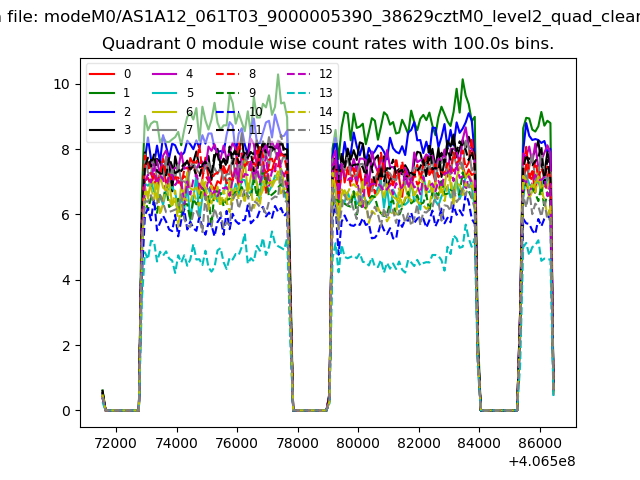 |
 |
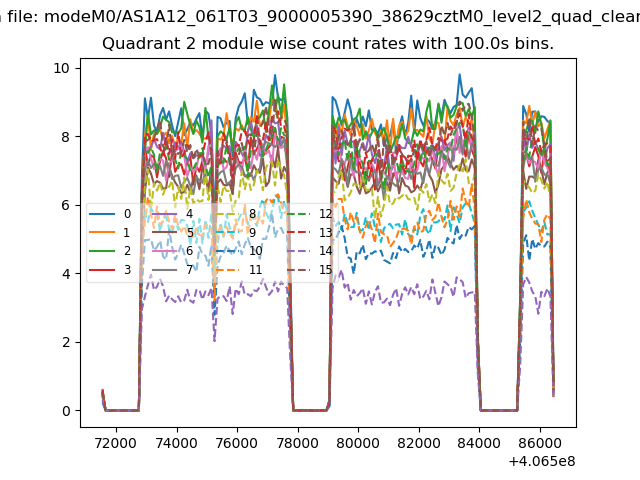
| Module-wise count rates for Quadrant B Data is divided into 100 sec bins |
 |
 |
| Module-wise count rates for Quadrant C Data is divided into 100 sec bins |
 |
 |
| Module-wise count rates for Quadrant D Data is divided into 100 sec bins |
 |
 |
| Parameter | Plot |
|---|---|
| CZT HV Monitor | 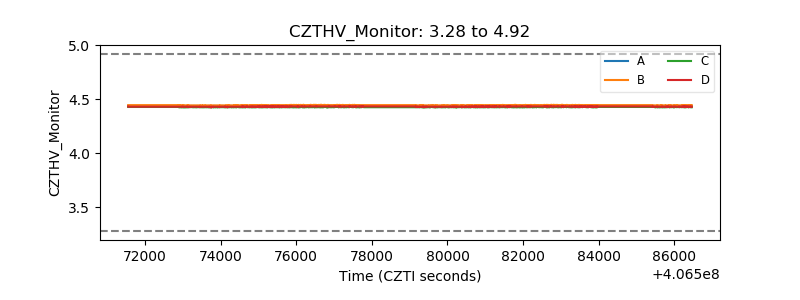 |
| D_VDD | 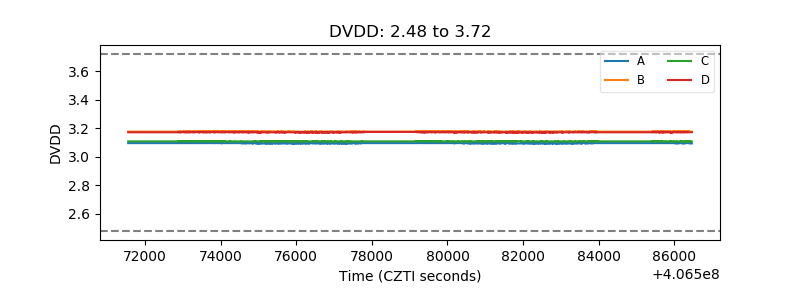 |
| Temperature 1 | 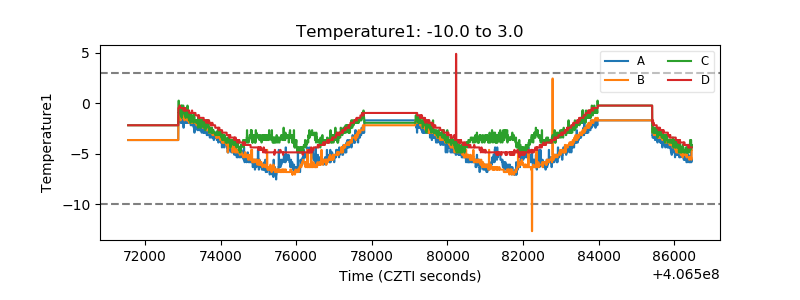 |
| Veto HV Monitor | 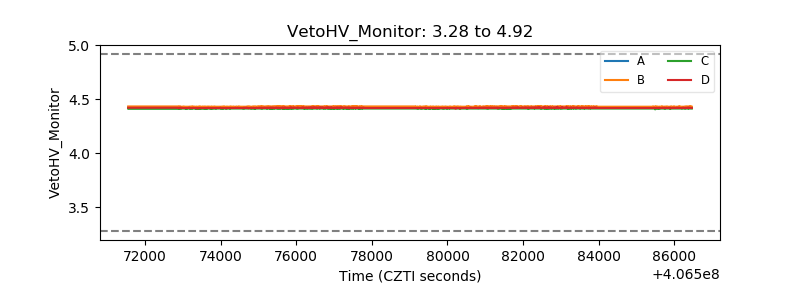 |
| Veto LLD | 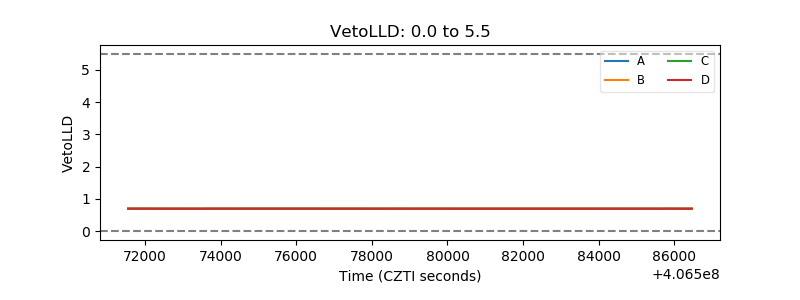 |
| Alpha Counter | 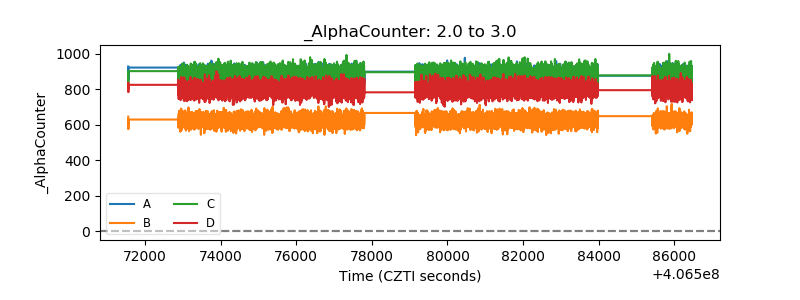 |
| _CPM_Rate | 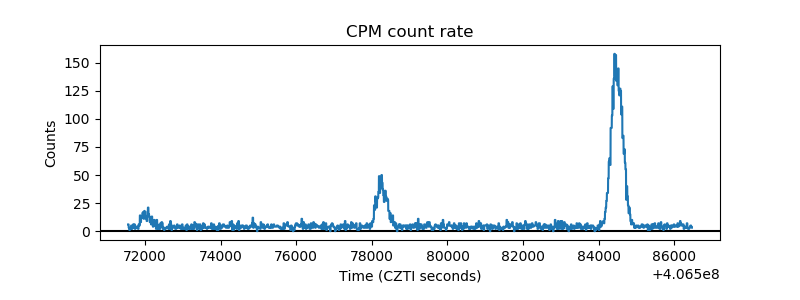 |
| CZT Counter | 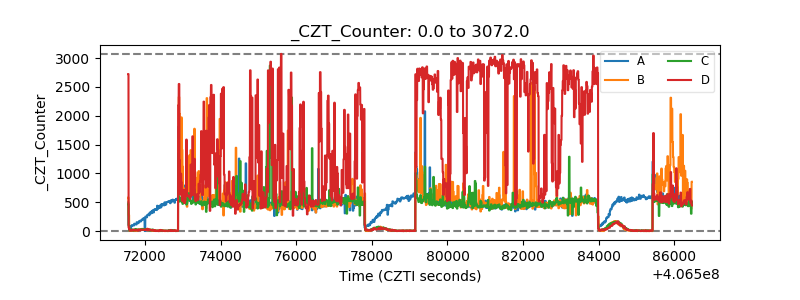 |
| +2.5 Volts monitor | 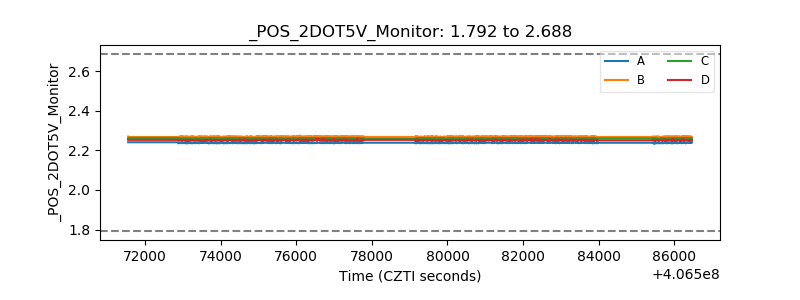 |
| +5 Volts monitor | 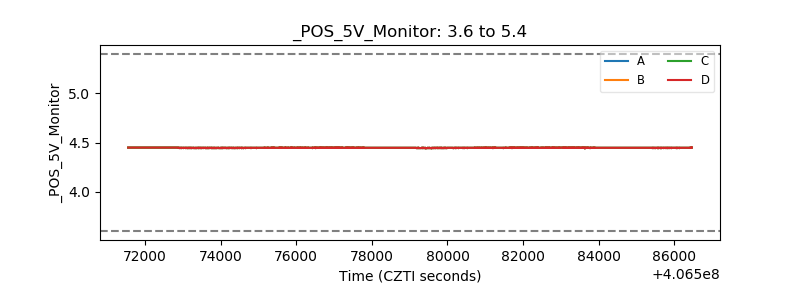 |
| _ROLL_ROT | 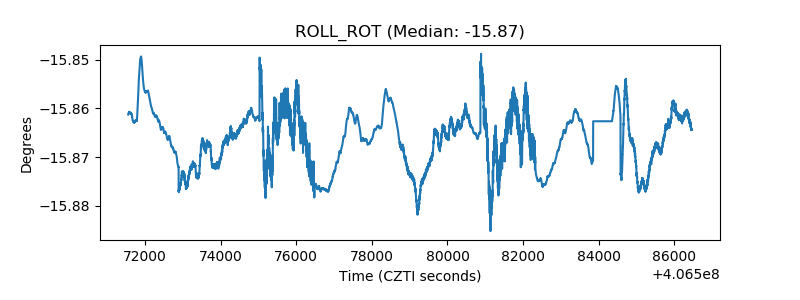 |
| _Roll_DEC | 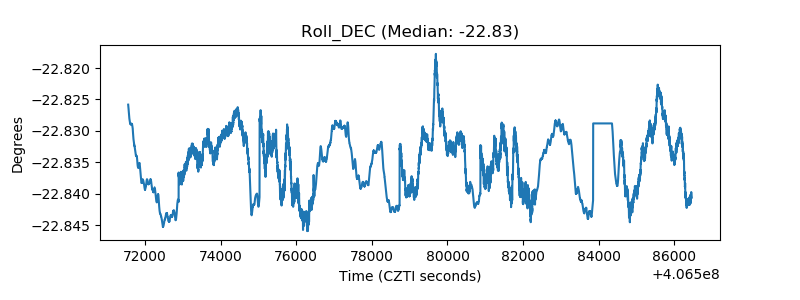 |
| _Roll_RA | 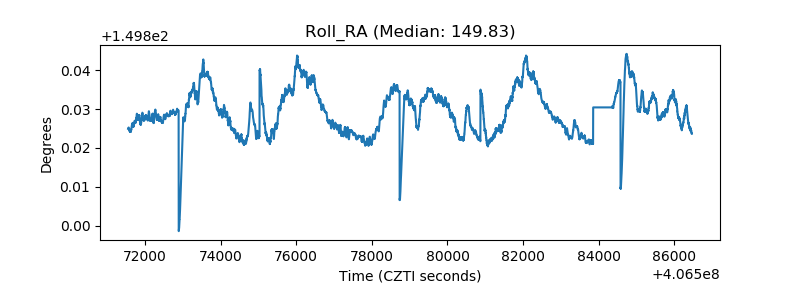 |
| Veto Counter | 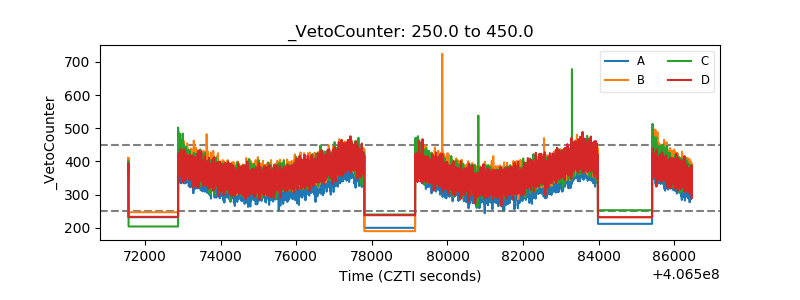 |