| Param | Original file | Final file |
|---|---|---|
| Filename | modeM0/AS1A12_061T03_9000005390_38630cztM0_level2.fits | modeM0/AS1A12_061T03_9000005390_38630cztM0_level2_quad_clean.evt |
| Size (bytes) | 412,145,280 | 94,420,800 |
| Size | 393.1 MB | 90.0 MB |
| Events in quadrant A | 3,063,770 | 650,854 |
| Events in quadrant B | 3,816,170 | 647,571 |
| Events in quadrant C | 2,831,061 | 638,299 |
| Events in quadrant D | 5,099,017 | 520,801 |
| Mode SS | |||
|---|---|---|---|
| Quadrant | BADHDUFLAG | Total packets | Discarded packets |
| A | 0 | 120 | 0 |
| B | 0 | 120 | 0 |
| C | 0 | 120 | 0 |
| D | 0 | 120 | 0 |
| Mode M9 | |||
|---|---|---|---|
| Quadrant | BADHDUFLAG | Total packets | Discarded packets |
| A | 0 | 29 | 0 |
| B | 0 | 29 | 0 |
| C | 0 | 29 | 0 |
| D | 0 | 29 | 0 |
| Mode M0 | |||
|---|---|---|---|
| Quadrant | BADHDUFLAG | Total packets | Discarded packets |
| A | 0 | 12693 | 3 |
| B | 0 | 15258 | 2 |
| C | 0 | 11885 | 2 |
| D | 0 | 19054 | 2 |
| Quadrant | Total seconds | Saturated seconds | Saturation percentage |
|---|---|---|---|
| A | 5736 | 34 | 0.592748% |
| B | 5736 | 231 | 4.027197% |
| C | 5736 | 17 | 0.296374% |
| D | 5736 | 768 | 13.389121% |
Noise dominated data is calculated using 1-second bins in cleaned event files. If a bin has >2000 counts, and if more than 50% of those come from <1% of pixels, then it is considered to be noise-dominated and hence unusable.
| Quadrant | # 1 sec bins | Bins with >0 counts | Bins with >2000 counts | High rate bins dominated by noise | Noise dominated (total time) | Noise dominated (detector-on time) | Marked lightcurve |
|---|---|---|---|---|---|---|---|
| A | 8723 | 5738 | 17 | 17 | 0.19% | 0.30% | 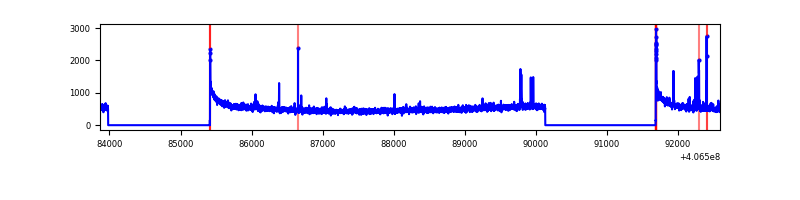 |
| B | 8723 | 5738 | 156 | 156 | 1.79% | 2.72% | 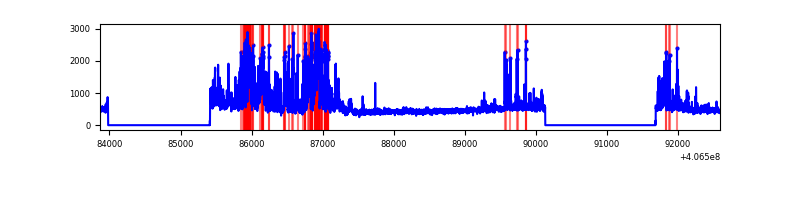 |
| C | 8723 | 5738 | 9 | 9 | 0.10% | 0.16% | 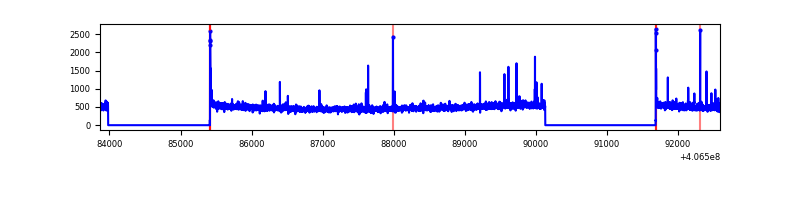 |
| D | 8723 | 5738 | 705 | 705 | 8.08% | 12.29% | 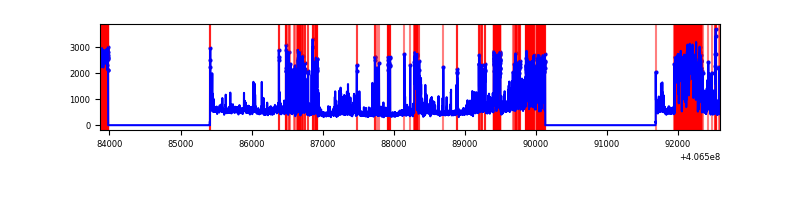 |
Top three noisy pixels from each quadrant. If the there are fewer than three noisy pixels in the level2.evt file, extra rows are filled as -1
| Pixel properties | Quadrant properties | ||||||
|---|---|---|---|---|---|---|---|
| Quadrant | DetID | PixID | Counts | Sigma | Mean | Median | Sigma |
| A | 10 | 83 | 435043 | 3250.35 | 653 | 640 | 133.6 |
| A | 9 | 143 | 45652 | 336.8 | 653 | 640 | 133.6 |
| A | 13 | 248 | 24651 | 179.66 | 653 | 640 | 133.6 |
| B | 0 | 183 | 843986 | 6674.01 | 645 | 627 | 126.4 |
| B | 5 | 184 | 245159 | 1935.13 | 645 | 627 | 126.4 |
| B | 4 | 171 | 54760 | 428.39 | 645 | 627 | 126.4 |
| C | 15 | 214 | 230414 | 1523.01 | 642 | 647 | 150.9 |
| C | 14 | 254 | 43294 | 282.69 | 642 | 647 | 150.9 |
| C | 0 | 10 | 28899 | 187.27 | 642 | 647 | 150.9 |
| D | 2 | 249 | 1002230 | 6751.28 | 600 | 583 | 148.4 |
| D | 12 | 227 | 666792 | 4490.37 | 600 | 583 | 148.4 |
| D | 13 | 249 | 198862 | 1336.44 | 600 | 583 | 148.4 |
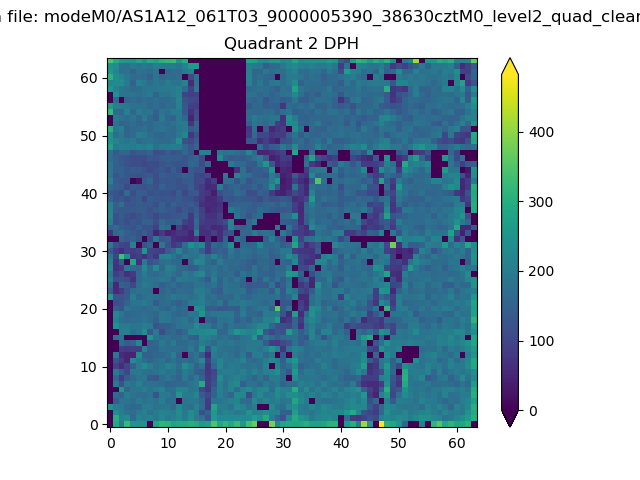
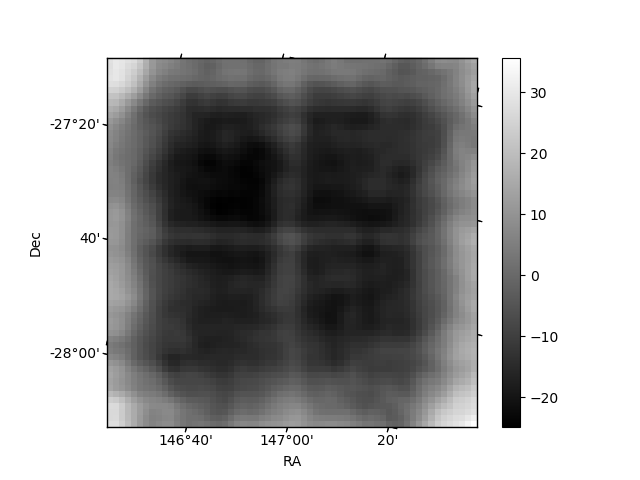
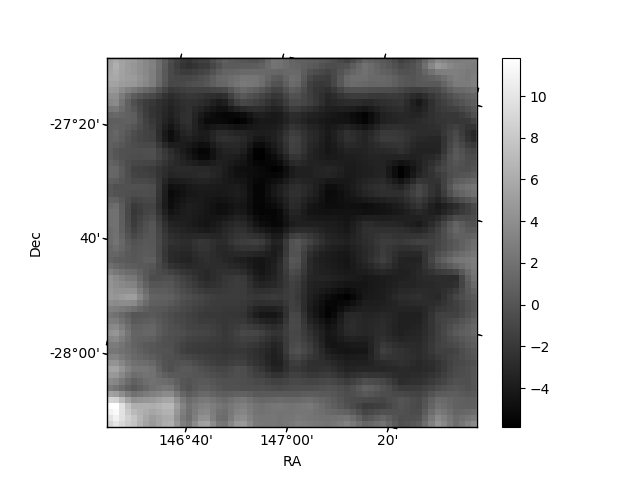
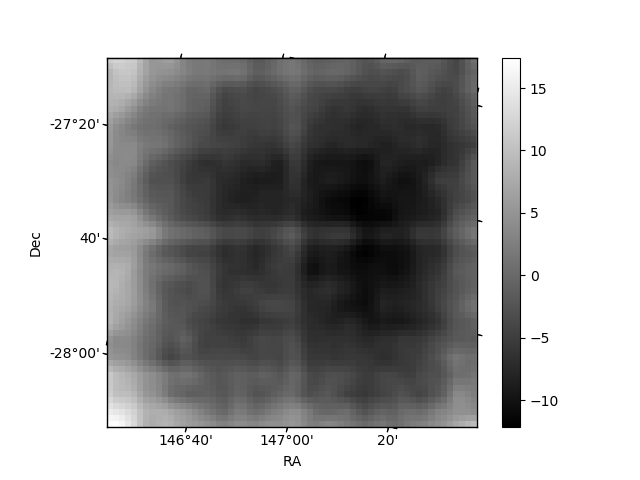
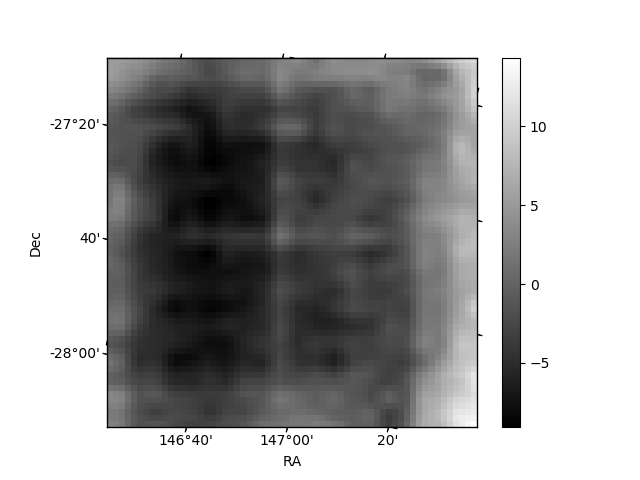
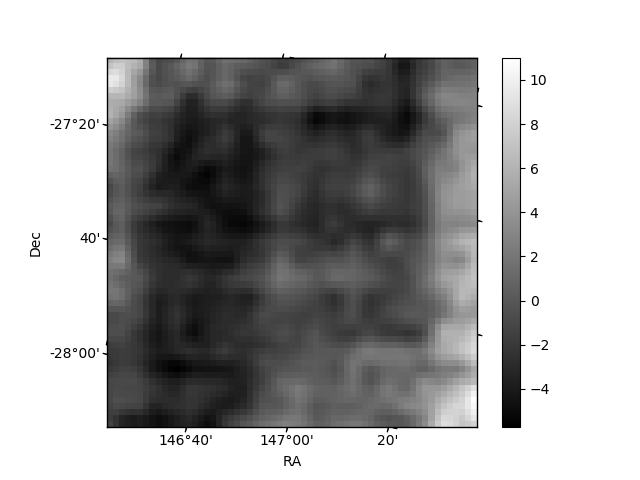
Histogram calculated using DETX and DETY for each event in the final _common_clean file
| Quadrant A | 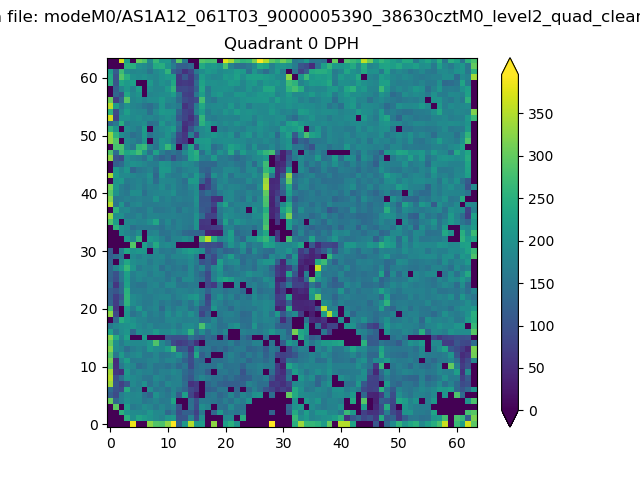 |
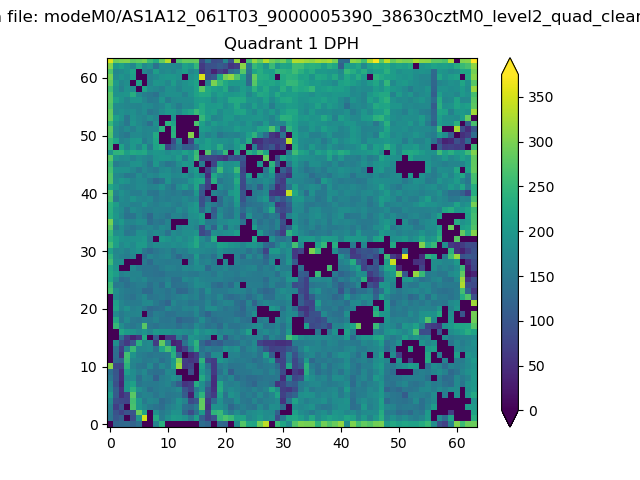 |
Quadrant B |
|---|---|---|---|
| Quadrant D | 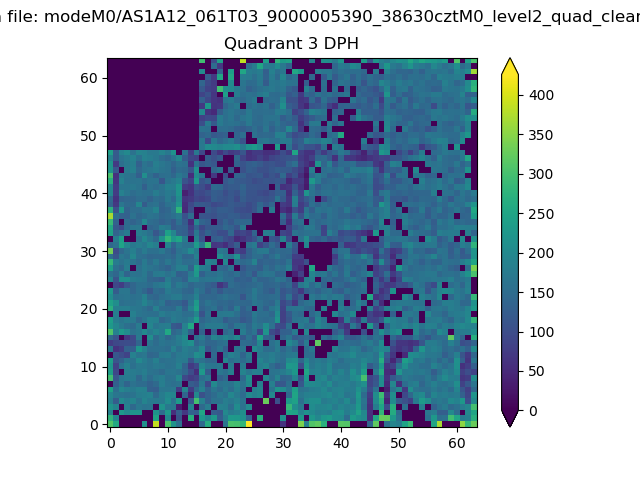 |
 |
Quadrant C |
| Plot type | Count rate plots | Images |
|---|---|---|
| Comparison with Poisson distribution Blue bars denote a histogram of data divided into 1 sec bins. Red curve is a Poisson curve with rate = median count rate of data. |
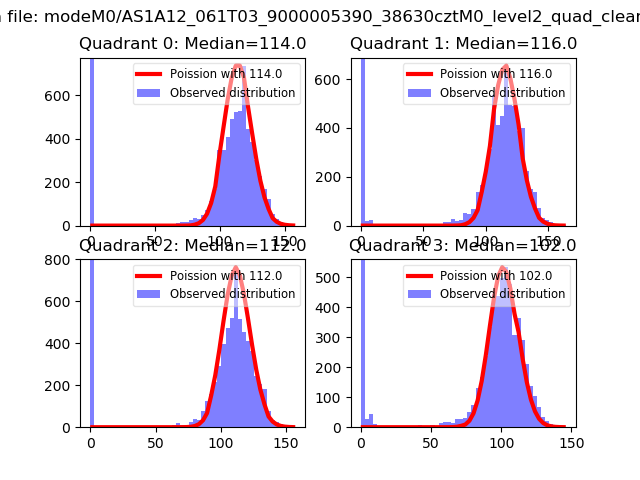 |
 |
| Quadrant-wise count rates Data is divided into 100 sec bins |
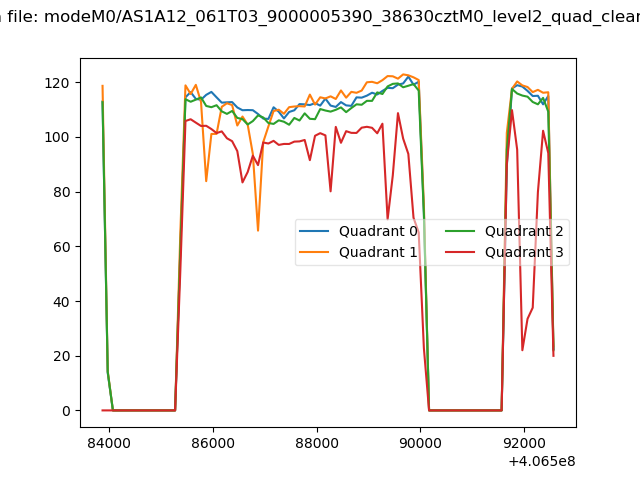 |
|
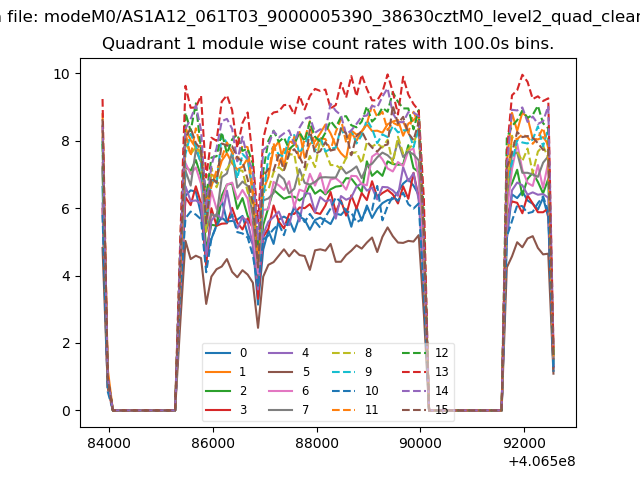
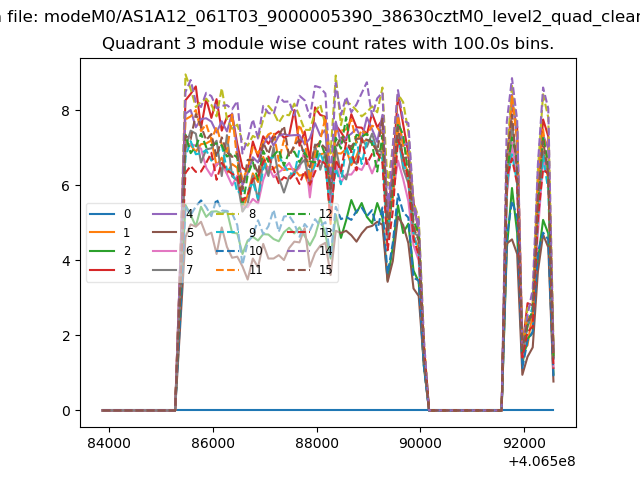
| Module-wise count rates for Quadrant A Data is divided into 100 sec bins |
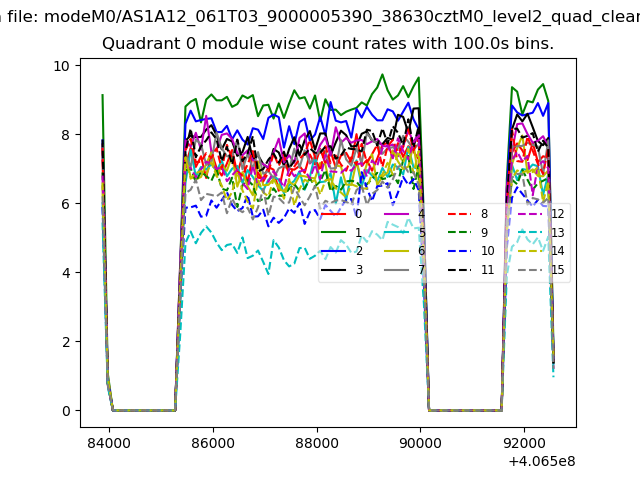 |
 |
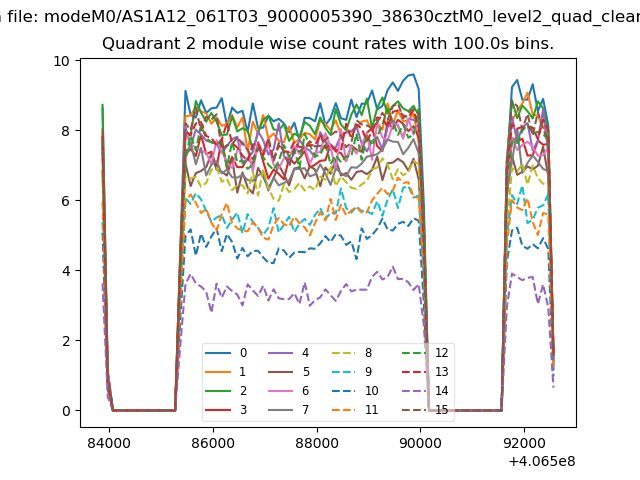
| Module-wise count rates for Quadrant B Data is divided into 100 sec bins |
 |
 |
| Module-wise count rates for Quadrant C Data is divided into 100 sec bins |
 |
 |
| Module-wise count rates for Quadrant D Data is divided into 100 sec bins |
 |
 |
| Parameter | Plot |
|---|---|
| CZT HV Monitor | 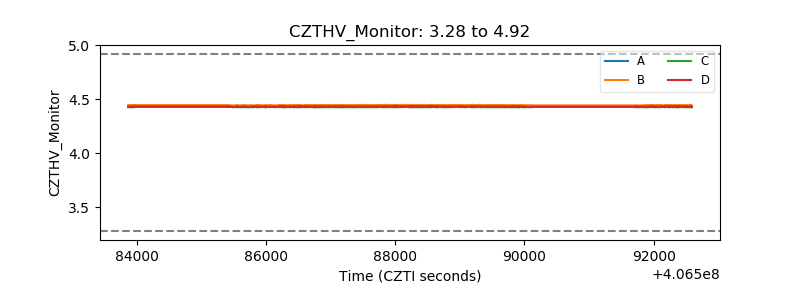 |
| D_VDD | 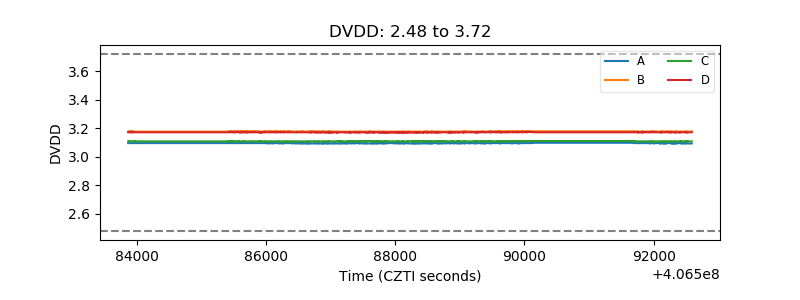 |
| Temperature 1 | 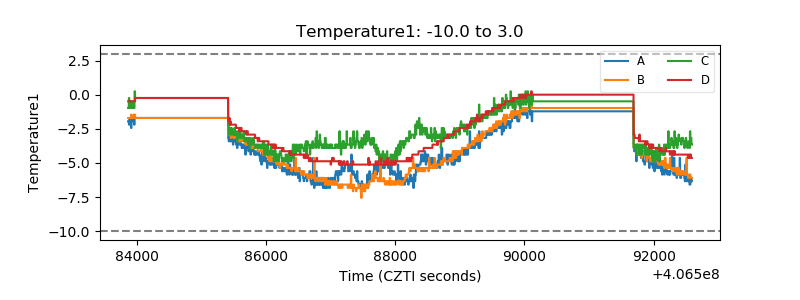 |
| Veto HV Monitor | 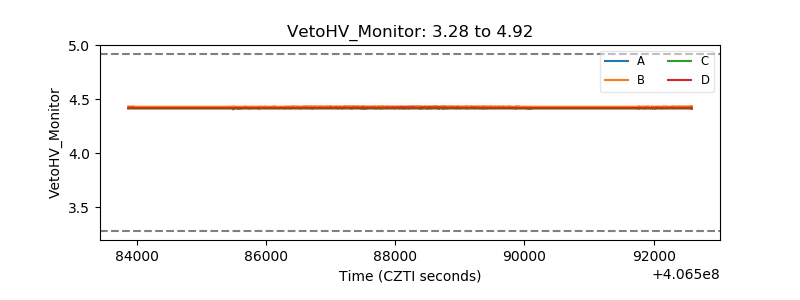 |
| Veto LLD | 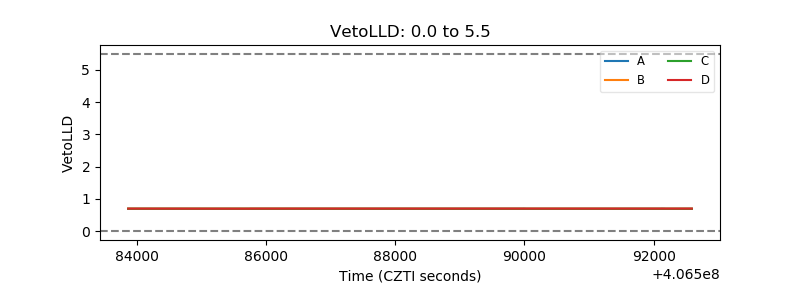 |
| Alpha Counter | 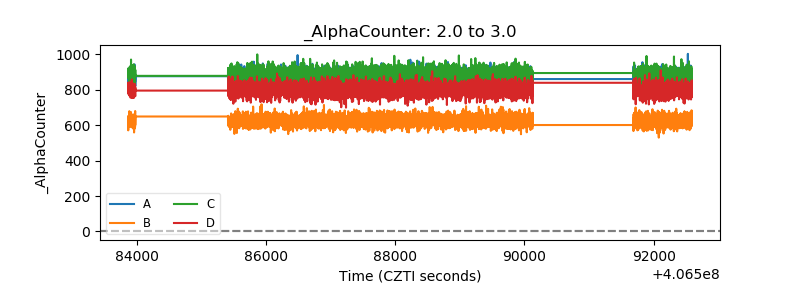 |
| _CPM_Rate | 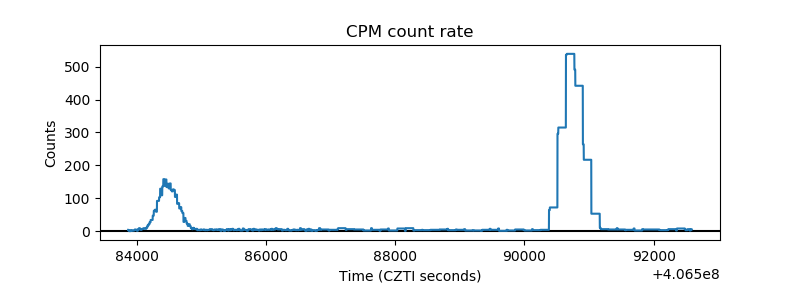 |
| CZT Counter | 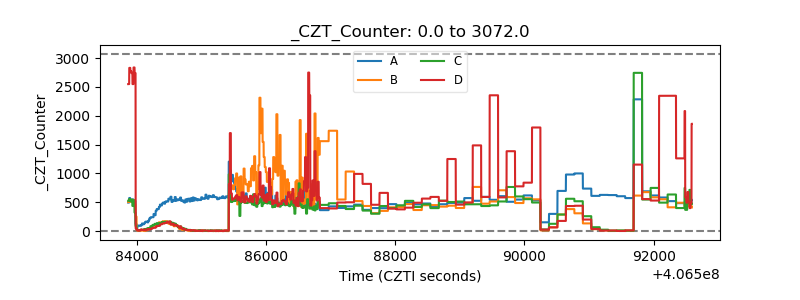 |
| +2.5 Volts monitor |  |
| +5 Volts monitor | 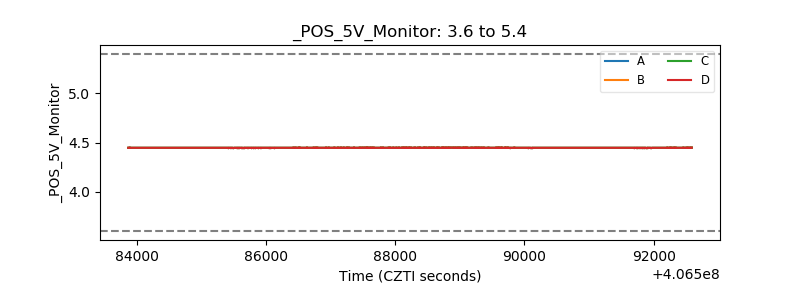 |
| _ROLL_ROT | 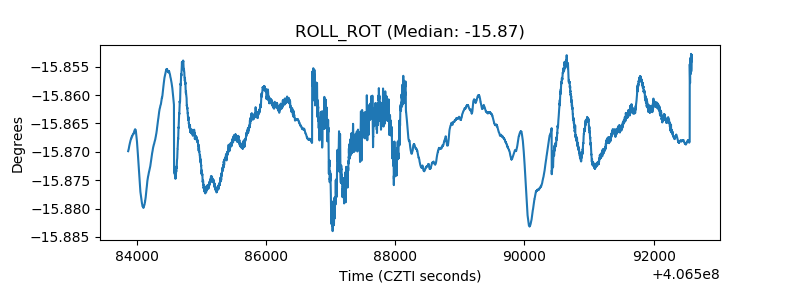 |
| _Roll_DEC | 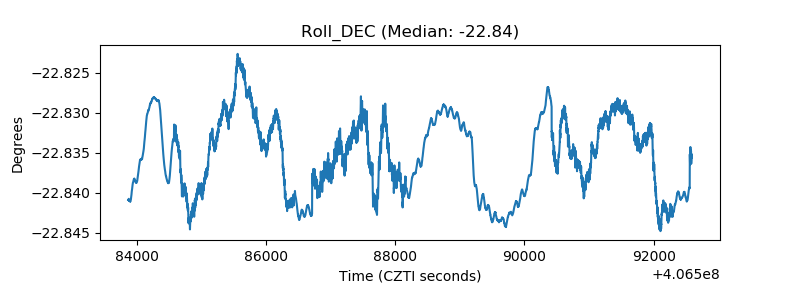 |
| _Roll_RA | 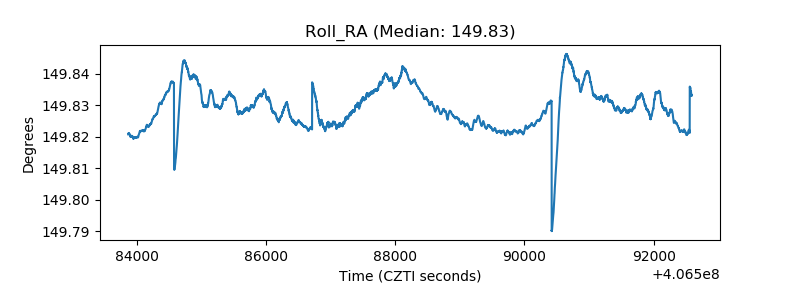 |
| Veto Counter | 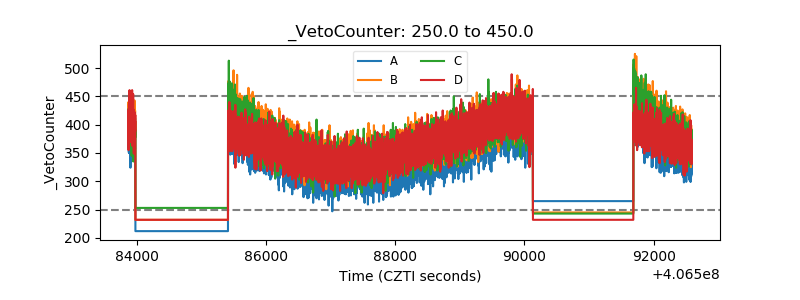 |