| Param | Original file | Final file |
|---|---|---|
| Filename | modeM0/AS1A12_061T03_9000005390_38631cztM0_level2.fits | modeM0/AS1A12_061T03_9000005390_38631cztM0_level2_quad_clean.evt |
| Size (bytes) | 410,757,120 | 93,415,680 |
| Size | 391.7 MB | 89.1 MB |
| Events in quadrant A | 3,050,875 | 641,550 |
| Events in quadrant B | 2,976,187 | 656,341 |
| Events in quadrant C | 2,822,769 | 630,877 |
| Events in quadrant D | 5,920,259 | 508,557 |
| Mode SS | |||
|---|---|---|---|
| Quadrant | BADHDUFLAG | Total packets | Discarded packets |
| A | 0 | 116 | 0 |
| B | 0 | 116 | 0 |
| C | 0 | 116 | 0 |
| D | 0 | 116 | 0 |
| Mode M9 | |||
|---|---|---|---|
| Quadrant | BADHDUFLAG | Total packets | Discarded packets |
| A | 0 | 32 | 0 |
| B | 0 | 32 | 0 |
| C | 0 | 32 | 0 |
| D | 0 | 32 | 0 |
| Mode M0 | |||
|---|---|---|---|
| Quadrant | BADHDUFLAG | Total packets | Discarded packets |
| A | 0 | 12609 | 3 |
| B | 0 | 12539 | 2 |
| C | 0 | 11767 | 2 |
| D | 0 | 21525 | 2 |
| Quadrant | Total seconds | Saturated seconds | Saturation percentage |
|---|---|---|---|
| A | 5591 | 46 | 0.822751% |
| B | 5591 | 66 | 1.180469% |
| C | 5591 | 23 | 0.411375% |
| D | 5591 | 891 | 15.936326% |
Noise dominated data is calculated using 1-second bins in cleaned event files. If a bin has >2000 counts, and if more than 50% of those come from <1% of pixels, then it is considered to be noise-dominated and hence unusable.
| Quadrant | # 1 sec bins | Bins with >0 counts | Bins with >2000 counts | High rate bins dominated by noise | Noise dominated (total time) | Noise dominated (detector-on time) | Marked lightcurve |
|---|---|---|---|---|---|---|---|
| A | 8818 | 5593 | 24 | 24 | 0.27% | 0.43% | 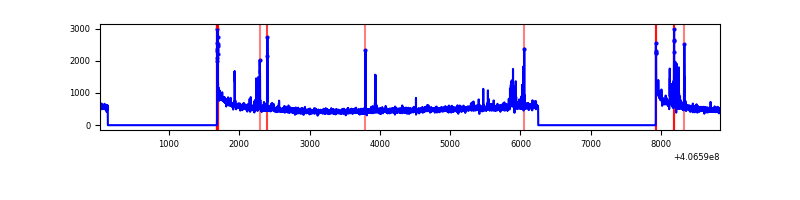 |
| B | 8818 | 5593 | 23 | 23 | 0.26% | 0.41% | 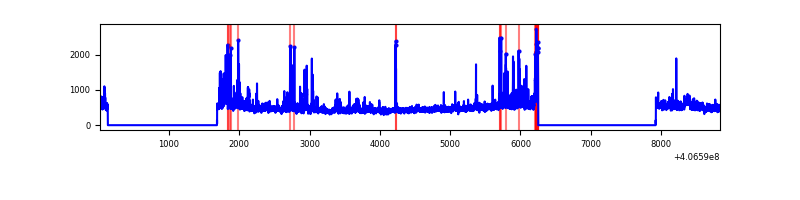 |
| C | 8818 | 5593 | 15 | 15 | 0.17% | 0.27% | 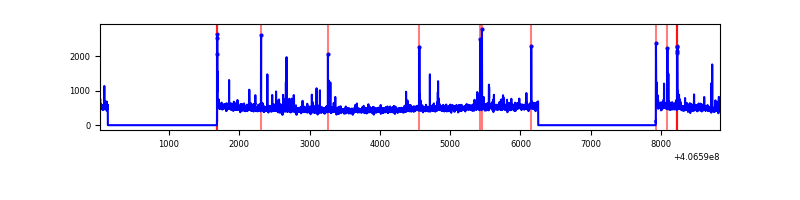 |
| D | 8818 | 5593 | 808 | 808 | 9.16% | 14.45% | 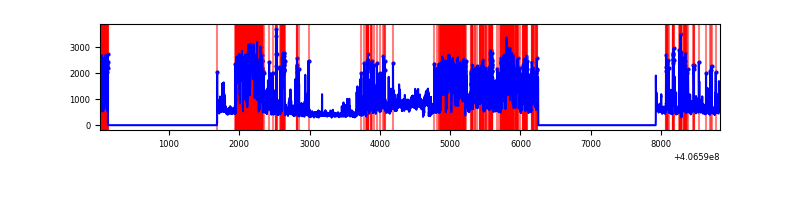 |
Top three noisy pixels from each quadrant. If the there are fewer than three noisy pixels in the level2.evt file, extra rows are filled as -1
| Pixel properties | Quadrant properties | ||||||
|---|---|---|---|---|---|---|---|
| Quadrant | DetID | PixID | Counts | Sigma | Mean | Median | Sigma |
| A | 10 | 83 | 420156 | 3242.97 | 635 | 623 | 129.4 |
| A | 9 | 143 | 92096 | 707.08 | 635 | 623 | 129.4 |
| A | 13 | 248 | 40846 | 310.92 | 635 | 623 | 129.4 |
| B | 0 | 183 | 234512 | 1883.2 | 638 | 621 | 124.2 |
| B | 0 | 155 | 79992 | 639.07 | 638 | 621 | 124.2 |
| B | 5 | 184 | 46457 | 369.05 | 638 | 621 | 124.2 |
| C | 15 | 214 | 226166 | 1522.67 | 629 | 636 | 148.1 |
| C | 14 | 254 | 100976 | 677.45 | 629 | 636 | 148.1 |
| C | 0 | 10 | 19356 | 126.39 | 629 | 636 | 148.1 |
| D | 2 | 249 | 1911386 | 13262.05 | 585 | 569 | 144.1 |
| D | 15 | 0 | 642453 | 4455.01 | 585 | 569 | 144.1 |
| D | 13 | 249 | 336568 | 2332.01 | 585 | 569 | 144.1 |
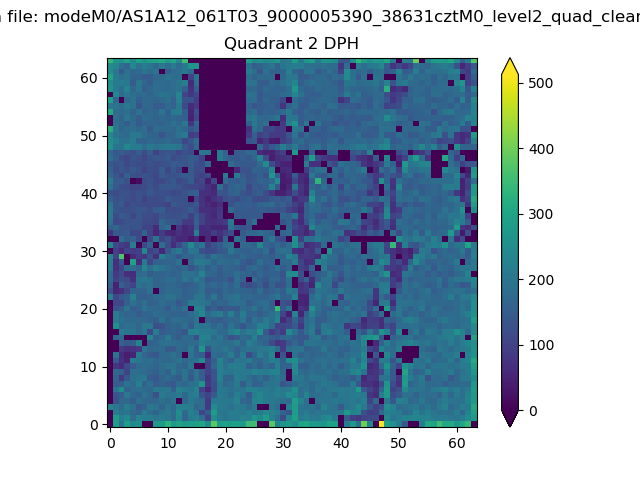
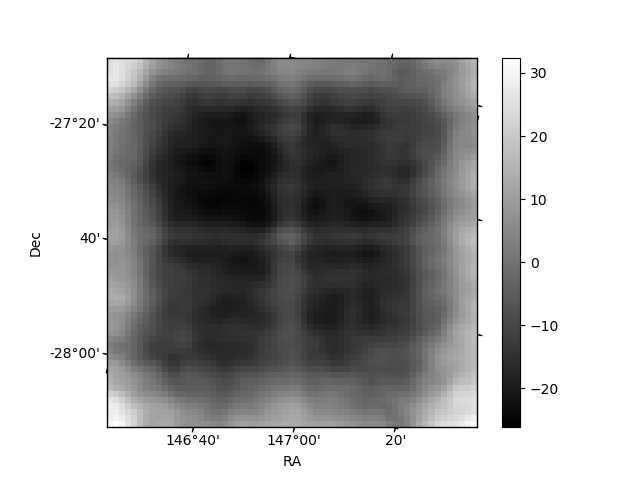
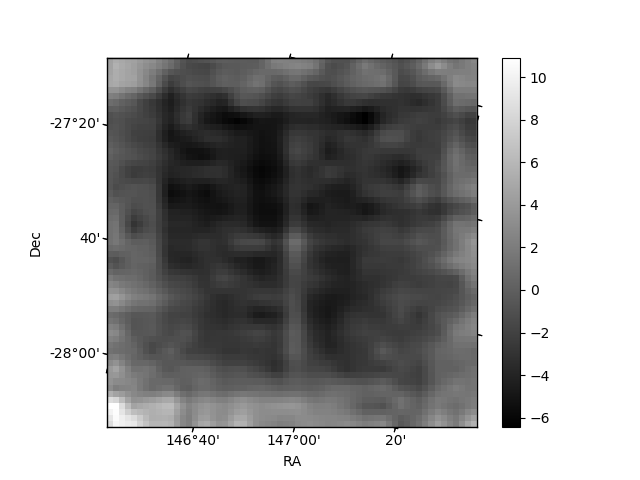
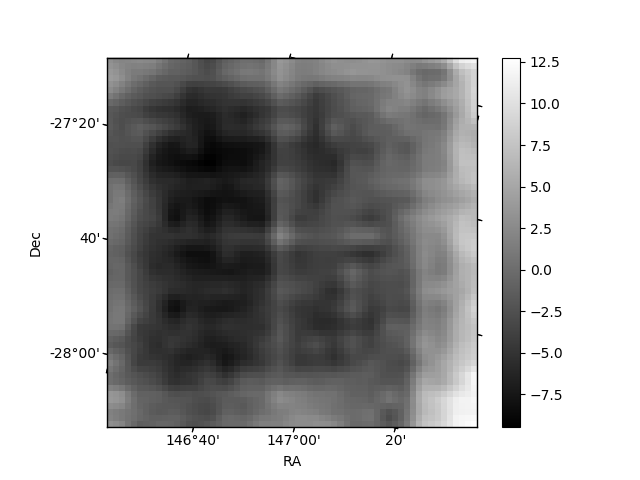
Histogram calculated using DETX and DETY for each event in the final _common_clean file
| Quadrant A | 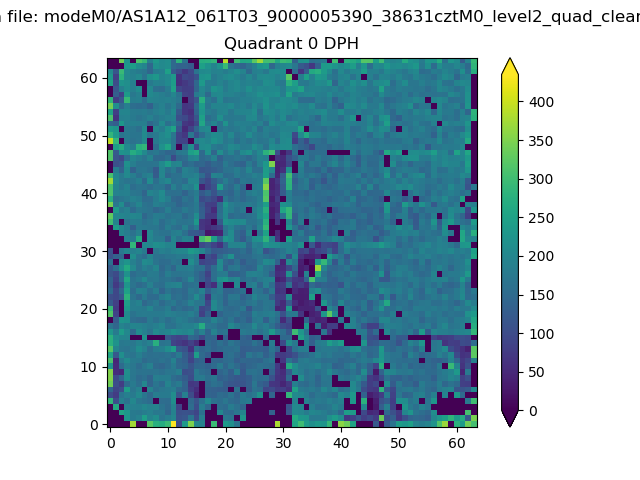 |
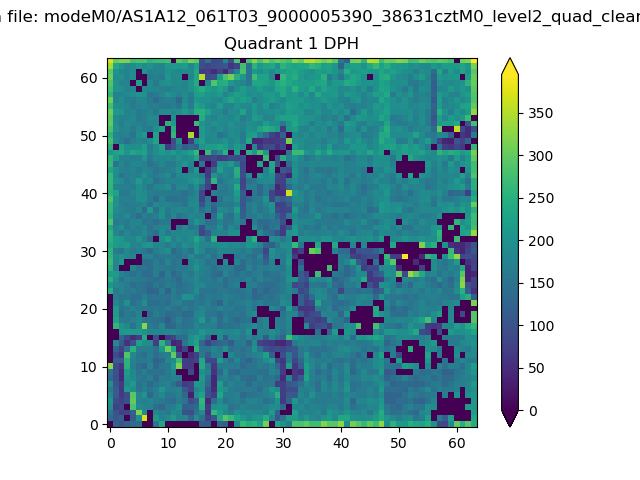 |
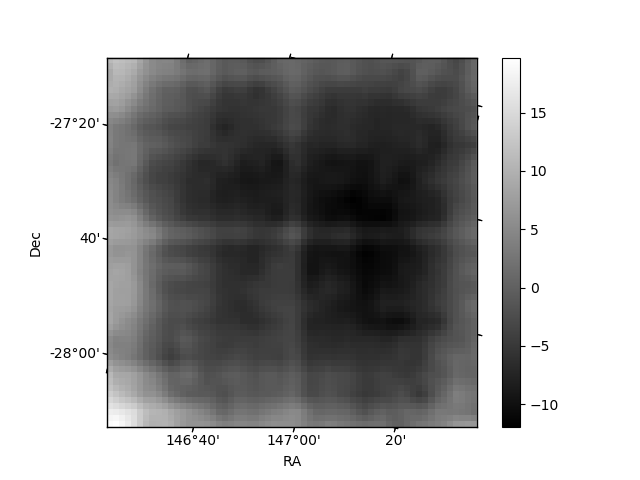
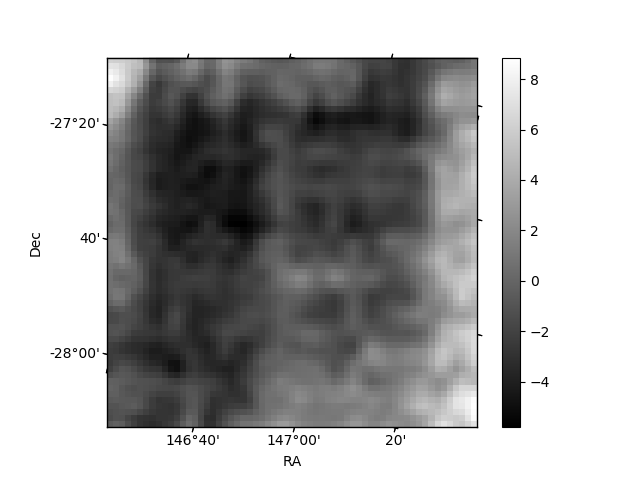
Quadrant B |
|---|---|---|---|
| Quadrant D | 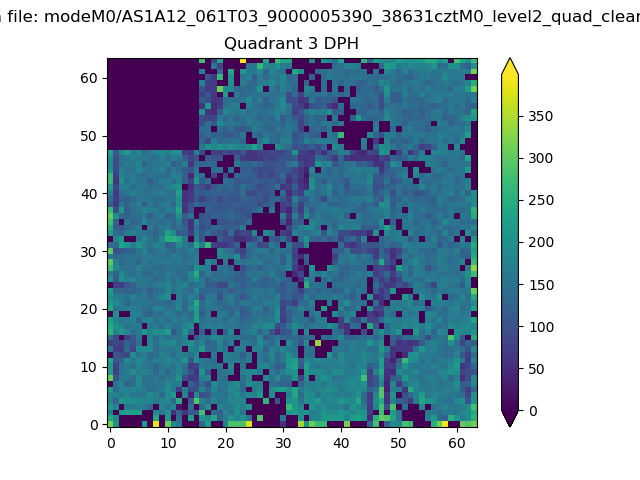 |
 |
Quadrant C |
| Plot type | Count rate plots | Images |
|---|---|---|
| Comparison with Poisson distribution Blue bars denote a histogram of data divided into 1 sec bins. Red curve is a Poisson curve with rate = median count rate of data. |
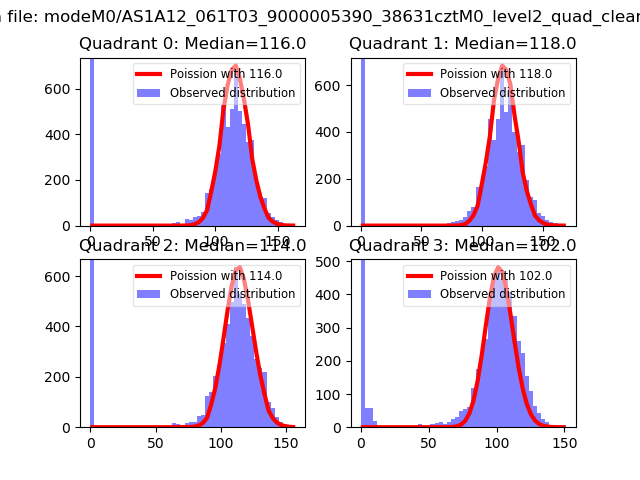 |
 |
| Quadrant-wise count rates Data is divided into 100 sec bins |
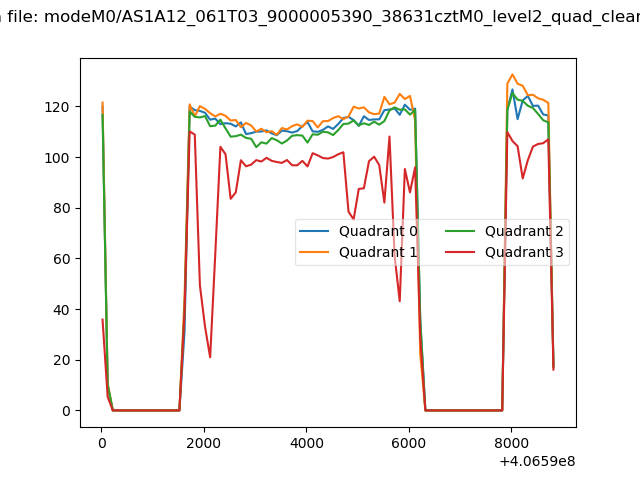 |
|
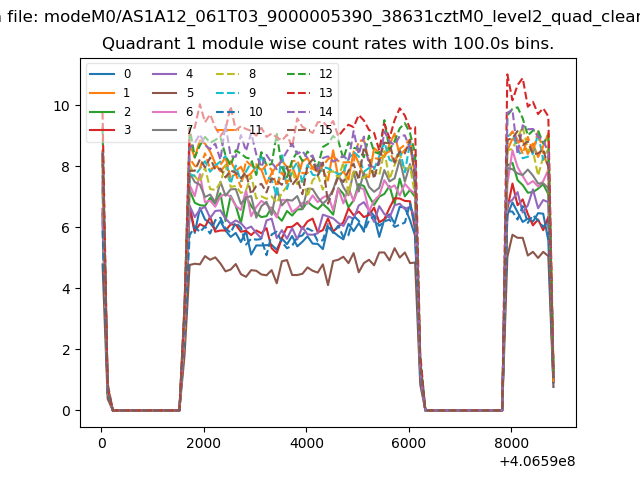
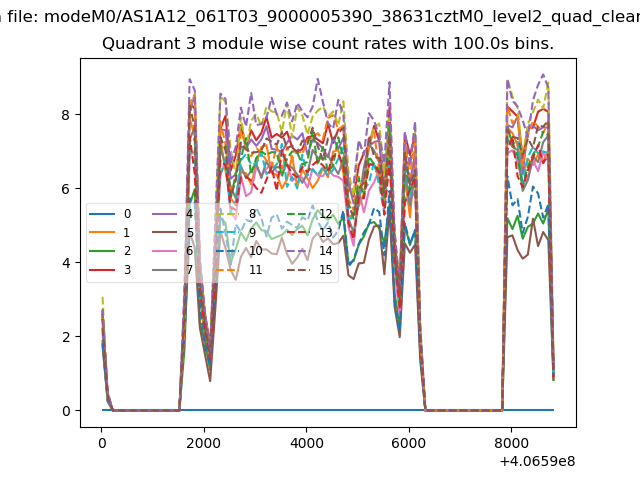
| Module-wise count rates for Quadrant A Data is divided into 100 sec bins |
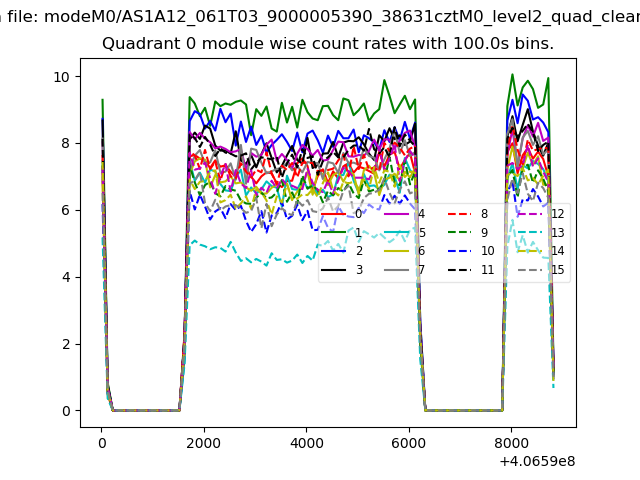 |
 |
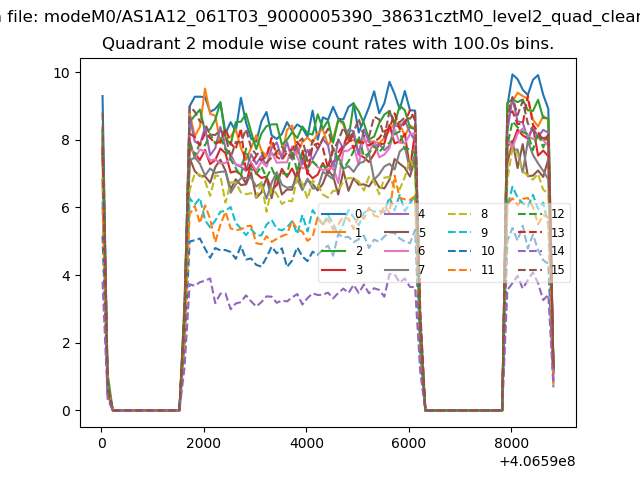
| Module-wise count rates for Quadrant B Data is divided into 100 sec bins |
 |
 |
| Module-wise count rates for Quadrant C Data is divided into 100 sec bins |
 |
 |
| Module-wise count rates for Quadrant D Data is divided into 100 sec bins |
 |
 |
| Parameter | Plot |
|---|---|
| CZT HV Monitor | 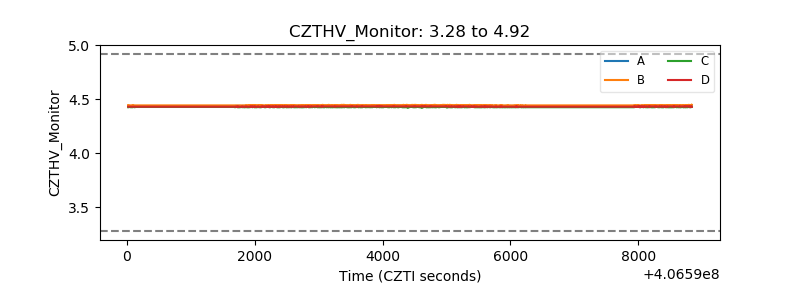 |
| D_VDD | 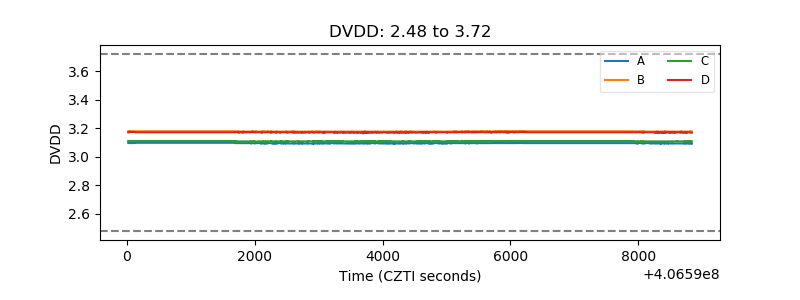 |
| Temperature 1 | 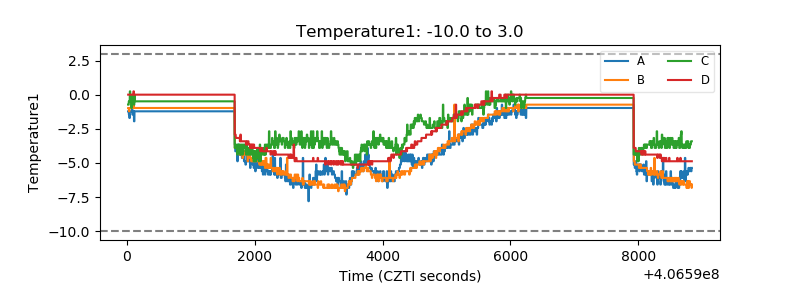 |
| Veto HV Monitor | 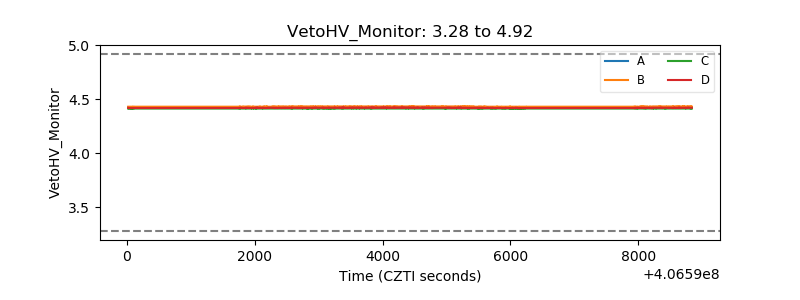 |
| Veto LLD | 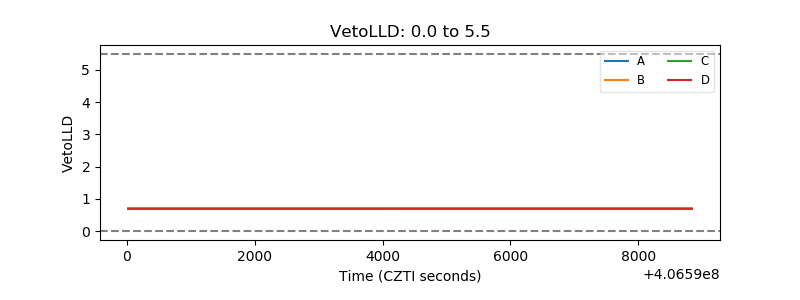 |
| Alpha Counter | 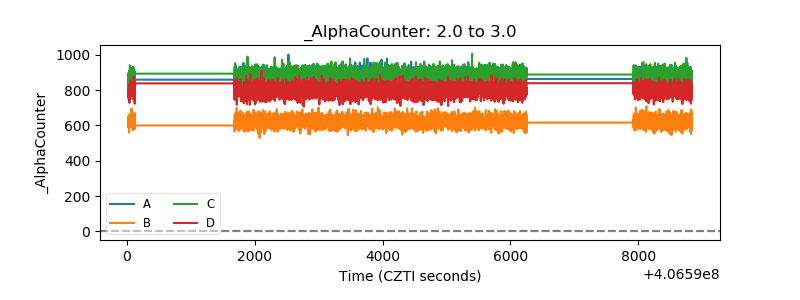 |
| _CPM_Rate | 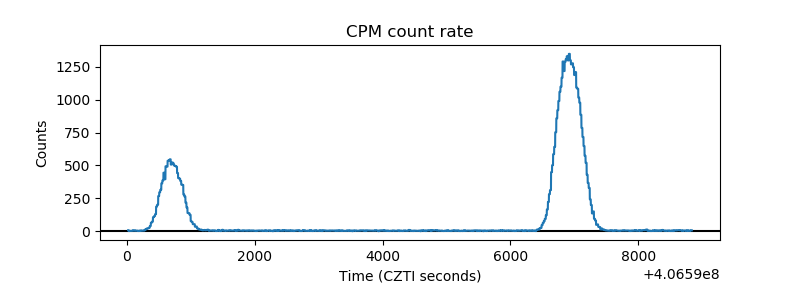 |
| CZT Counter | 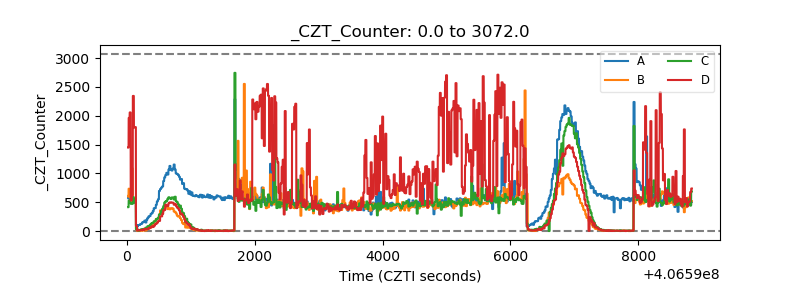 |
| +2.5 Volts monitor | 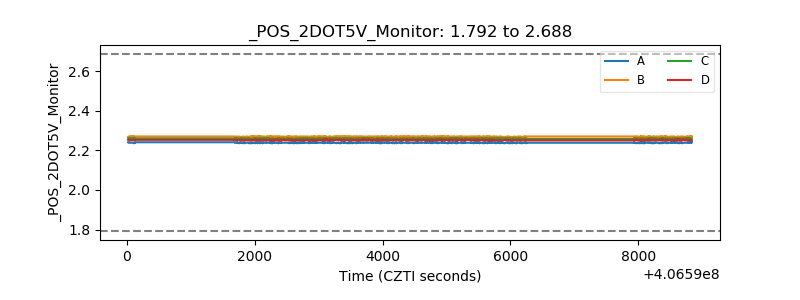 |
| +5 Volts monitor | 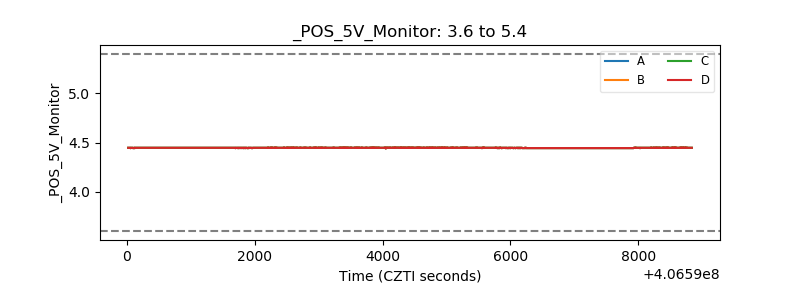 |
| _ROLL_ROT | 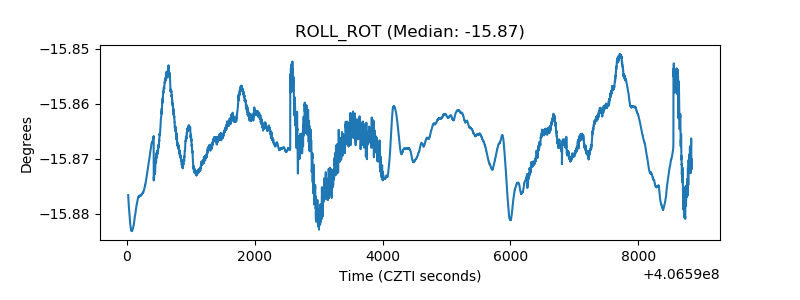 |
| _Roll_DEC | 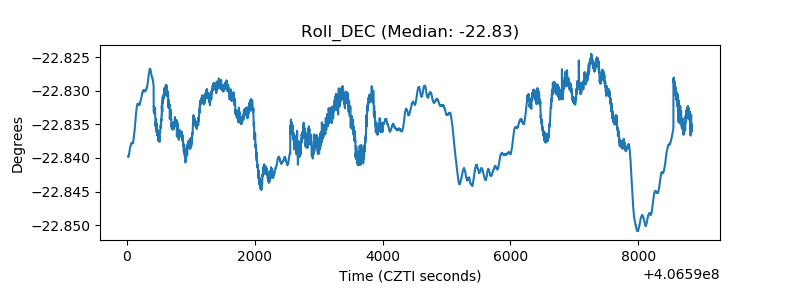 |
| _Roll_RA | 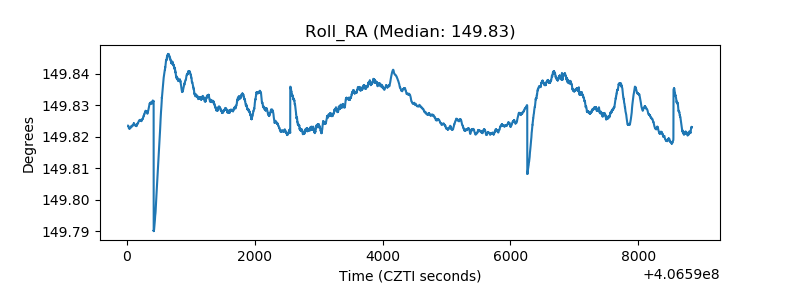 |
| Veto Counter | 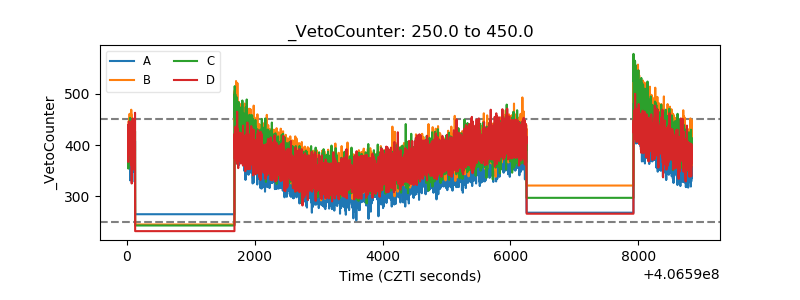 |