| Param | Original file | Final file |
|---|---|---|
| Filename | modeM0/AS1A12_061T03_9000005390_38633cztM0_level2.fits | modeM0/AS1A12_061T03_9000005390_38633cztM0_level2_quad_clean.evt |
| Size (bytes) | 378,679,680 | 100,319,040 |
| Size | 361.1 MB | 95.7 MB |
| Events in quadrant A | 3,079,728 | 676,939 |
| Events in quadrant B | 2,912,423 | 700,019 |
| Events in quadrant C | 2,927,887 | 667,851 |
| Events in quadrant D | 4,654,735 | 595,272 |
| Mode SS | |||
|---|---|---|---|
| Quadrant | BADHDUFLAG | Total packets | Discarded packets |
| A | 0 | 114 | 0 |
| B | 0 | 114 | 0 |
| C | 0 | 114 | 0 |
| D | 0 | 114 | 0 |
| Mode M9 | |||
|---|---|---|---|
| Quadrant | BADHDUFLAG | Total packets | Discarded packets |
| A | 0 | 26 | 0 |
| B | 0 | 26 | 0 |
| C | 0 | 26 | 0 |
| D | 0 | 27 | 0 |
| Mode M0 | |||
|---|---|---|---|
| Quadrant | BADHDUFLAG | Total packets | Discarded packets |
| A | 0 | 12690 | 3 |
| B | 0 | 12311 | 2 |
| C | 0 | 12089 | 2 |
| D | 0 | 17767 | 2 |
| Quadrant | Total seconds | Saturated seconds | Saturation percentage |
|---|---|---|---|
| A | 5692 | 29 | 0.509487% |
| B | 5692 | 14 | 0.245959% |
| C | 5692 | 22 | 0.386507% |
| D | 5692 | 263 | 4.620520% |
Noise dominated data is calculated using 1-second bins in cleaned event files. If a bin has >2000 counts, and if more than 50% of those come from <1% of pixels, then it is considered to be noise-dominated and hence unusable.
| Quadrant | # 1 sec bins | Bins with >0 counts | Bins with >2000 counts | High rate bins dominated by noise | Noise dominated (total time) | Noise dominated (detector-on time) | Marked lightcurve |
|---|---|---|---|---|---|---|---|
| A | 7484 | 5693 | 16 | 16 | 0.21% | 0.28% | 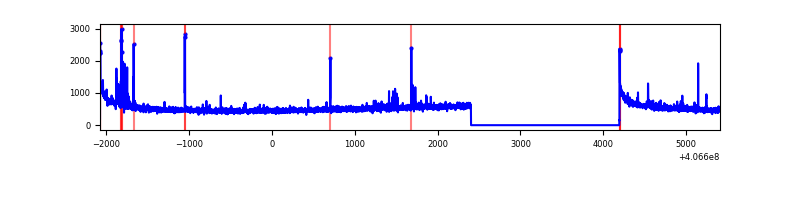 |
| B | 7484 | 5693 | 7 | 7 | 0.09% | 0.12% | 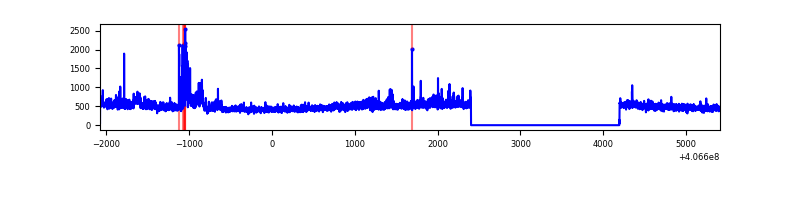 |
| C | 7484 | 5693 | 21 | 21 | 0.28% | 0.37% | 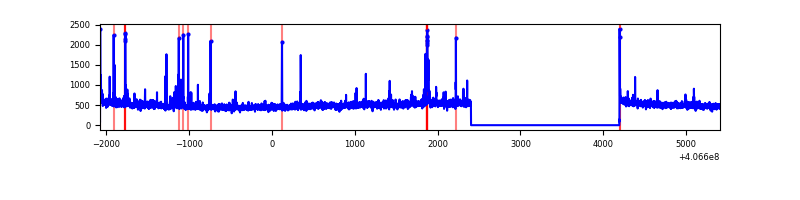 |
| D | 7484 | 5693 | 221 | 221 | 2.95% | 3.88% | 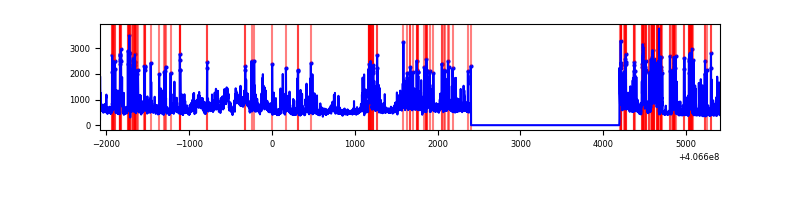 |
Top three noisy pixels from each quadrant. If the there are fewer than three noisy pixels in the level2.evt file, extra rows are filled as -1
| Pixel properties | Quadrant properties | ||||||
|---|---|---|---|---|---|---|---|
| Quadrant | DetID | PixID | Counts | Sigma | Mean | Median | Sigma |
| A | 10 | 83 | 421517 | 3162.23 | 652 | 641 | 133.1 |
| A | 9 | 143 | 76245 | 568.05 | 652 | 641 | 133.1 |
| A | 13 | 248 | 18643 | 135.26 | 652 | 641 | 133.1 |
| B | 5 | 184 | 160294 | 1269.5 | 658 | 642 | 125.8 |
| B | 0 | 155 | 99343 | 784.84 | 658 | 642 | 125.8 |
| B | 0 | 183 | 16719 | 127.84 | 658 | 642 | 125.8 |
| C | 15 | 214 | 229415 | 1505.17 | 648 | 653 | 152.0 |
| C | 14 | 254 | 89097 | 581.93 | 648 | 653 | 152.0 |
| C | 15 | 159 | 36724 | 237.33 | 648 | 653 | 152.0 |
| D | 2 | 249 | 671392 | 4356.77 | 632 | 617 | 154.0 |
| D | 2 | 16 | 361589 | 2344.56 | 632 | 617 | 154.0 |
| D | 13 | 249 | 325997 | 2113.38 | 632 | 617 | 154.0 |
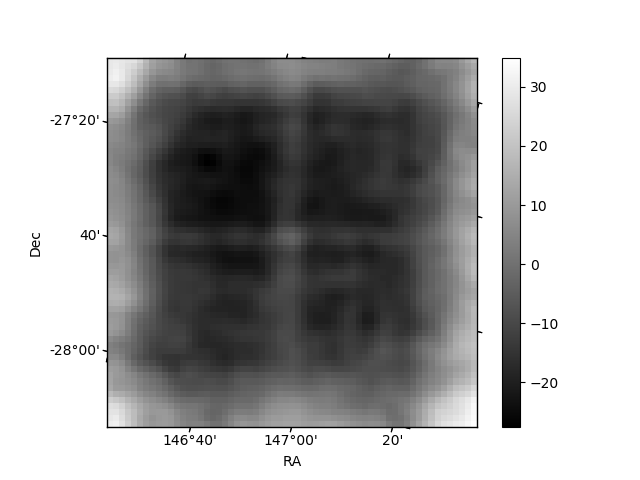
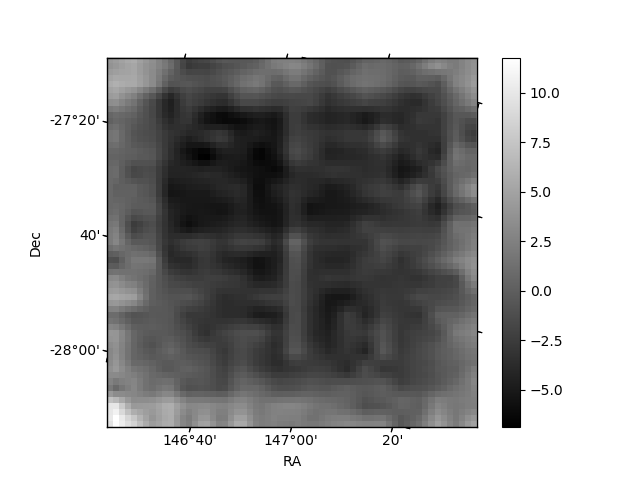
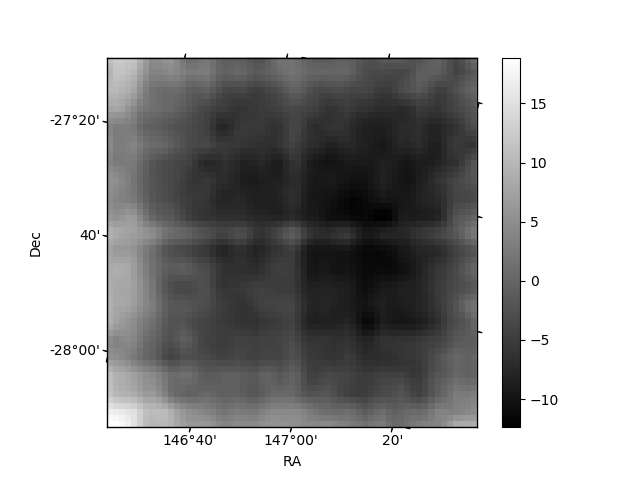
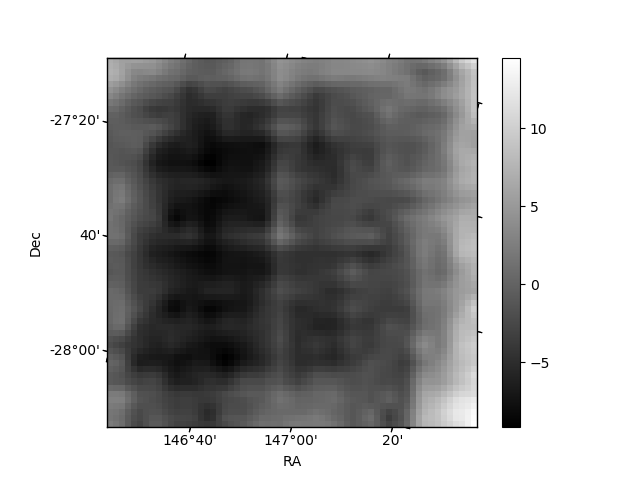
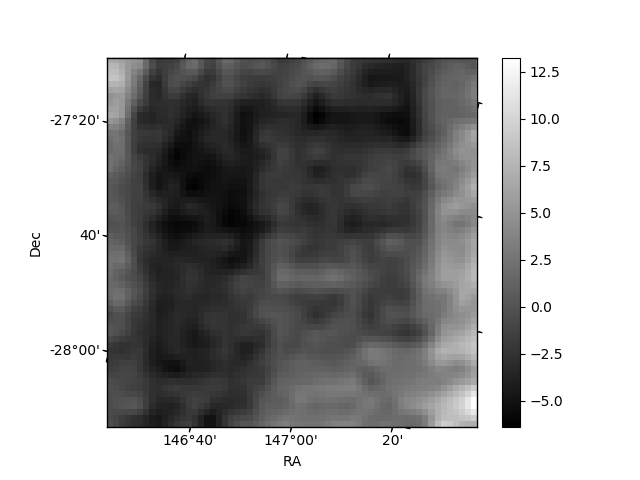
Histogram calculated using DETX and DETY for each event in the final _common_clean file
| Quadrant A | 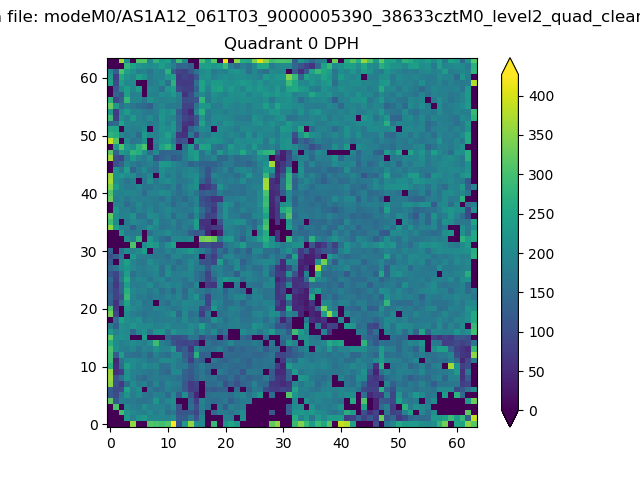 |
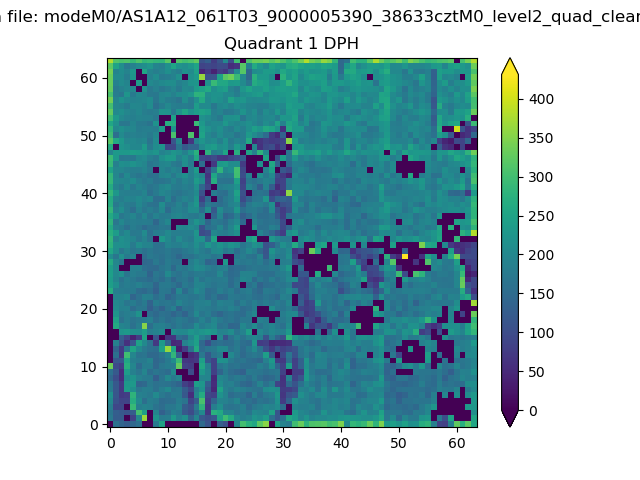 |
Quadrant B |
|---|---|---|---|
| Quadrant D | 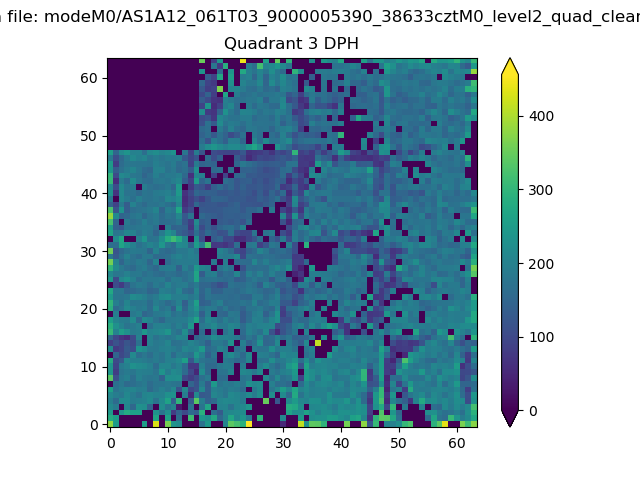 |
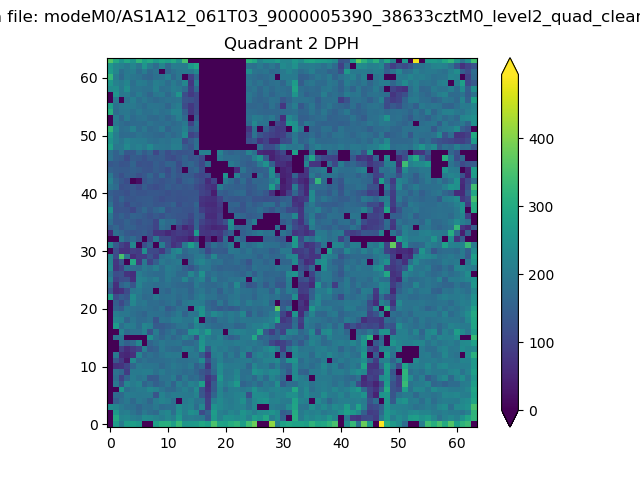 |
Quadrant C |
| Plot type | Count rate plots | Images |
|---|---|---|
| Comparison with Poisson distribution Blue bars denote a histogram of data divided into 1 sec bins. Red curve is a Poisson curve with rate = median count rate of data. |
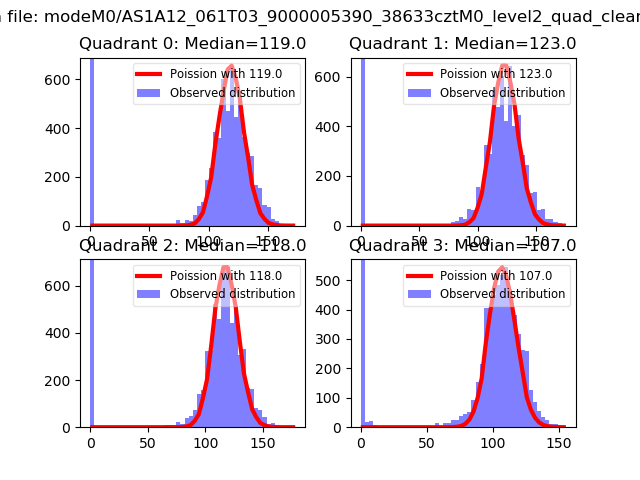 |
 |
| Quadrant-wise count rates Data is divided into 100 sec bins |
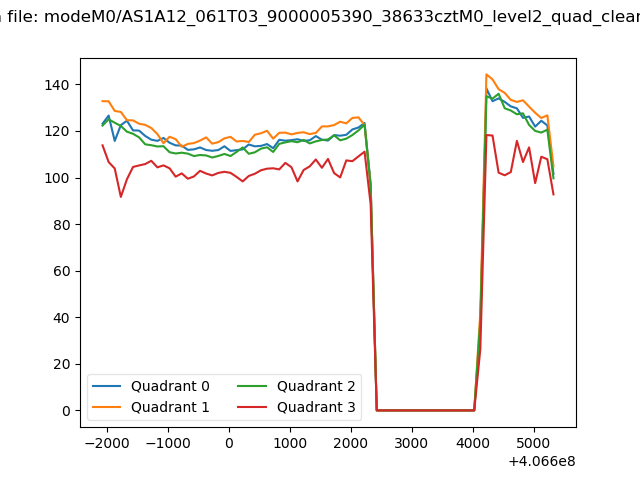 |
|
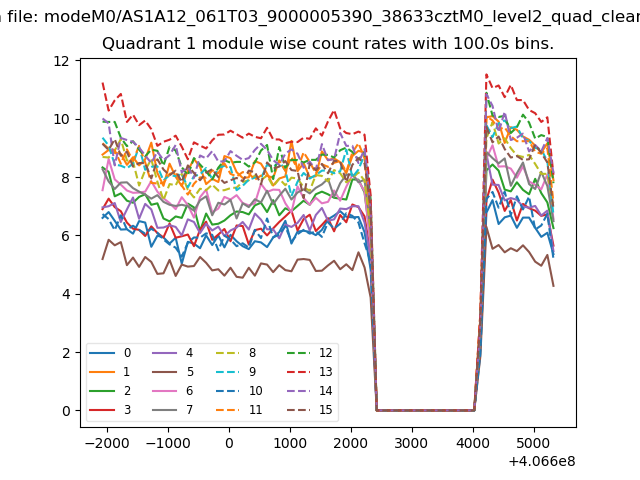
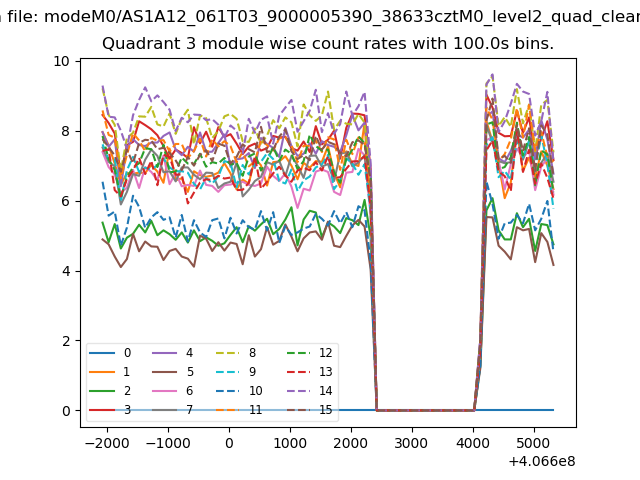
| Module-wise count rates for Quadrant A Data is divided into 100 sec bins |
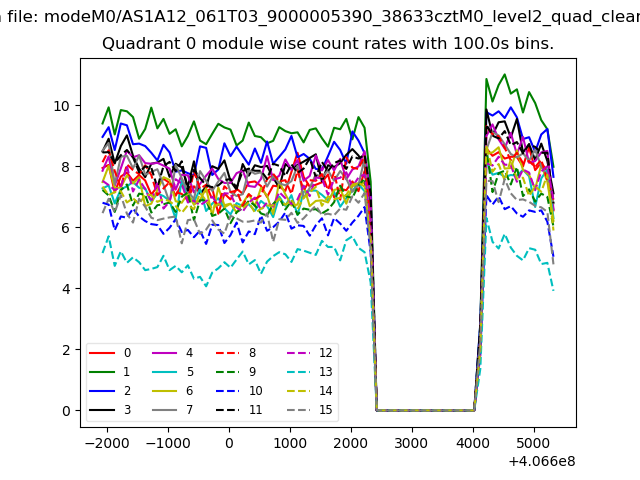 |
 |
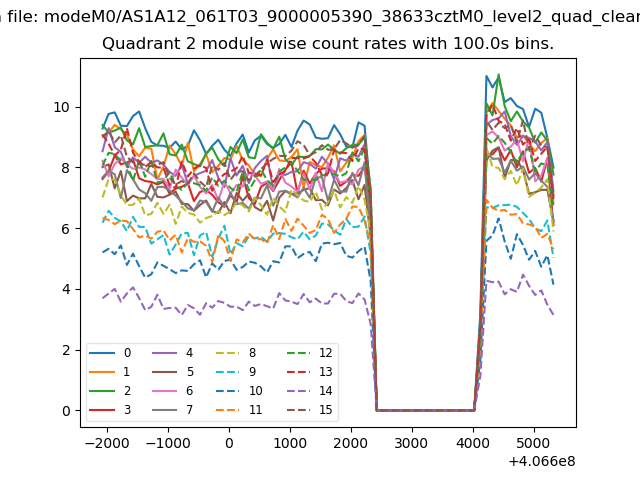
| Module-wise count rates for Quadrant B Data is divided into 100 sec bins |
 |
 |
| Module-wise count rates for Quadrant C Data is divided into 100 sec bins |
 |
 |
| Module-wise count rates for Quadrant D Data is divided into 100 sec bins |
 |
 |
| Parameter | Plot |
|---|---|
| CZT HV Monitor | 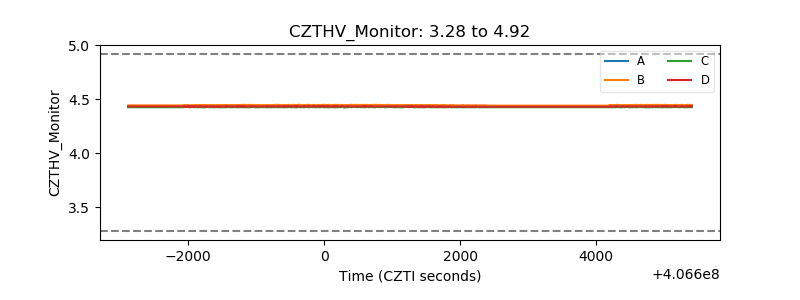 |
| D_VDD | 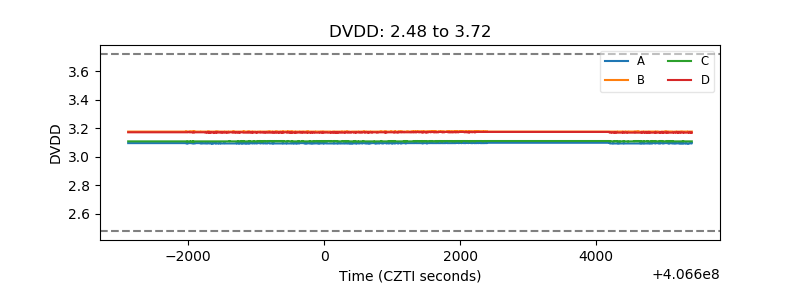 |
| Temperature 1 | 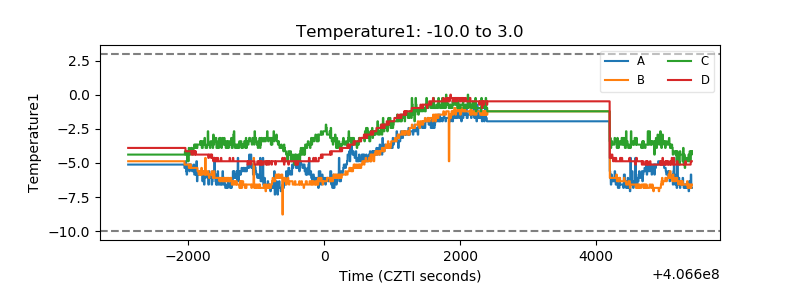 |
| Veto HV Monitor | 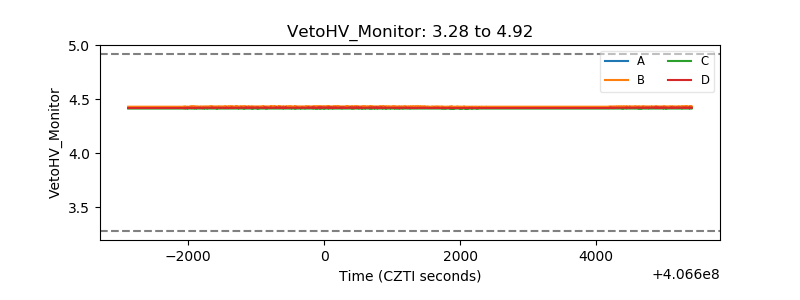 |
| Veto LLD | 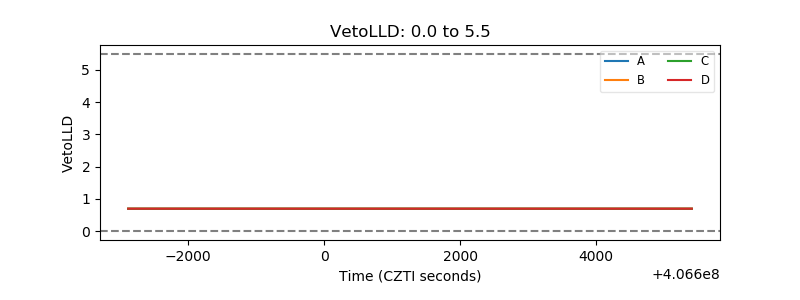 |
| Alpha Counter | 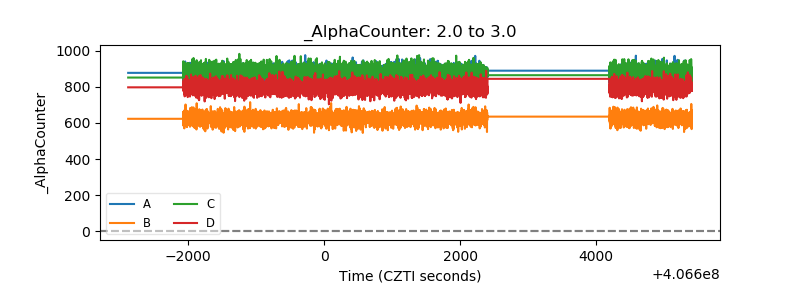 |
| _CPM_Rate | 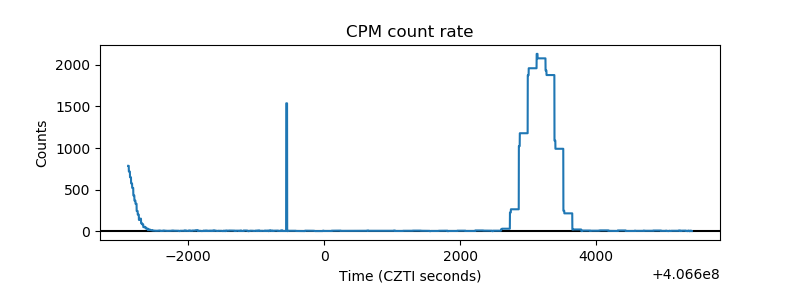 |
| CZT Counter | 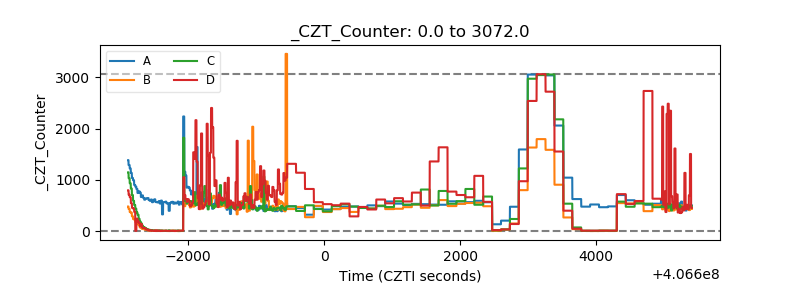 |
| +2.5 Volts monitor | 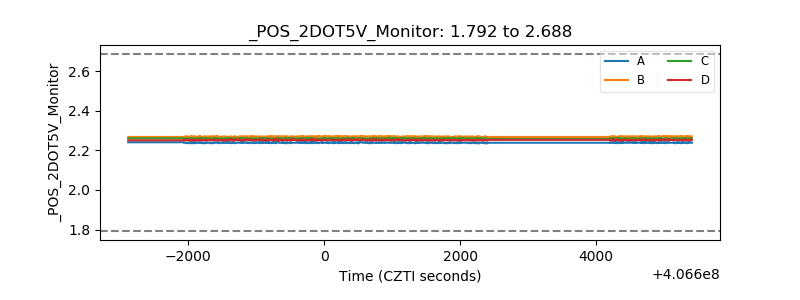 |
| +5 Volts monitor | 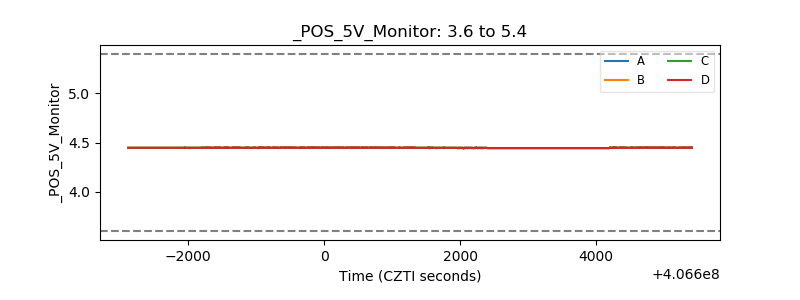 |
| _ROLL_ROT | 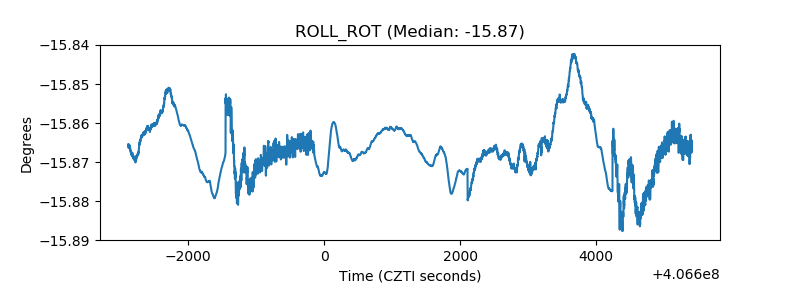 |
| _Roll_DEC | 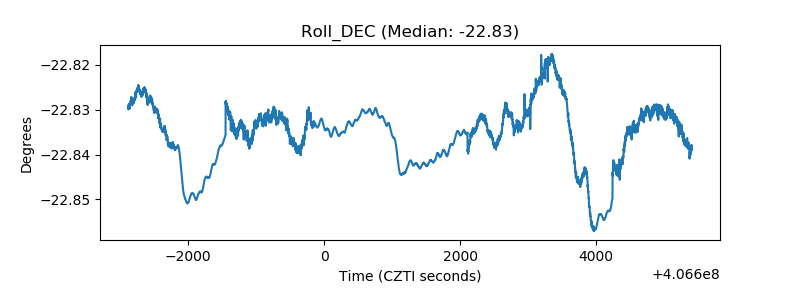 |
| _Roll_RA | 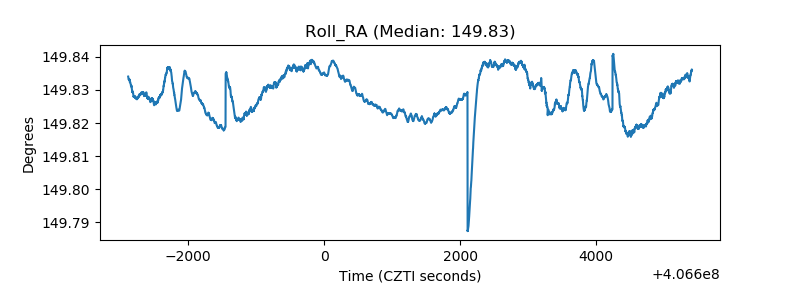 |
| Veto Counter | 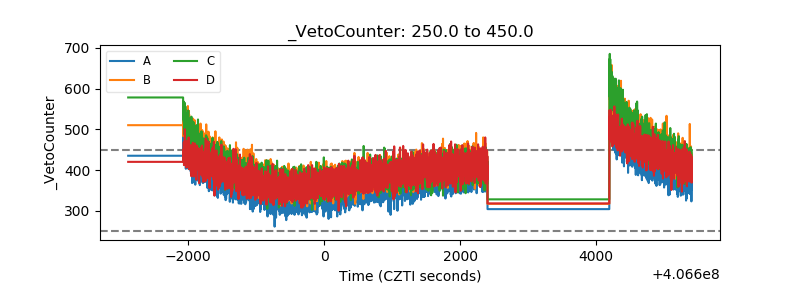 |