| Param | Original file | Final file |
|---|---|---|
| Filename | modeM0/AS1A12_061T03_9000005390_38634cztM0_level2.fits | modeM0/AS1A12_061T03_9000005390_38634cztM0_level2_quad_clean.evt |
| Size (bytes) | 369,063,360 | 100,327,680 |
| Size | 352.0 MB | 95.7 MB |
| Events in quadrant A | 3,043,934 | 681,522 |
| Events in quadrant B | 2,733,542 | 704,950 |
| Events in quadrant C | 2,887,309 | 677,879 |
| Events in quadrant D | 4,570,140 | 589,358 |
| Mode SS | |||
|---|---|---|---|
| Quadrant | BADHDUFLAG | Total packets | Discarded packets |
| A | 0 | 114 | 0 |
| B | 0 | 114 | 0 |
| C | 0 | 114 | 0 |
| D | 0 | 114 | 0 |
| Mode M9 | |||
|---|---|---|---|
| Quadrant | BADHDUFLAG | Total packets | Discarded packets |
| A | 0 | 30 | 0 |
| B | 0 | 30 | 0 |
| C | 0 | 30 | 0 |
| D | 0 | 31 | 0 |
| Mode M0 | |||
|---|---|---|---|
| Quadrant | BADHDUFLAG | Total packets | Discarded packets |
| A | 0 | 12419 | 3 |
| B | 0 | 11474 | 2 |
| C | 0 | 11746 | 2 |
| D | 0 | 17256 | 2 |
| Quadrant | Total seconds | Saturated seconds | Saturation percentage |
|---|---|---|---|
| A | 5483 | 24 | 0.437717% |
| B | 5483 | 24 | 0.437717% |
| C | 5483 | 7 | 0.127667% |
| D | 5483 | 376 | 6.857560% |
Noise dominated data is calculated using 1-second bins in cleaned event files. If a bin has >2000 counts, and if more than 50% of those come from <1% of pixels, then it is considered to be noise-dominated and hence unusable.
| Quadrant | # 1 sec bins | Bins with >0 counts | Bins with >2000 counts | High rate bins dominated by noise | Noise dominated (total time) | Noise dominated (detector-on time) | Marked lightcurve |
|---|---|---|---|---|---|---|---|
| A | 7426 | 5484 | 12 | 12 | 0.16% | 0.22% | 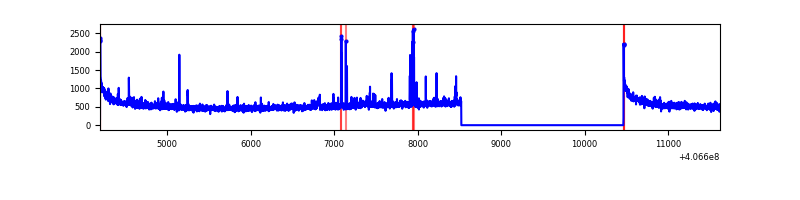 |
| B | 7426 | 5484 | 14 | 14 | 0.19% | 0.26% | 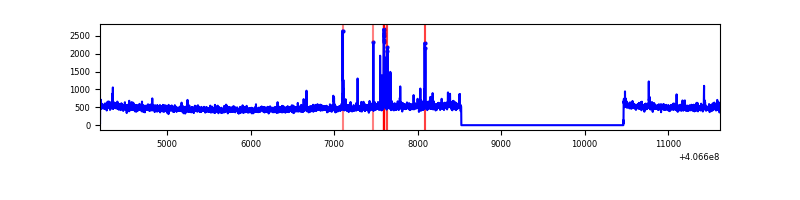 |
| C | 7426 | 5484 | 5 | 5 | 0.07% | 0.09% | 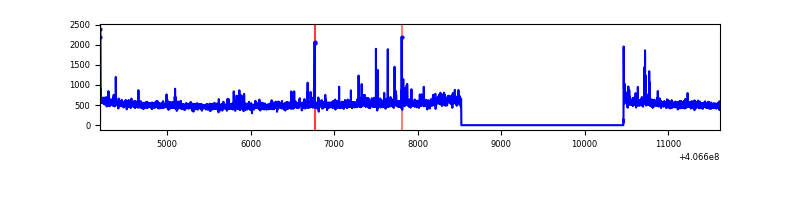 |
| D | 7426 | 5484 | 387 | 387 | 5.21% | 7.06% | 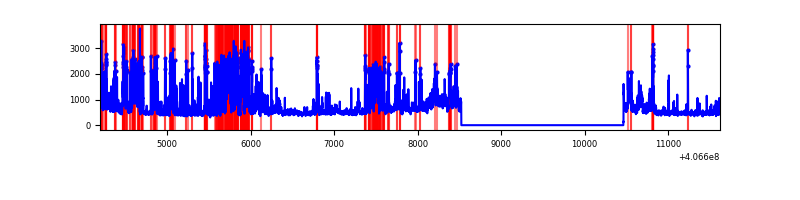 |
Top three noisy pixels from each quadrant. If the there are fewer than three noisy pixels in the level2.evt file, extra rows are filled as -1
| Pixel properties | Quadrant properties | ||||||
|---|---|---|---|---|---|---|---|
| Quadrant | DetID | PixID | Counts | Sigma | Mean | Median | Sigma |
| A | 10 | 83 | 412925 | 3160.84 | 648 | 637 | 130.4 |
| A | 12 | 189 | 47659 | 360.5 | 648 | 637 | 130.4 |
| A | 13 | 248 | 29769 | 223.34 | 648 | 637 | 130.4 |
| B | 5 | 184 | 53490 | 426.0 | 652 | 633 | 124.1 |
| B | 0 | 183 | 22448 | 175.82 | 652 | 633 | 124.1 |
| B | 12 | 111 | 14794 | 114.13 | 652 | 633 | 124.1 |
| C | 15 | 214 | 222117 | 1478.45 | 645 | 650 | 149.8 |
| C | 14 | 254 | 78166 | 517.47 | 645 | 650 | 149.8 |
| C | 3 | 110 | 28099 | 183.24 | 645 | 650 | 149.8 |
| D | 2 | 249 | 1211678 | 7892.42 | 624 | 606 | 153.4 |
| D | 12 | 128 | 185446 | 1204.58 | 624 | 606 | 153.4 |
| D | 1 | 47 | 177837 | 1154.99 | 624 | 606 | 153.4 |
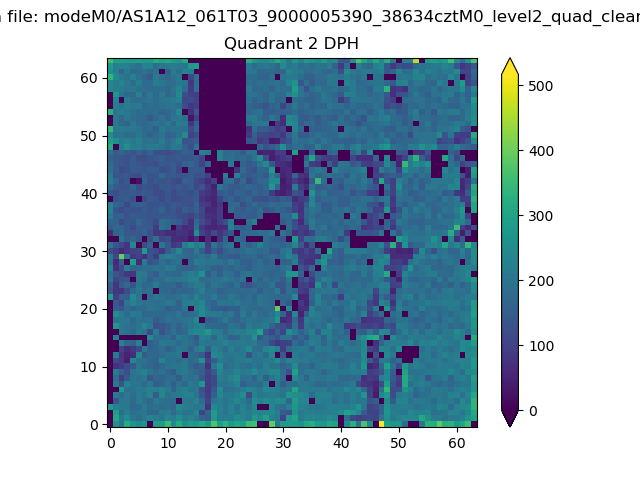
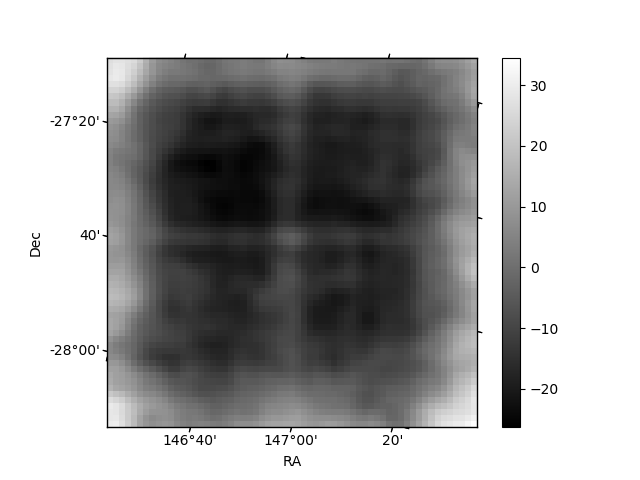
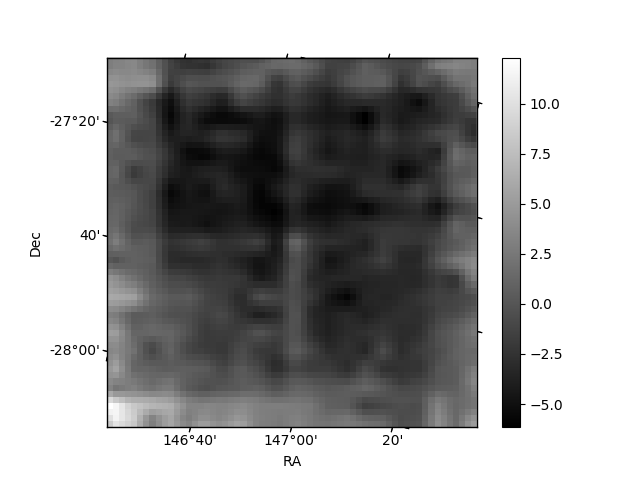
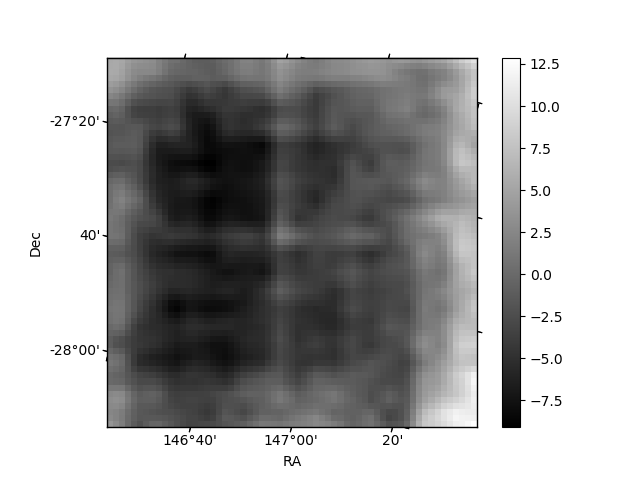
Histogram calculated using DETX and DETY for each event in the final _common_clean file
| Quadrant A | 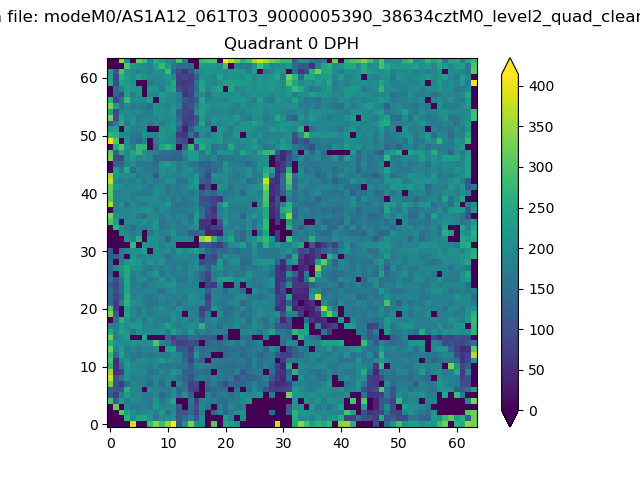 |
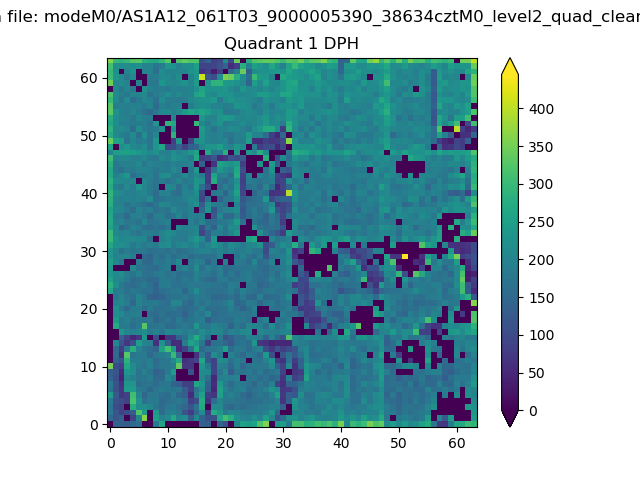 |
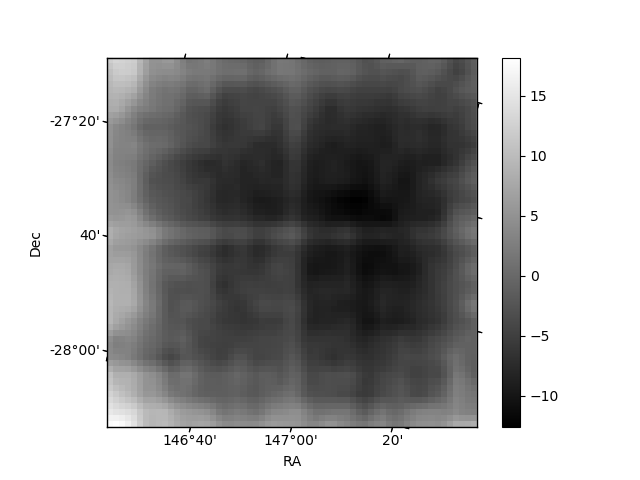
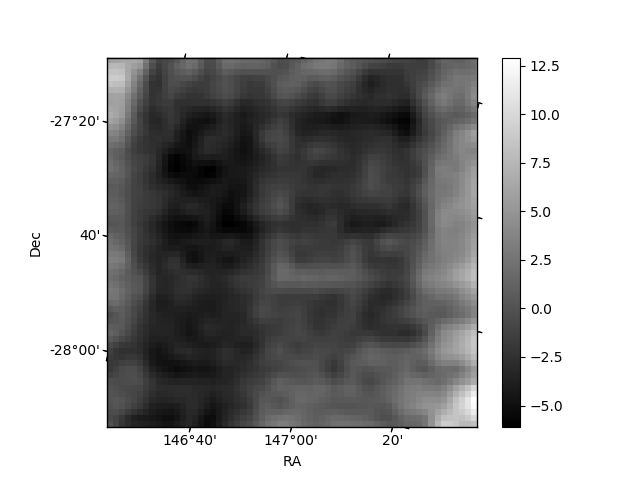
Quadrant B |
|---|---|---|---|
| Quadrant D | 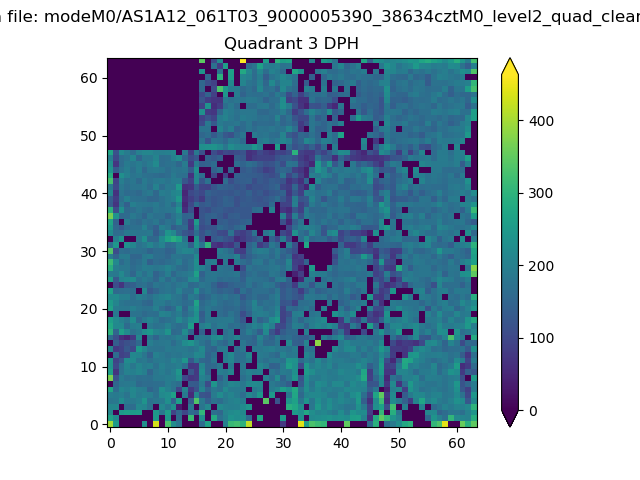 |
 |
Quadrant C |
| Plot type | Count rate plots | Images |
|---|---|---|
| Comparison with Poisson distribution Blue bars denote a histogram of data divided into 1 sec bins. Red curve is a Poisson curve with rate = median count rate of data. |
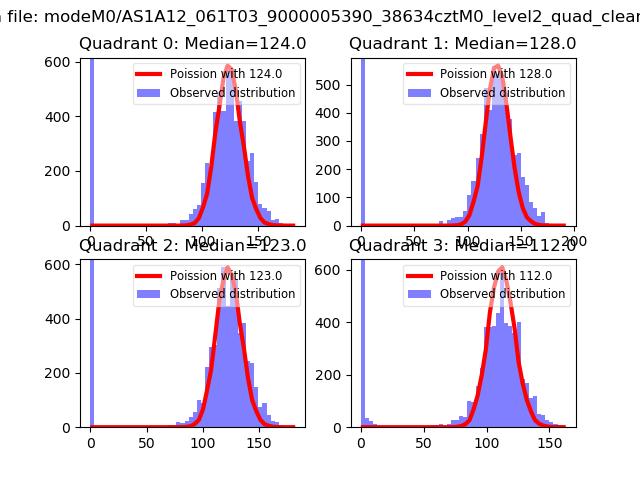 |
 |
| Quadrant-wise count rates Data is divided into 100 sec bins |
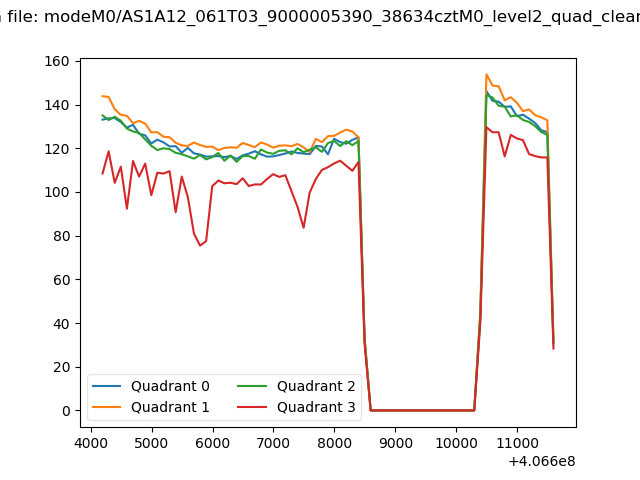 |
|
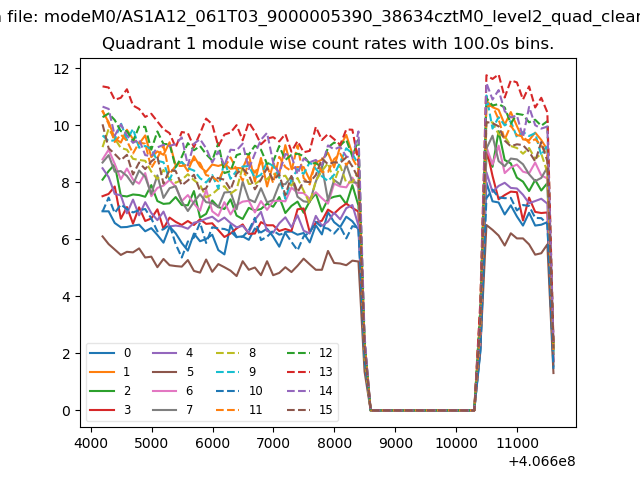
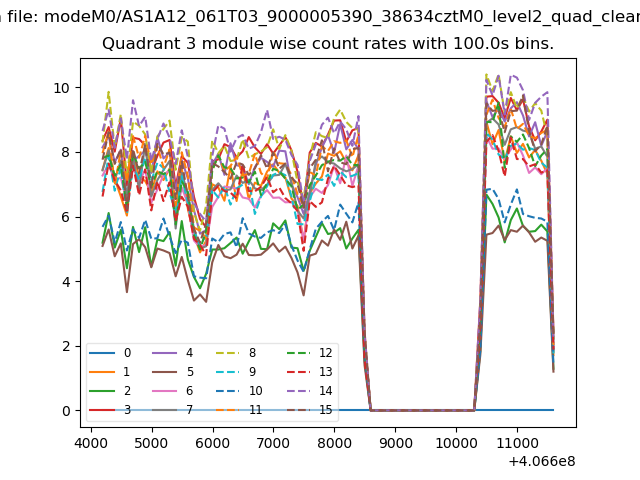
| Module-wise count rates for Quadrant A Data is divided into 100 sec bins |
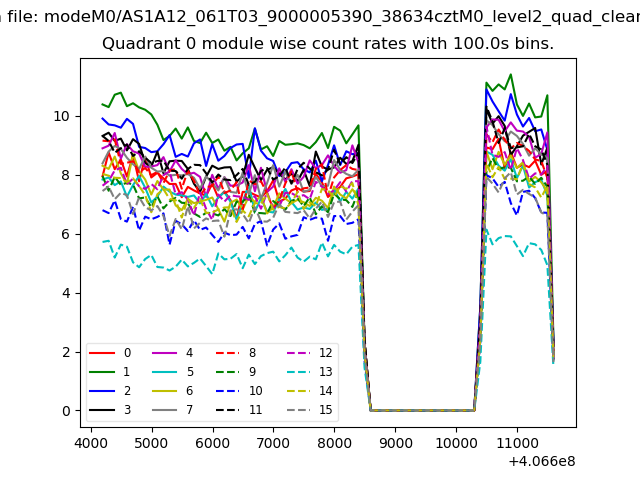 |
 |
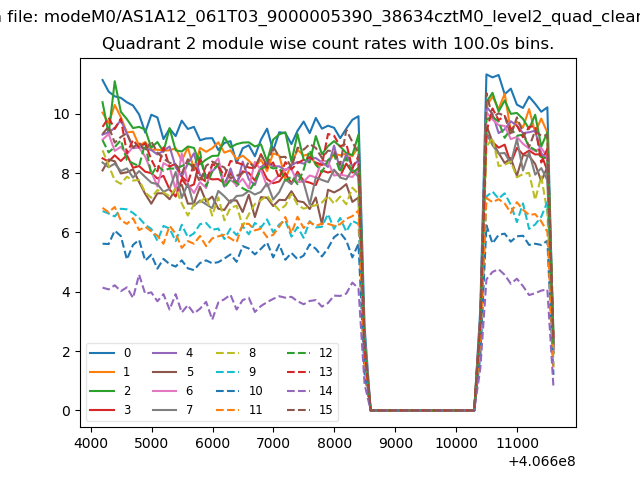
| Module-wise count rates for Quadrant B Data is divided into 100 sec bins |
 |
 |
| Module-wise count rates for Quadrant C Data is divided into 100 sec bins |
 |
 |
| Module-wise count rates for Quadrant D Data is divided into 100 sec bins |
 |
 |
| Parameter | Plot |
|---|---|
| CZT HV Monitor | 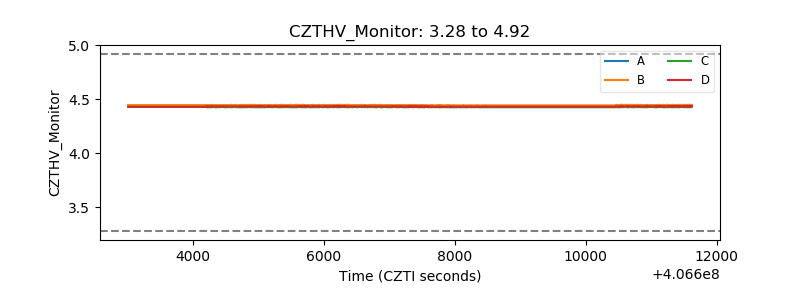 |
| D_VDD | 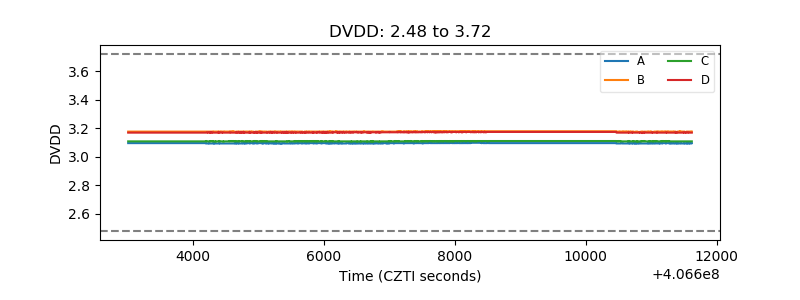 |
| Temperature 1 | 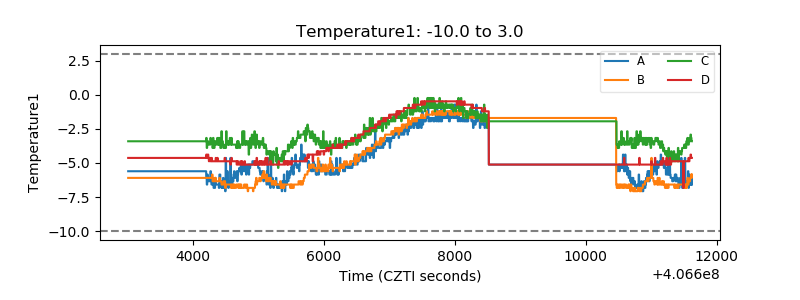 |
| Veto HV Monitor | 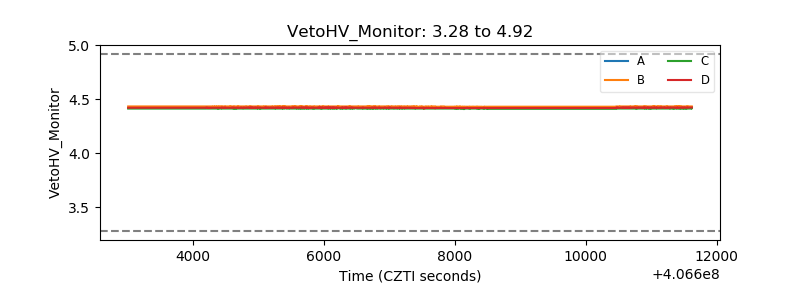 |
| Veto LLD | 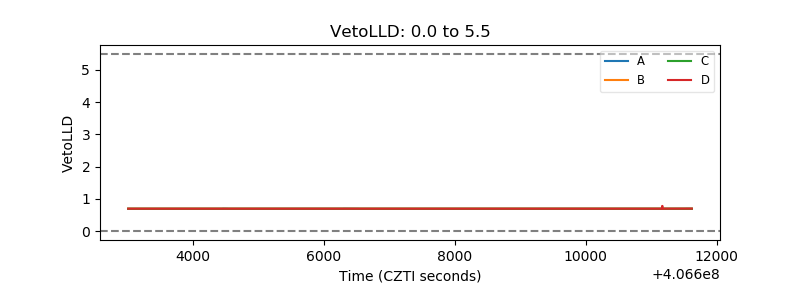 |
| Alpha Counter | 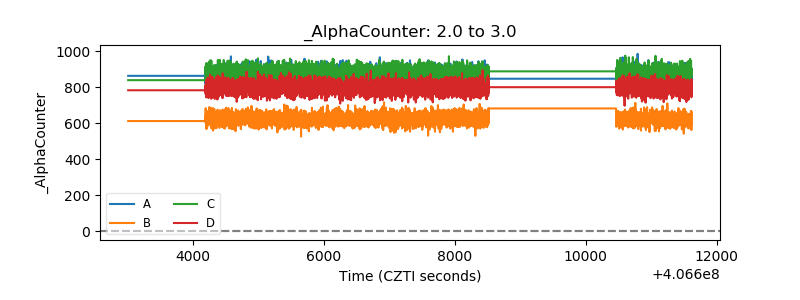 |
| _CPM_Rate | 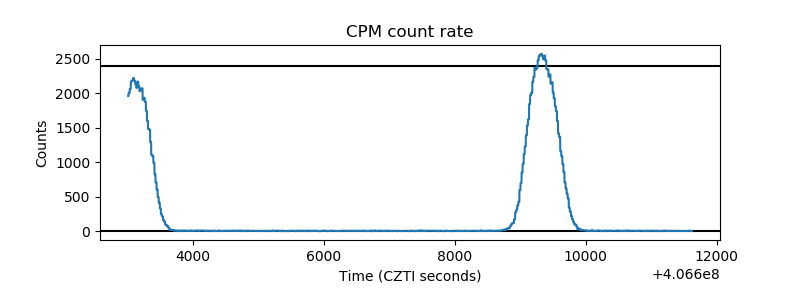 |
| CZT Counter | 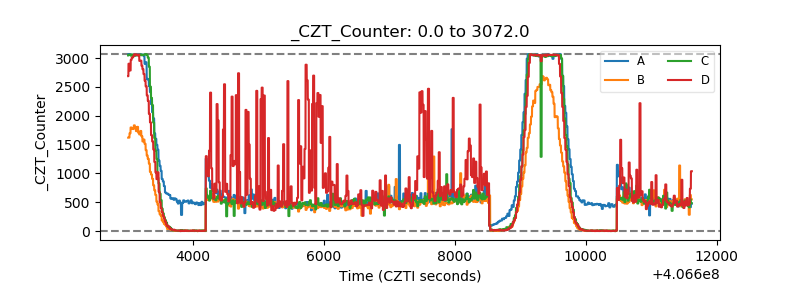 |
| +2.5 Volts monitor |  |
| +5 Volts monitor | 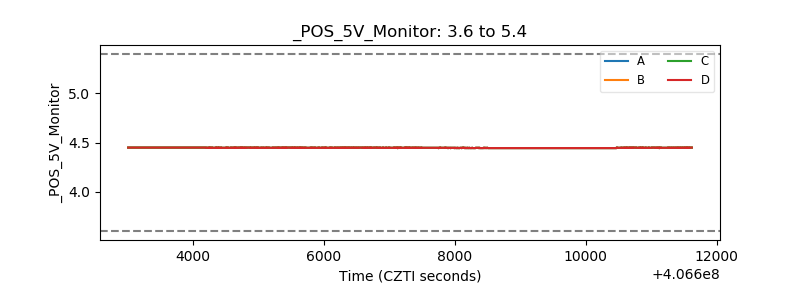 |
| _ROLL_ROT | 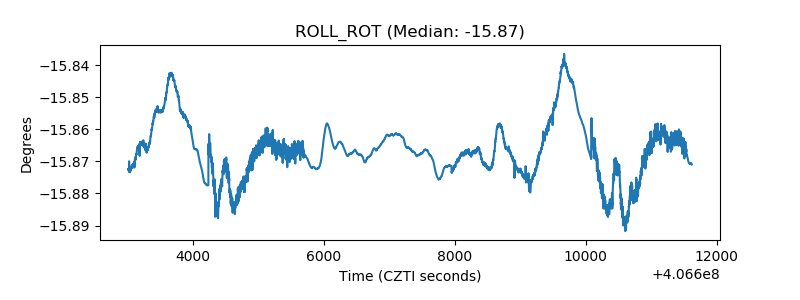 |
| _Roll_DEC |  |
| _Roll_RA | 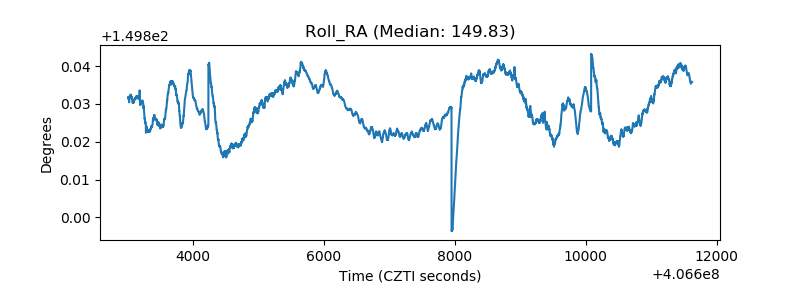 |
| Veto Counter | 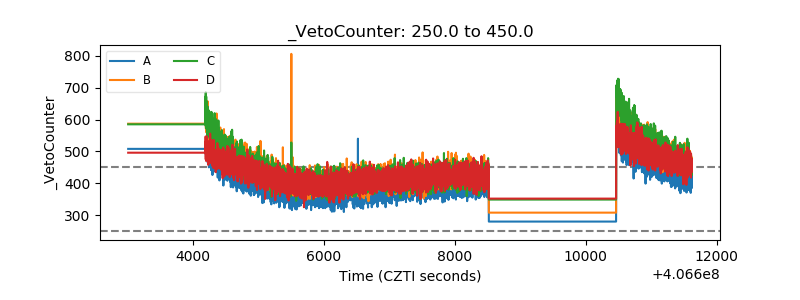 |