| Param | Original file | Final file |
|---|---|---|
| Filename | modeM0/AS1A12_061T03_9000005390_38635cztM0_level2.fits | modeM0/AS1A12_061T03_9000005390_38635cztM0_level2_quad_clean.evt |
| Size (bytes) | 351,469,440 | 101,753,280 |
| Size | 335.2 MB | 97.0 MB |
| Events in quadrant A | 3,025,142 | 691,240 |
| Events in quadrant B | 3,135,413 | 712,401 |
| Events in quadrant C | 2,888,745 | 686,477 |
| Events in quadrant D | 3,545,248 | 617,400 |
| Mode SS | |||
|---|---|---|---|
| Quadrant | BADHDUFLAG | Total packets | Discarded packets |
| A | 0 | 108 | 0 |
| B | 0 | 108 | 0 |
| C | 0 | 108 | 0 |
| D | 0 | 108 | 0 |
| Mode M9 | |||
|---|---|---|---|
| Quadrant | BADHDUFLAG | Total packets | Discarded packets |
| A | 0 | 26 | 0 |
| B | 0 | 26 | 0 |
| C | 0 | 26 | 0 |
| D | 0 | 27 | 0 |
| Mode M0 | |||
|---|---|---|---|
| Quadrant | BADHDUFLAG | Total packets | Discarded packets |
| A | 0 | 12178 | 3 |
| B | 0 | 12658 | 2 |
| C | 0 | 11549 | 2 |
| D | 0 | 14063 | 2 |
| Quadrant | Total seconds | Saturated seconds | Saturation percentage |
|---|---|---|---|
| A | 5344 | 12 | 0.224551% |
| B | 5344 | 82 | 1.534431% |
| C | 5344 | 8 | 0.149701% |
| D | 5344 | 119 | 2.226796% |
Noise dominated data is calculated using 1-second bins in cleaned event files. If a bin has >2000 counts, and if more than 50% of those come from <1% of pixels, then it is considered to be noise-dominated and hence unusable.
| Quadrant | # 1 sec bins | Bins with >0 counts | Bins with >2000 counts | High rate bins dominated by noise | Noise dominated (total time) | Noise dominated (detector-on time) | Marked lightcurve |
|---|---|---|---|---|---|---|---|
| A | 7378 | 5345 | 6 | 6 | 0.08% | 0.11% |  |
| B | 7378 | 5345 | 22 | 22 | 0.30% | 0.41% |  |
| C | 7378 | 5345 | 3 | 3 | 0.04% | 0.06% | 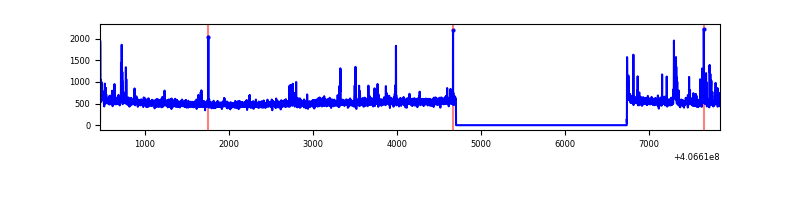 |
| D | 7378 | 5345 | 101 | 101 | 1.37% | 1.89% | 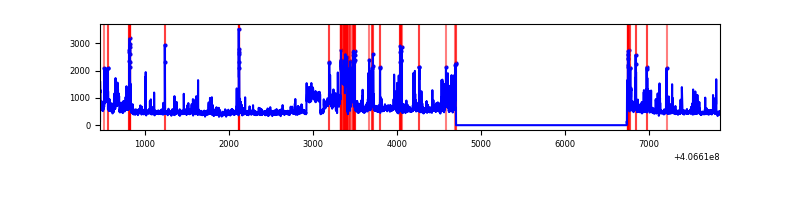 |
Top three noisy pixels from each quadrant. If the there are fewer than three noisy pixels in the level2.evt file, extra rows are filled as -1
| Pixel properties | Quadrant properties | ||||||
|---|---|---|---|---|---|---|---|
| Quadrant | DetID | PixID | Counts | Sigma | Mean | Median | Sigma |
| A | 10 | 83 | 418485 | 3225.78 | 649 | 638 | 129.5 |
| A | 0 | 247 | 37676 | 285.93 | 649 | 638 | 129.5 |
| A | 13 | 248 | 19676 | 146.97 | 649 | 638 | 129.5 |
| B | 4 | 251 | 403628 | 3310.7 | 648 | 631 | 121.7 |
| B | 0 | 183 | 41717 | 337.53 | 648 | 631 | 121.7 |
| B | 4 | 171 | 38980 | 315.04 | 648 | 631 | 121.7 |
| C | 15 | 214 | 217675 | 1456.99 | 645 | 652 | 149.0 |
| C | 14 | 254 | 94616 | 630.83 | 645 | 652 | 149.0 |
| C | 0 | 10 | 16450 | 106.06 | 645 | 652 | 149.0 |
| D | 15 | 0 | 239730 | 1530.35 | 637 | 620 | 156.2 |
| D | 1 | 47 | 221021 | 1410.61 | 637 | 620 | 156.2 |
| D | 5 | 222 | 115148 | 733.0 | 637 | 620 | 156.2 |
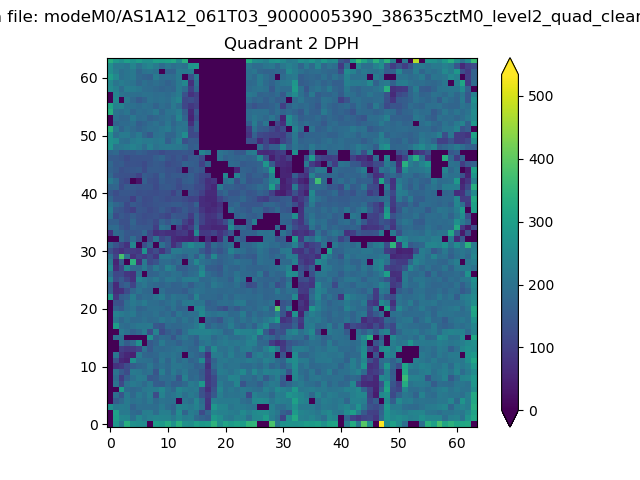
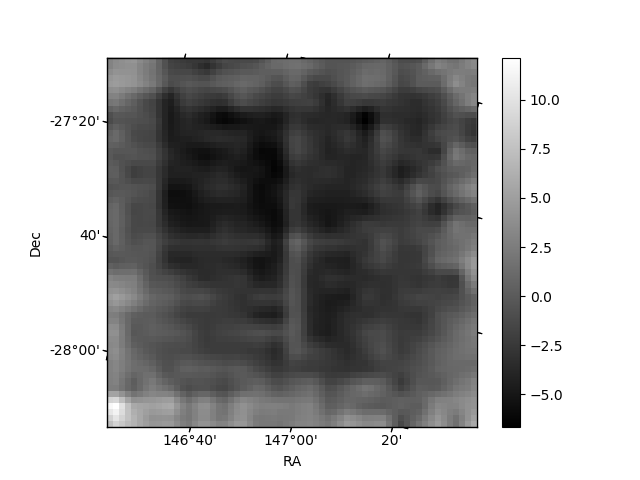
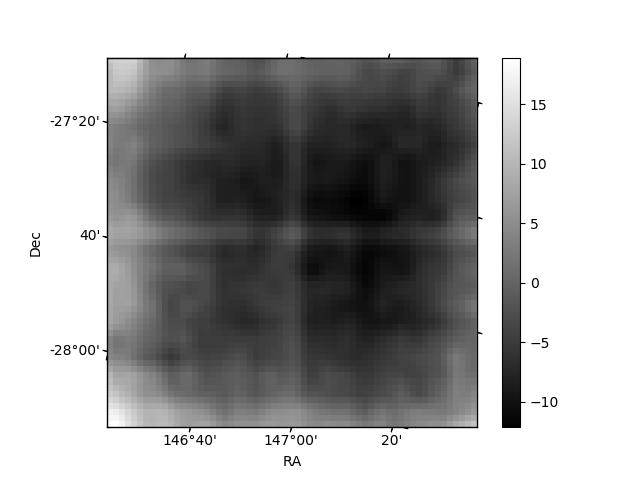
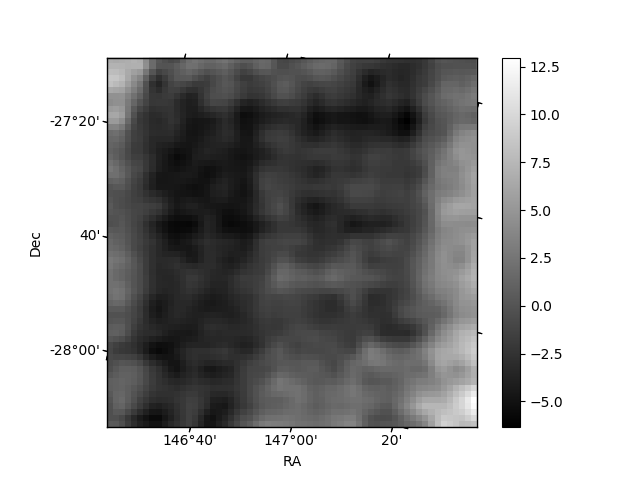
Histogram calculated using DETX and DETY for each event in the final _common_clean file
| Quadrant A | 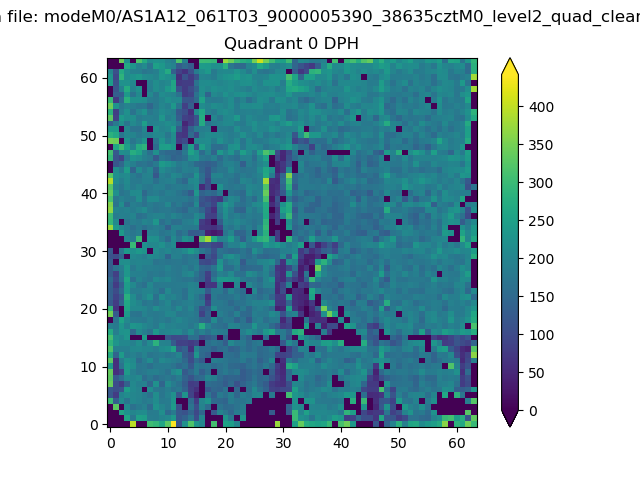 |
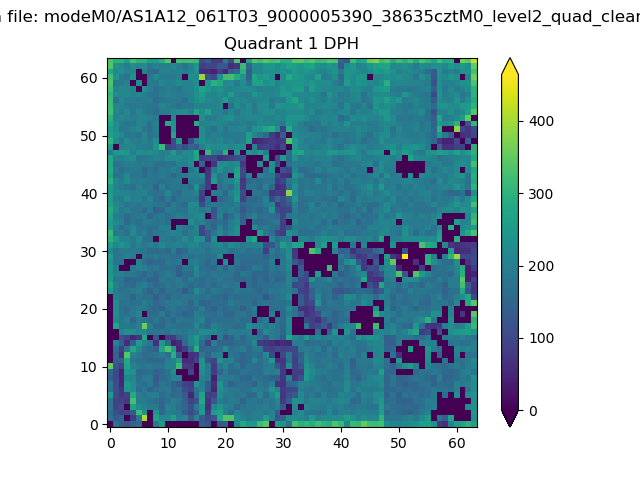 |
Quadrant B |
|---|---|---|---|
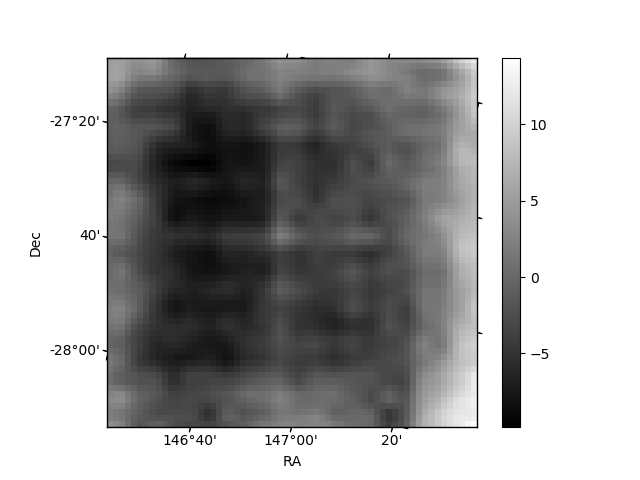
| Quadrant D | 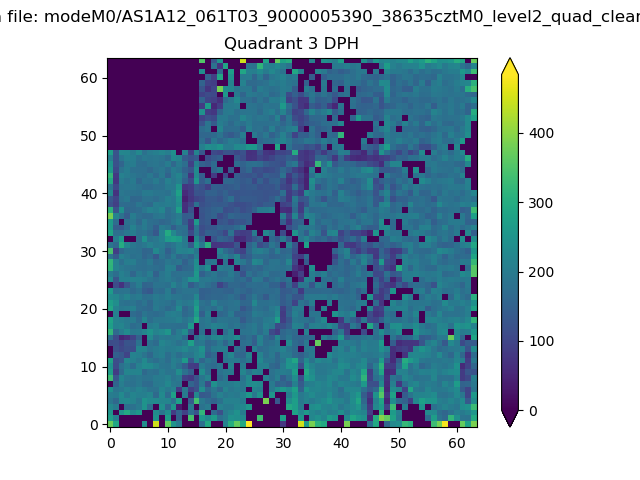 |
 |
Quadrant C |
| Plot type | Count rate plots | Images |
|---|---|---|
| Comparison with Poisson distribution Blue bars denote a histogram of data divided into 1 sec bins. Red curve is a Poisson curve with rate = median count rate of data. |
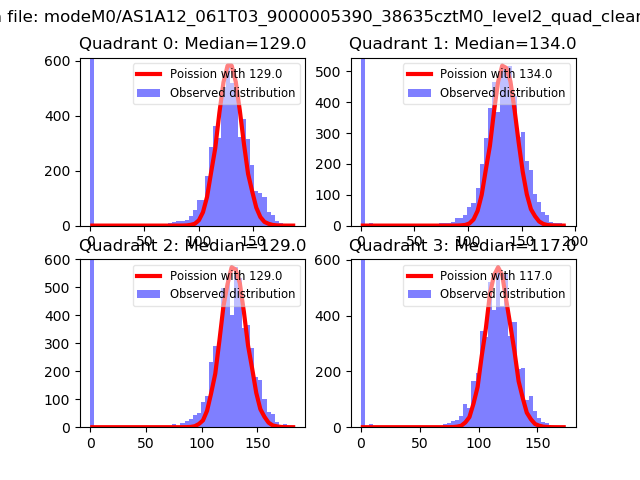 |
 |
| Quadrant-wise count rates Data is divided into 100 sec bins |
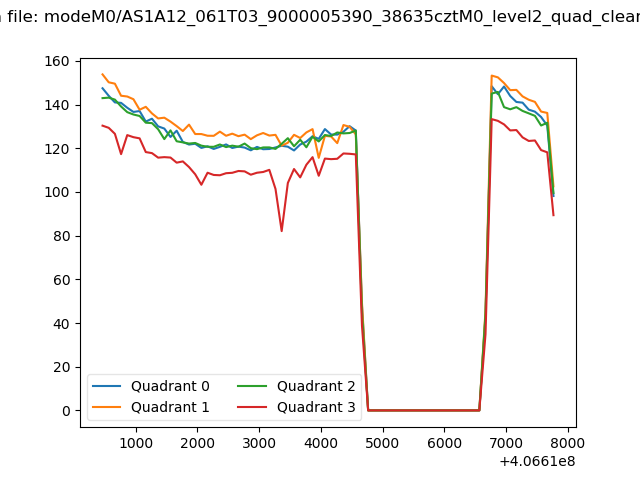 |
|
| Module-wise count rates for Quadrant A Data is divided into 100 sec bins |
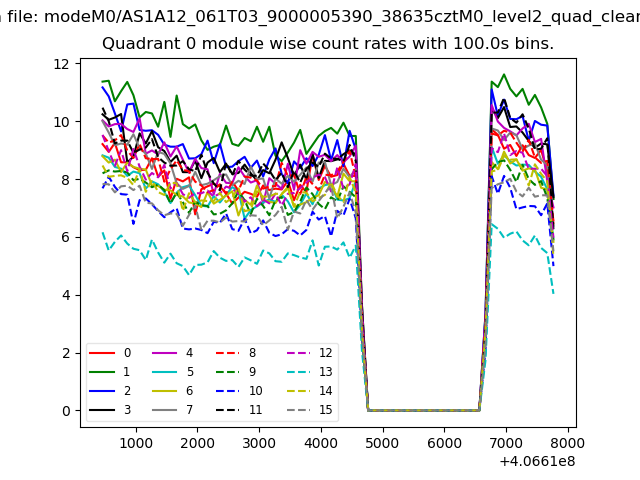 |
 |
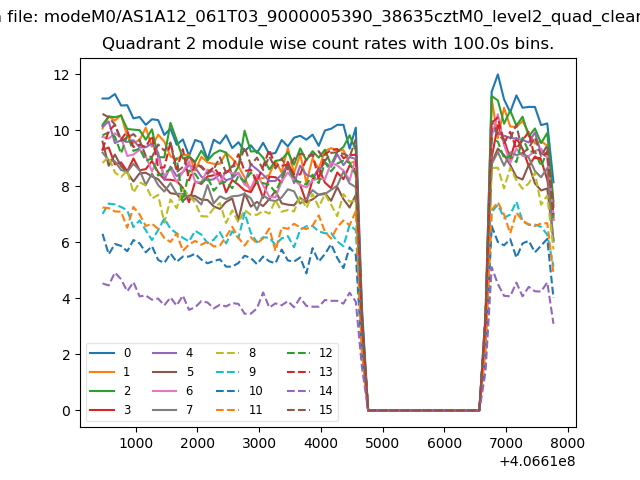
| Module-wise count rates for Quadrant B Data is divided into 100 sec bins |
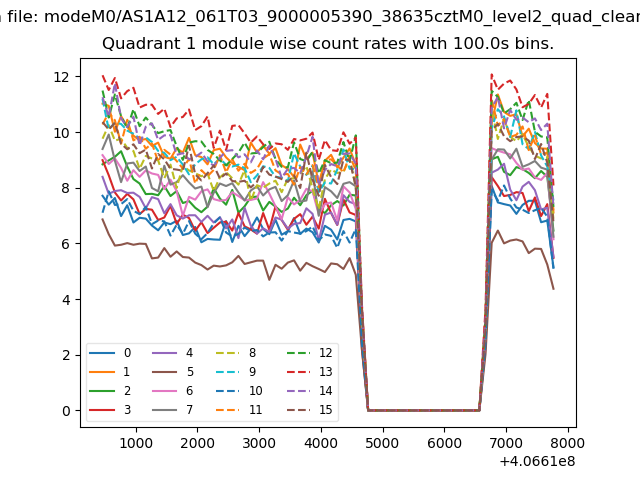 |
 |
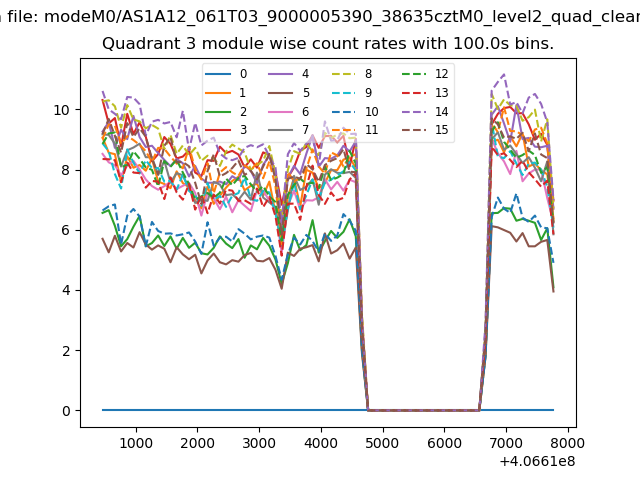
| Module-wise count rates for Quadrant C Data is divided into 100 sec bins |
 |
 |
| Module-wise count rates for Quadrant D Data is divided into 100 sec bins |
 |
 |
| Parameter | Plot |
|---|---|
| CZT HV Monitor | 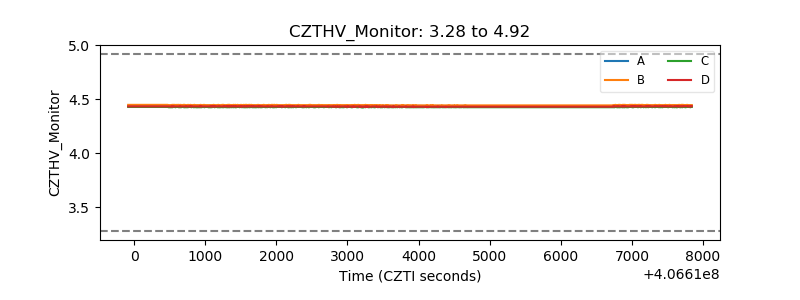 |
| D_VDD | 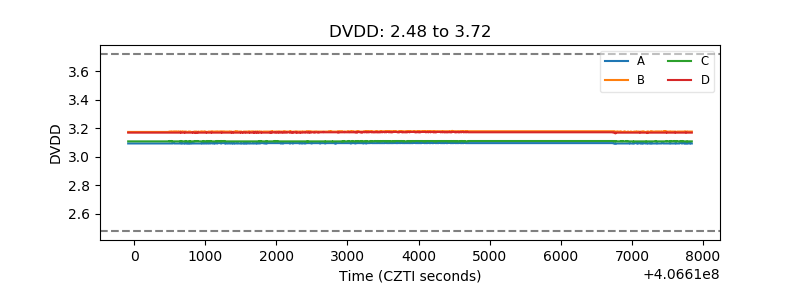 |
| Temperature 1 | 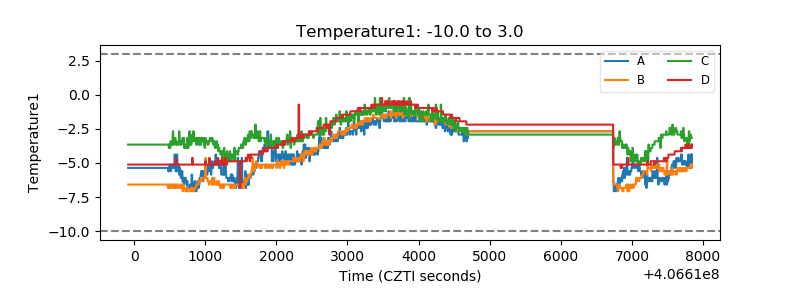 |
| Veto HV Monitor | 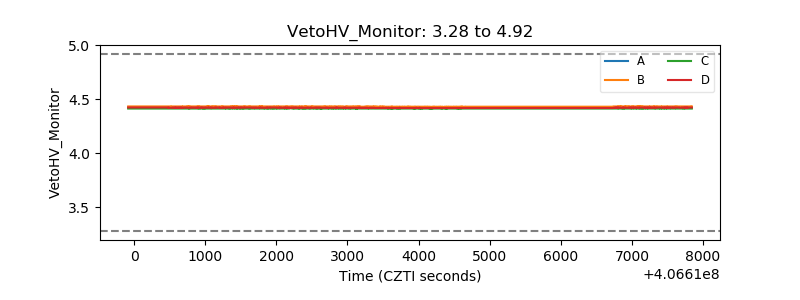 |
| Veto LLD | 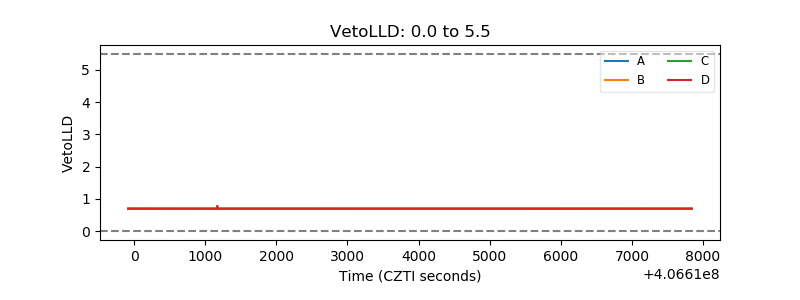 |
| Alpha Counter | 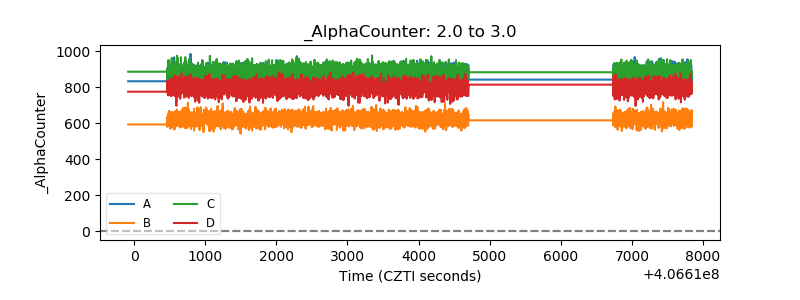 |
| _CPM_Rate | 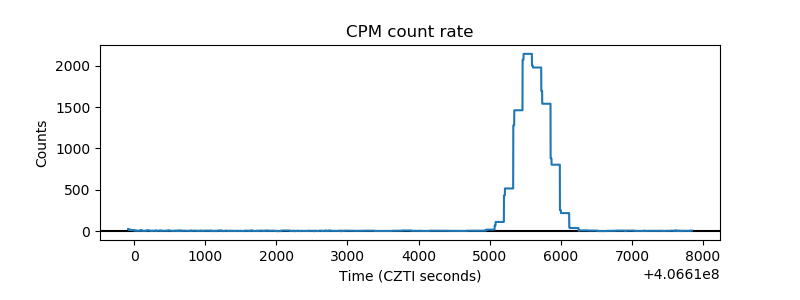 |
| CZT Counter | 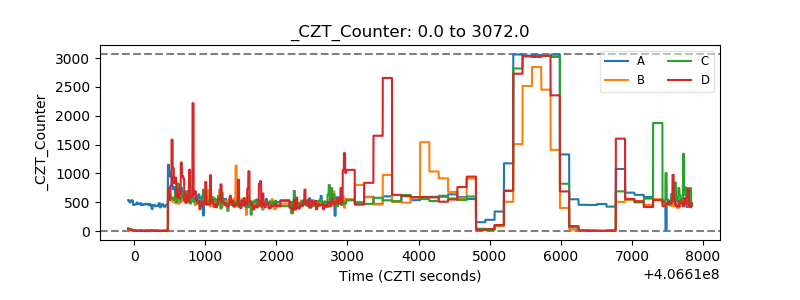 |
| +2.5 Volts monitor | 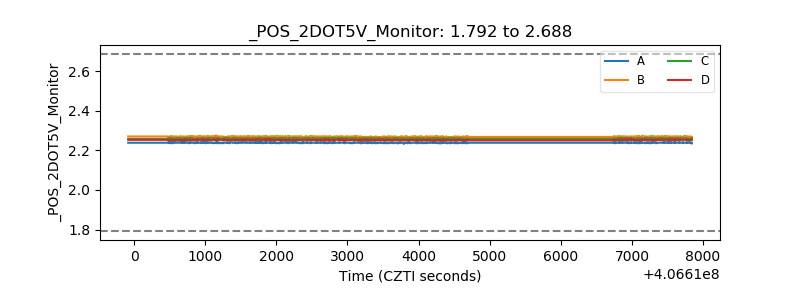 |
| +5 Volts monitor | 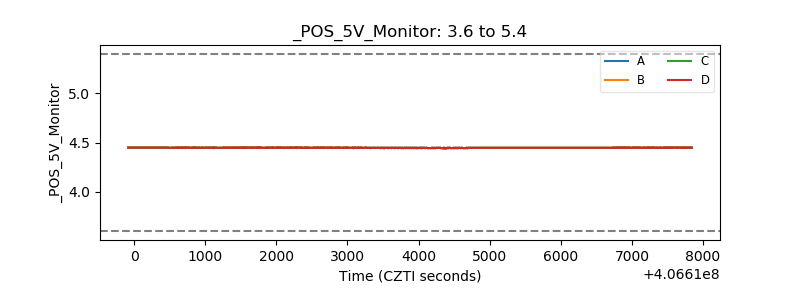 |
| _ROLL_ROT | 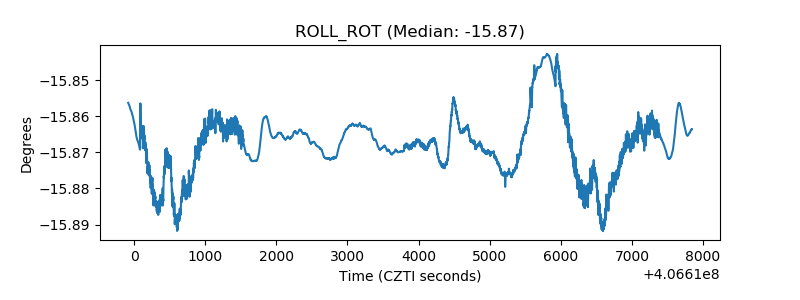 |
| _Roll_DEC | 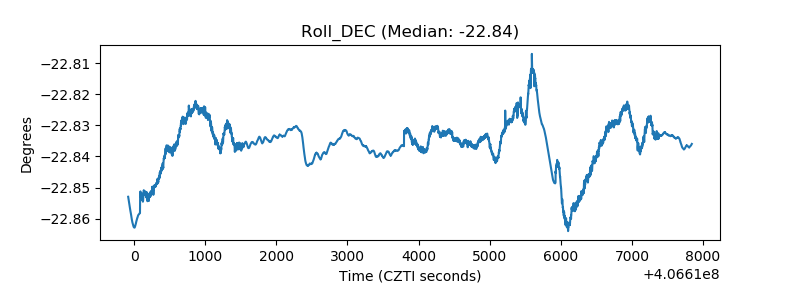 |
| _Roll_RA | 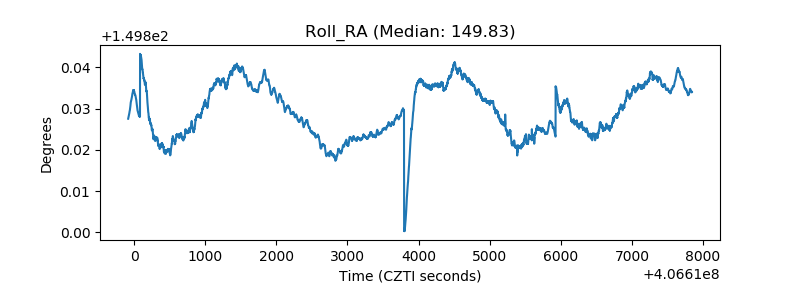 |
| Veto Counter | 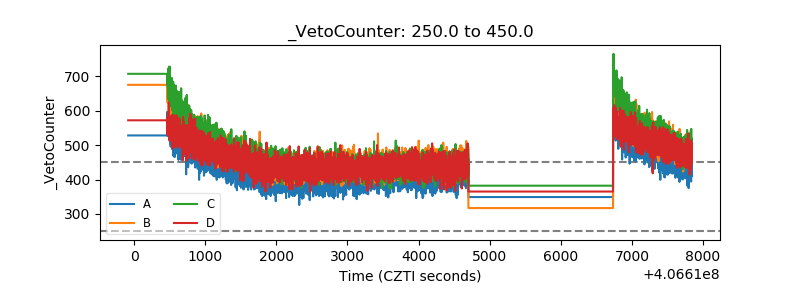 |