| Param | Original file | Final file |
|---|---|---|
| Filename | modeM0/AS1A12_061T03_9000005390_38636cztM0_level2.fits | modeM0/AS1A12_061T03_9000005390_38636cztM0_level2_quad_clean.evt |
| Size (bytes) | 336,767,040 | 92,787,840 |
| Size | 321.2 MB | 88.5 MB |
| Events in quadrant A | 2,812,984 | 635,877 |
| Events in quadrant B | 2,659,239 | 651,293 |
| Events in quadrant C | 3,021,240 | 616,873 |
| Events in quadrant D | 3,591,273 | 562,317 |
| Mode SS | |||
|---|---|---|---|
| Quadrant | BADHDUFLAG | Total packets | Discarded packets |
| A | 0 | 100 | 0 |
| B | 0 | 100 | 0 |
| C | 0 | 100 | 0 |
| D | 0 | 100 | 0 |
| Mode M9 | |||
|---|---|---|---|
| Quadrant | BADHDUFLAG | Total packets | Discarded packets |
| A | 0 | 31 | 0 |
| B | 0 | 31 | 0 |
| C | 0 | 31 | 0 |
| D | 0 | 32 | 0 |
| Mode M0 | |||
|---|---|---|---|
| Quadrant | BADHDUFLAG | Total packets | Discarded packets |
| A | 0 | 11233 | 3 |
| B | 0 | 10855 | 2 |
| C | 0 | 11713 | 2 |
| D | 0 | 13982 | 2 |
| Quadrant | Total seconds | Saturated seconds | Saturation percentage |
|---|---|---|---|
| A | 4897 | 24 | 0.490096% |
| B | 4897 | 54 | 1.102716% |
| C | 4897 | 122 | 2.491321% |
| D | 4897 | 191 | 3.900347% |
Noise dominated data is calculated using 1-second bins in cleaned event files. If a bin has >2000 counts, and if more than 50% of those come from <1% of pixels, then it is considered to be noise-dominated and hence unusable.
| Quadrant | # 1 sec bins | Bins with >0 counts | Bins with >2000 counts | High rate bins dominated by noise | Noise dominated (total time) | Noise dominated (detector-on time) | Marked lightcurve |
|---|---|---|---|---|---|---|---|
| A | 7020 | 4898 | 23 | 23 | 0.33% | 0.47% | 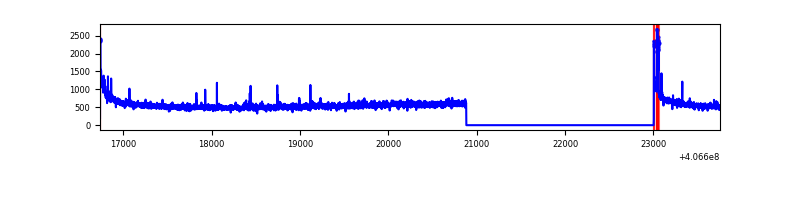 |
| B | 7020 | 4898 | 21 | 21 | 0.30% | 0.43% | 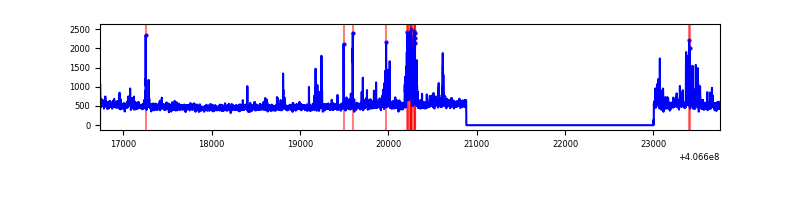 |
| C | 7020 | 4898 | 112 | 112 | 1.60% | 2.29% | 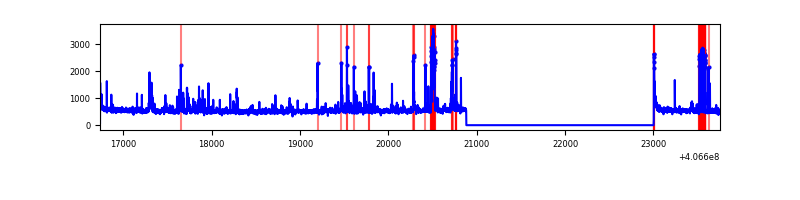 |
| D | 7020 | 4898 | 179 | 179 | 2.55% | 3.65% | 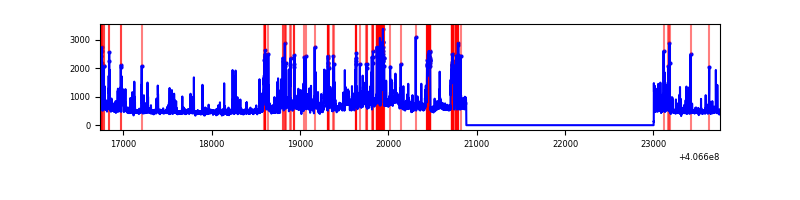 |
Top three noisy pixels from each quadrant. If the there are fewer than three noisy pixels in the level2.evt file, extra rows are filled as -1
| Pixel properties | Quadrant properties | ||||||
|---|---|---|---|---|---|---|---|
| Quadrant | DetID | PixID | Counts | Sigma | Mean | Median | Sigma |
| A | 10 | 83 | 394171 | 3262.78 | 602 | 592 | 120.6 |
| A | 13 | 248 | 45410 | 371.54 | 602 | 592 | 120.6 |
| A | 13 | 6 | 19498 | 156.73 | 602 | 592 | 120.6 |
| B | 4 | 171 | 239991 | 2132.18 | 596 | 581 | 112.3 |
| B | 0 | 155 | 29606 | 258.5 | 596 | 581 | 112.3 |
| B | 15 | 85 | 18095 | 155.98 | 596 | 581 | 112.3 |
| C | 14 | 254 | 449878 | 3300.29 | 588 | 594 | 136.1 |
| C | 15 | 214 | 198243 | 1451.86 | 588 | 594 | 136.1 |
| C | 0 | 10 | 30762 | 221.6 | 588 | 594 | 136.1 |
| D | 5 | 222 | 437369 | 3053.73 | 588 | 574 | 143.0 |
| D | 13 | 249 | 249350 | 1739.25 | 588 | 574 | 143.0 |
| D | 1 | 47 | 140603 | 978.97 | 588 | 574 | 143.0 |
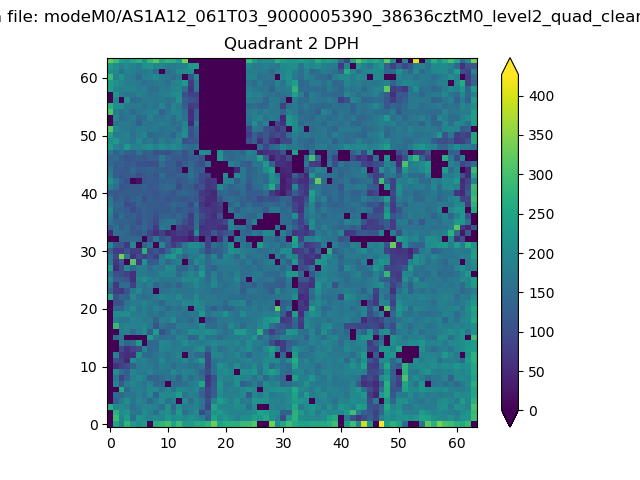
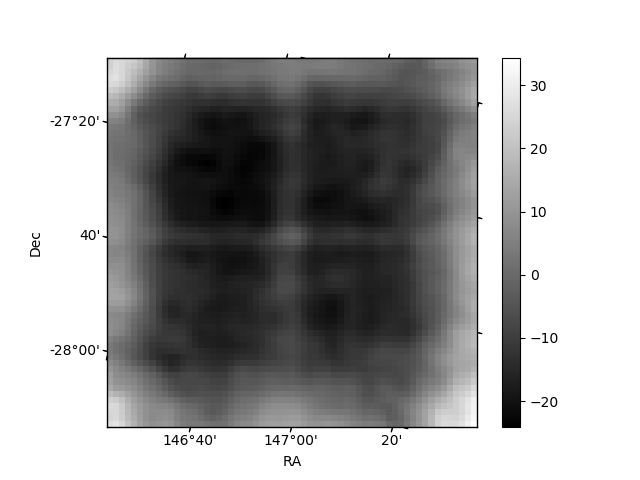
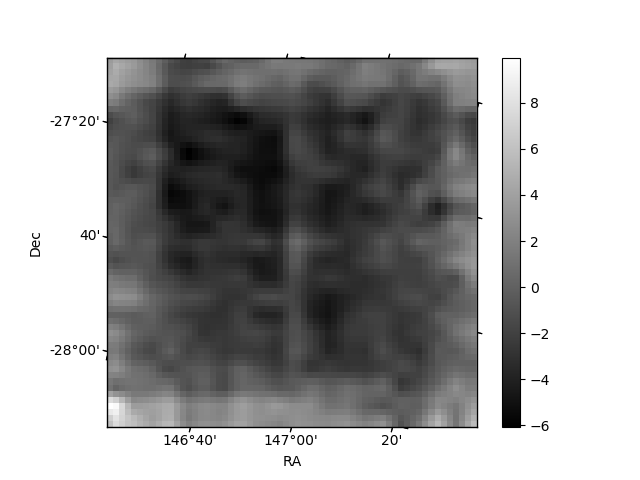
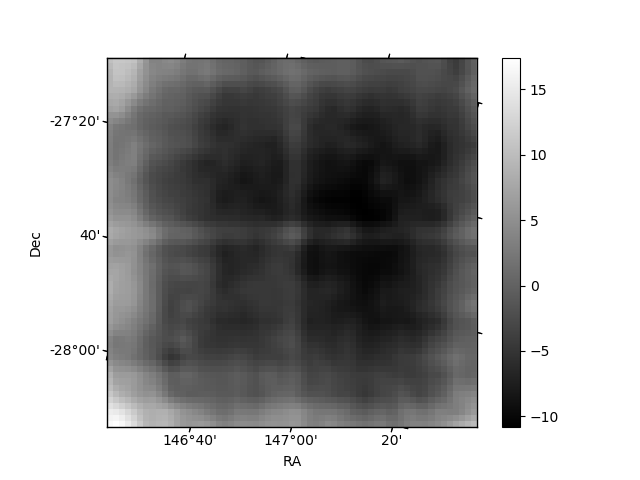
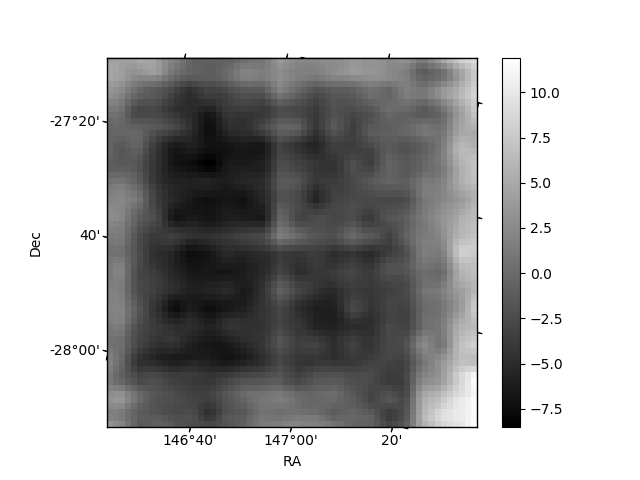
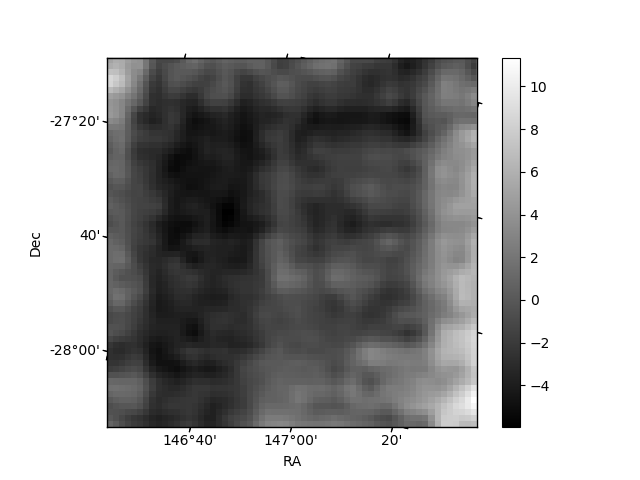
Histogram calculated using DETX and DETY for each event in the final _common_clean file
| Quadrant A | 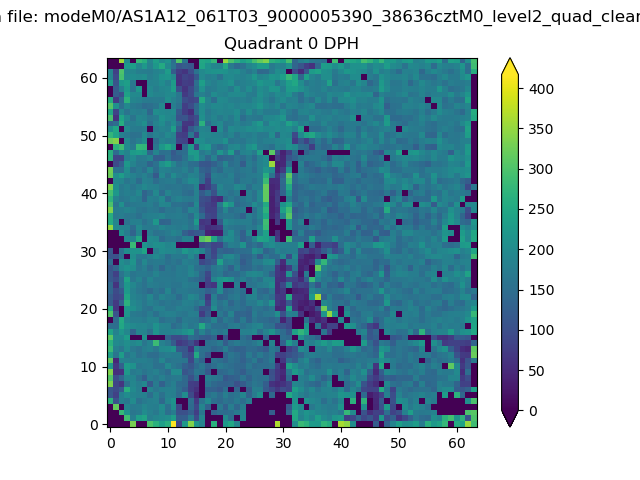 |
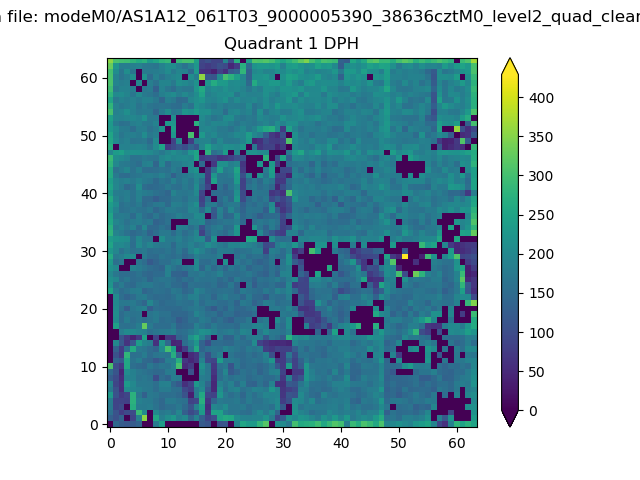 |
Quadrant B |
|---|---|---|---|
| Quadrant D | 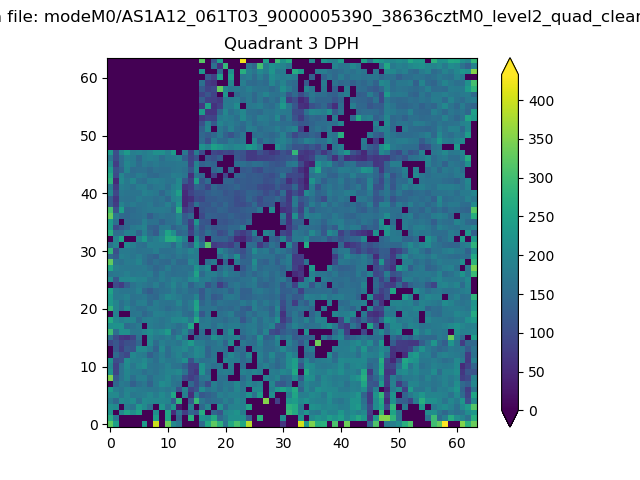 |
 |
Quadrant C |
| Plot type | Count rate plots | Images |
|---|---|---|
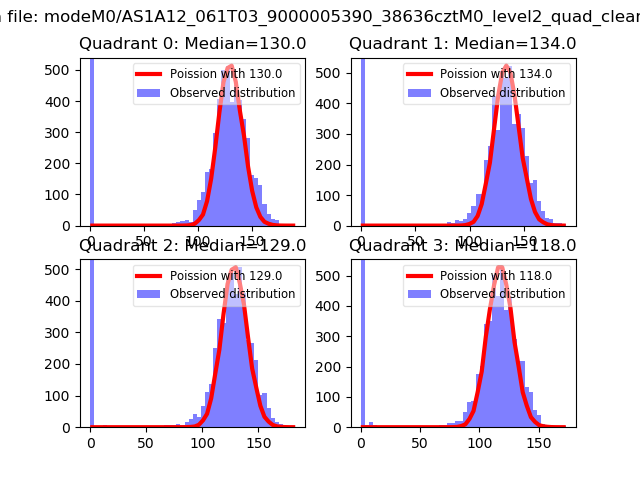
| Comparison with Poisson distribution Blue bars denote a histogram of data divided into 1 sec bins. Red curve is a Poisson curve with rate = median count rate of data. |
 |
 |
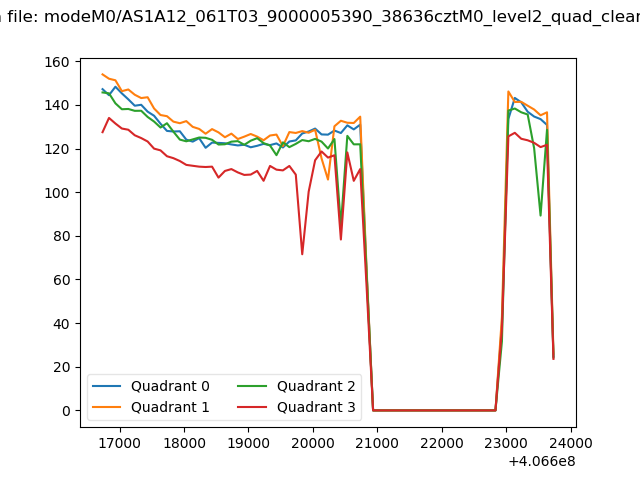
| Quadrant-wise count rates Data is divided into 100 sec bins |
 |
|
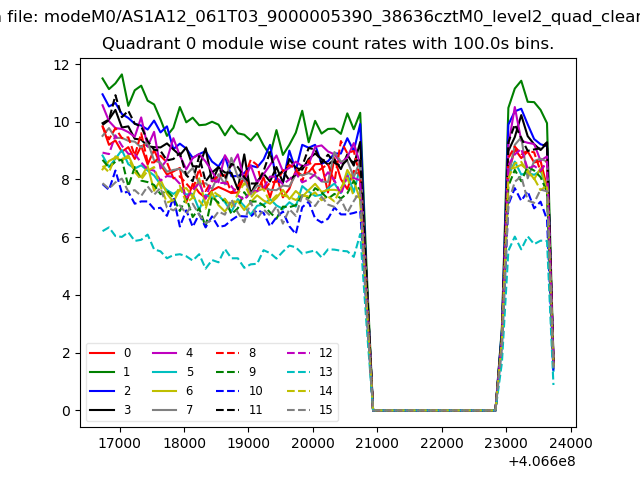
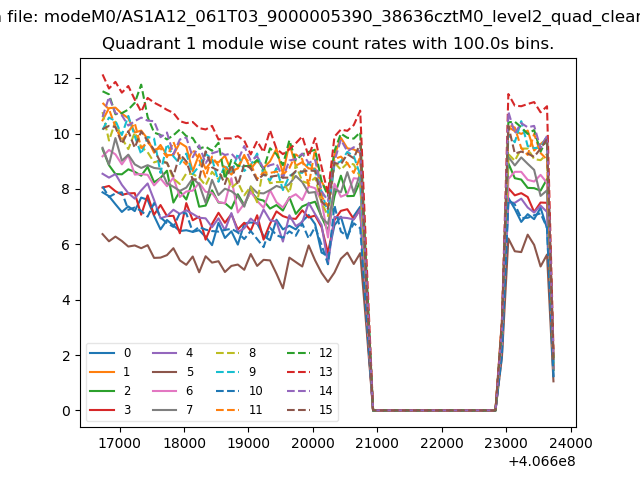
| Module-wise count rates for Quadrant A Data is divided into 100 sec bins |
 |
 |
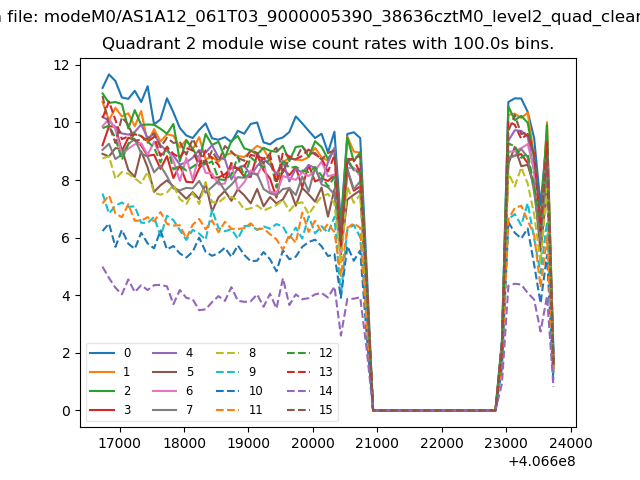
| Module-wise count rates for Quadrant B Data is divided into 100 sec bins |
 |
 |
| Module-wise count rates for Quadrant C Data is divided into 100 sec bins |
 |
 |
| Module-wise count rates for Quadrant D Data is divided into 100 sec bins |
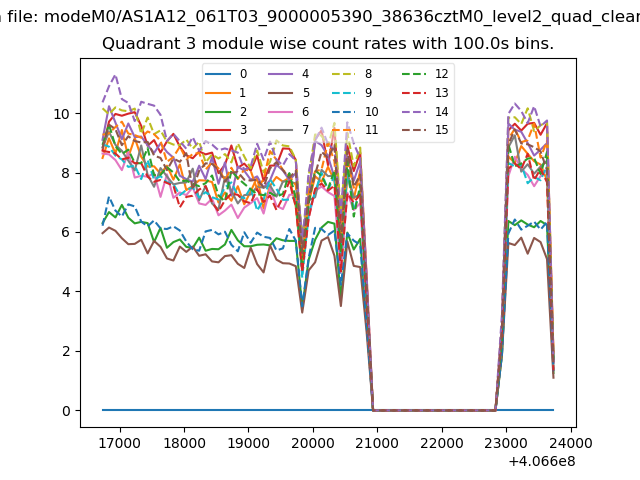 |
 |
| Parameter | Plot |
|---|---|
| CZT HV Monitor | 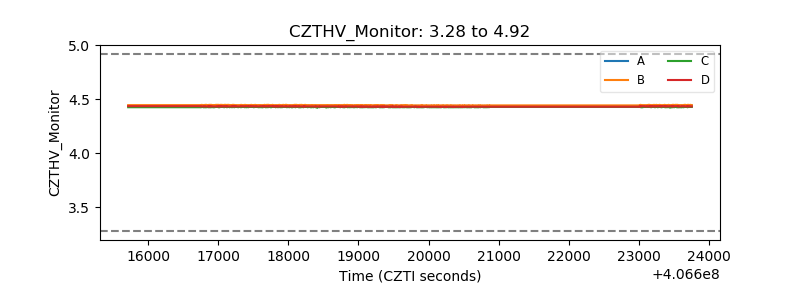 |
| D_VDD | 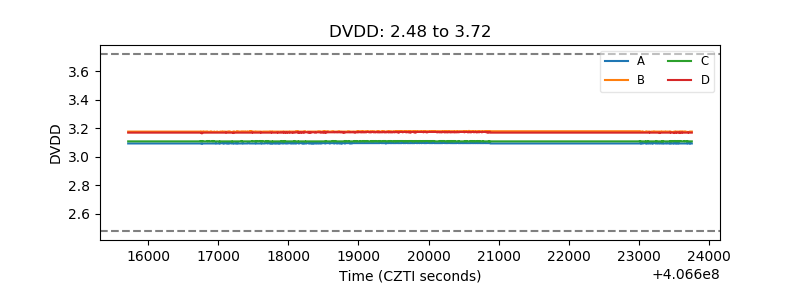 |
| Temperature 1 | 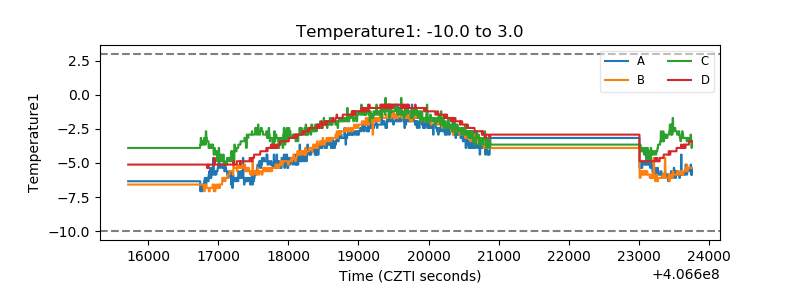 |
| Veto HV Monitor | 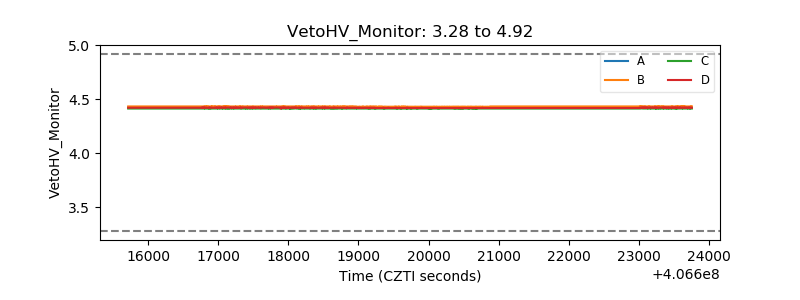 |
| Veto LLD | 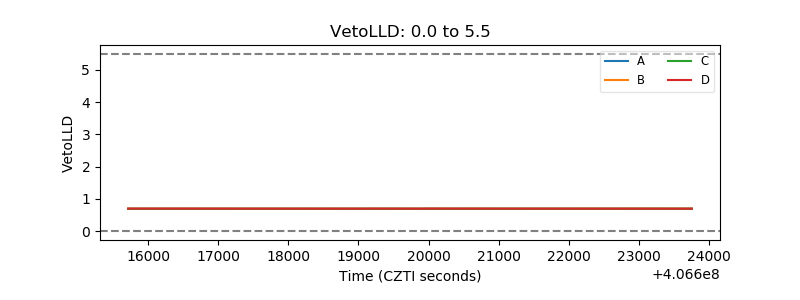 |
| Alpha Counter | 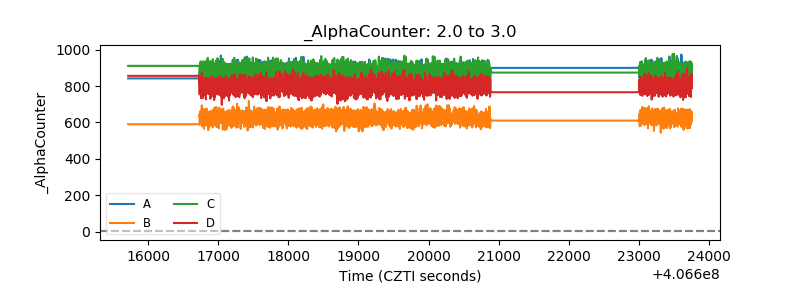 |
| _CPM_Rate |  |
| CZT Counter | 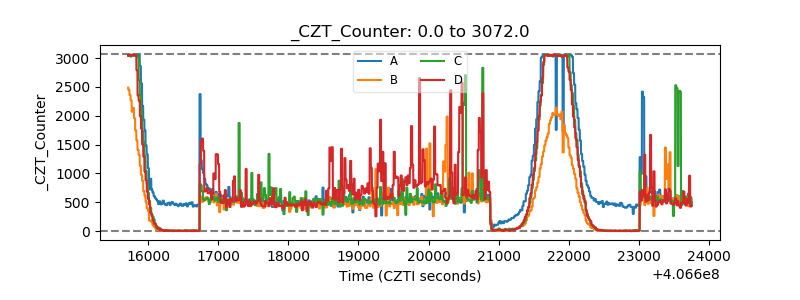 |
| +2.5 Volts monitor | 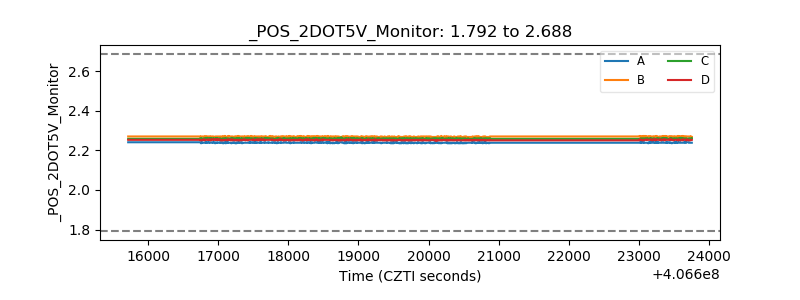 |
| +5 Volts monitor | 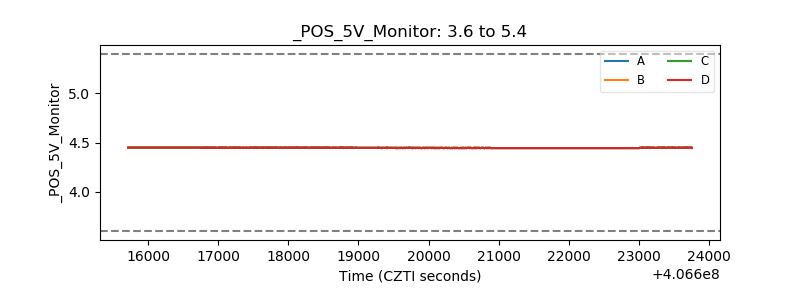 |
| _ROLL_ROT | 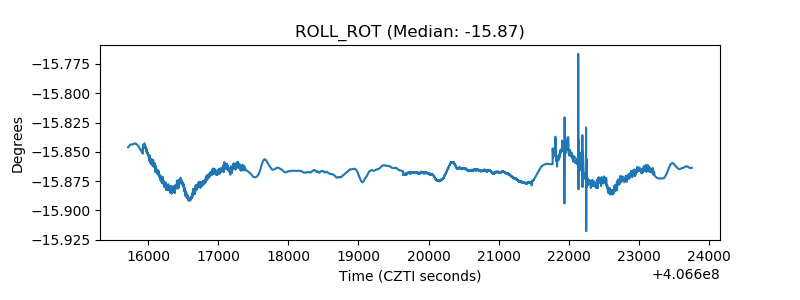 |
| _Roll_DEC |  |
| _Roll_RA | 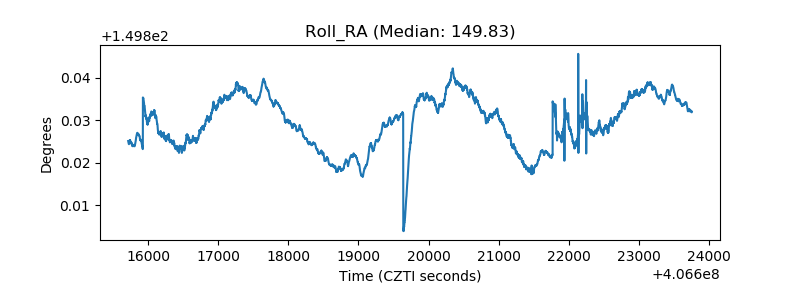 |
| Veto Counter | 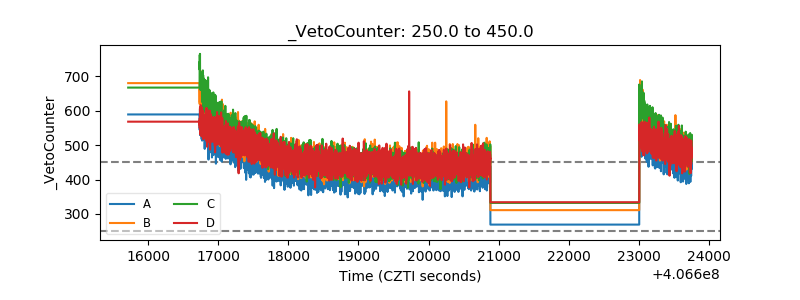 |