| Param | Original file | Final file |
|---|---|---|
| Filename | modeM0/AS1A12_061T03_9000005390_38637cztM0_level2.fits | modeM0/AS1A12_061T03_9000005390_38637cztM0_level2_quad_clean.evt |
| Size (bytes) | 340,669,440 | 91,782,720 |
| Size | 324.9 MB | 87.5 MB |
| Events in quadrant A | 2,817,177 | 623,286 |
| Events in quadrant B | 2,901,944 | 638,506 |
| Events in quadrant C | 3,137,476 | 609,748 |
| Events in quadrant D | 3,366,454 | 558,638 |
| Mode SS | |||
|---|---|---|---|
| Quadrant | BADHDUFLAG | Total packets | Discarded packets |
| A | 0 | 102 | 0 |
| B | 0 | 102 | 0 |
| C | 0 | 102 | 0 |
| D | 0 | 102 | 0 |
| Mode M9 | |||
|---|---|---|---|
| Quadrant | BADHDUFLAG | Total packets | Discarded packets |
| A | 0 | 21 | 0 |
| B | 0 | 21 | 0 |
| C | 0 | 21 | 0 |
| D | 0 | 21 | 0 |
| Mode M0 | |||
|---|---|---|---|
| Quadrant | BADHDUFLAG | Total packets | Discarded packets |
| A | 0 | 11148 | 3 |
| B | 0 | 11607 | 2 |
| C | 0 | 12285 | 2 |
| D | 0 | 13147 | 2 |
| Quadrant | Total seconds | Saturated seconds | Saturation percentage |
|---|---|---|---|
| A | 4978 | 22 | 0.441945% |
| B | 4978 | 43 | 0.863801% |
| C | 4978 | 93 | 1.868220% |
| D | 4978 | 136 | 2.732021% |
Noise dominated data is calculated using 1-second bins in cleaned event files. If a bin has >2000 counts, and if more than 50% of those come from <1% of pixels, then it is considered to be noise-dominated and hence unusable.
| Quadrant | # 1 sec bins | Bins with >0 counts | Bins with >2000 counts | High rate bins dominated by noise | Noise dominated (total time) | Noise dominated (detector-on time) | Marked lightcurve |
|---|---|---|---|---|---|---|---|
| A | 7099 | 4979 | 23 | 23 | 0.32% | 0.46% | 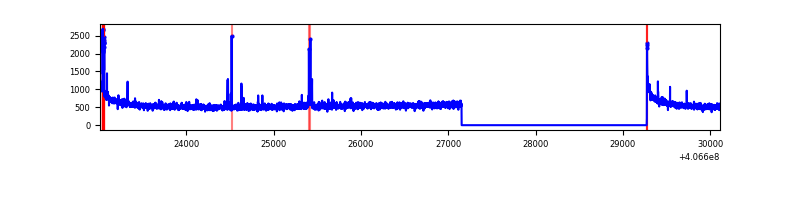 |
| B | 7099 | 4979 | 19 | 19 | 0.27% | 0.38% | 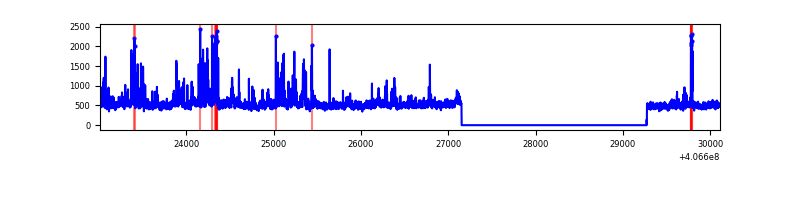 |
| C | 7099 | 4979 | 97 | 97 | 1.37% | 1.95% | 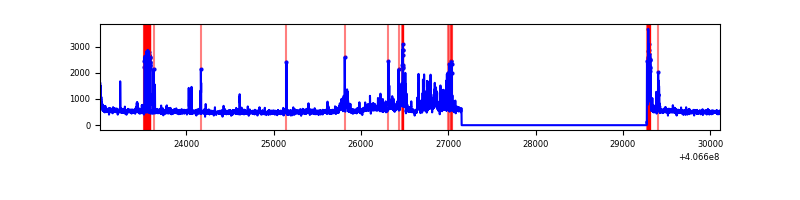 |
| D | 7099 | 4979 | 127 | 127 | 1.79% | 2.55% | 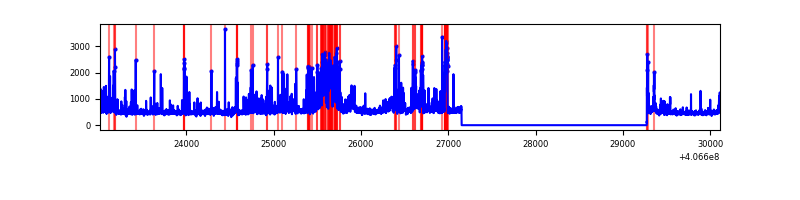 |
Top three noisy pixels from each quadrant. If the there are fewer than three noisy pixels in the level2.evt file, extra rows are filled as -1
| Pixel properties | Quadrant properties | ||||||
|---|---|---|---|---|---|---|---|
| Quadrant | DetID | PixID | Counts | Sigma | Mean | Median | Sigma |
| A | 10 | 83 | 391955 | 3231.15 | 602 | 591 | 121.1 |
| A | 13 | 248 | 48591 | 396.29 | 602 | 591 | 121.1 |
| A | 0 | 247 | 23899 | 192.43 | 602 | 591 | 121.1 |
| B | 4 | 171 | 404826 | 3524.8 | 596 | 580 | 114.7 |
| B | 0 | 155 | 72920 | 630.77 | 596 | 580 | 114.7 |
| B | 5 | 184 | 18342 | 154.87 | 596 | 580 | 114.7 |
| C | 14 | 254 | 452600 | 3321.63 | 588 | 594 | 136.1 |
| C | 15 | 214 | 202835 | 1486.2 | 588 | 594 | 136.1 |
| C | 15 | 159 | 88329 | 644.73 | 588 | 594 | 136.1 |
| D | 5 | 222 | 290447 | 2026.88 | 591 | 577 | 143.0 |
| D | 12 | 233 | 166242 | 1158.39 | 591 | 577 | 143.0 |
| D | 2 | 249 | 156339 | 1089.15 | 591 | 577 | 143.0 |
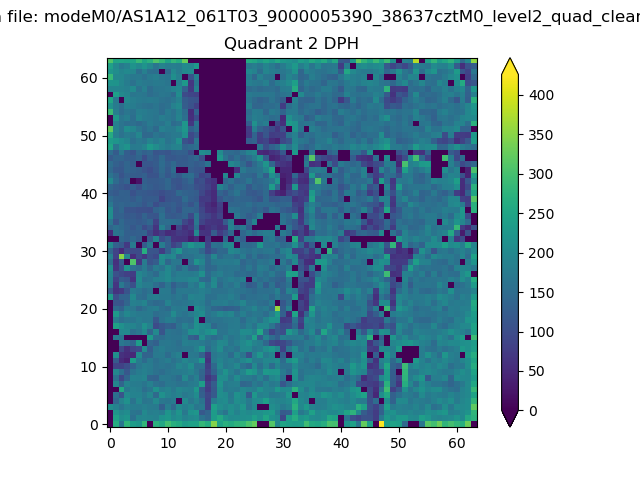
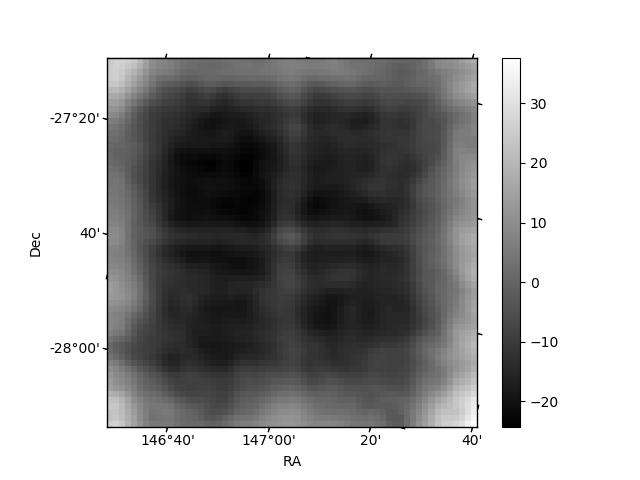
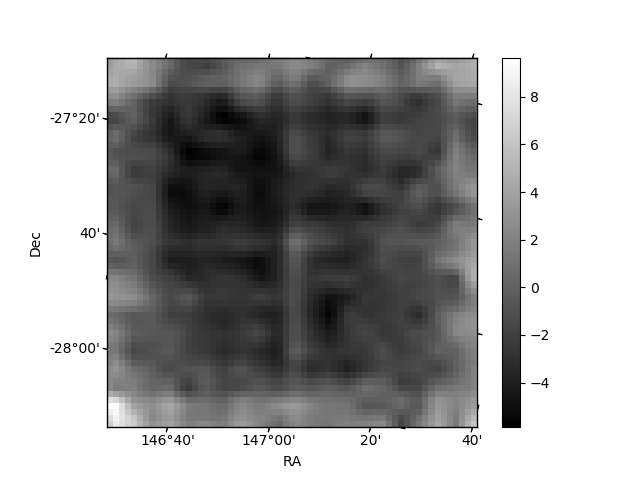
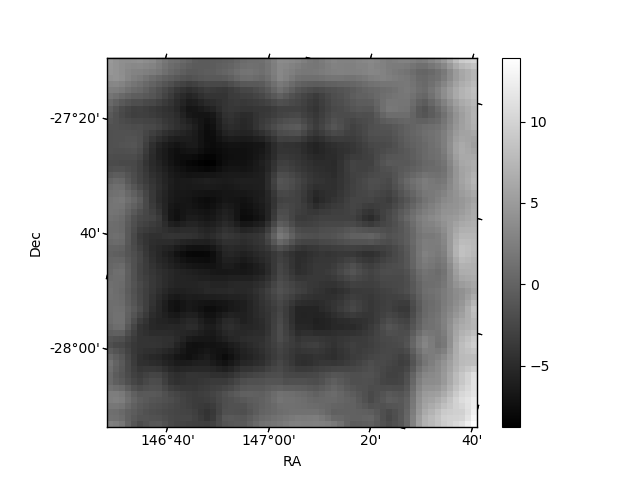
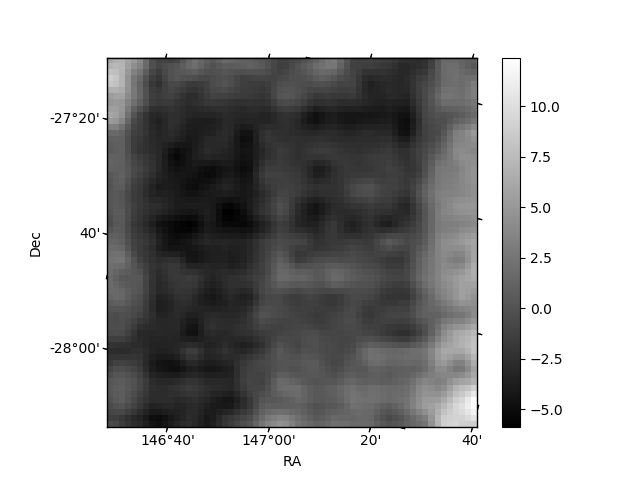
Histogram calculated using DETX and DETY for each event in the final _common_clean file
| Quadrant A | 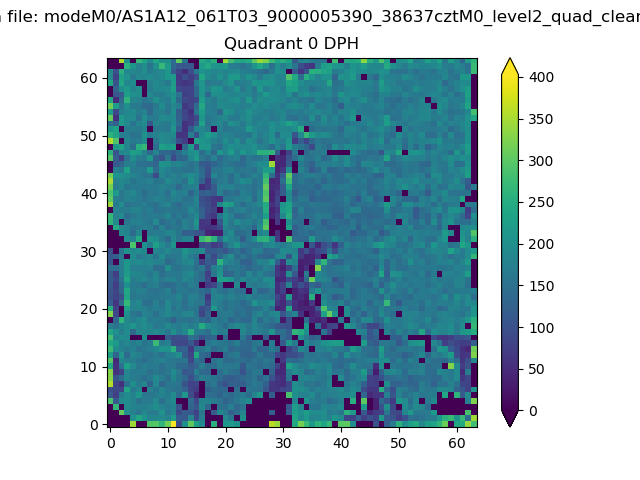 |
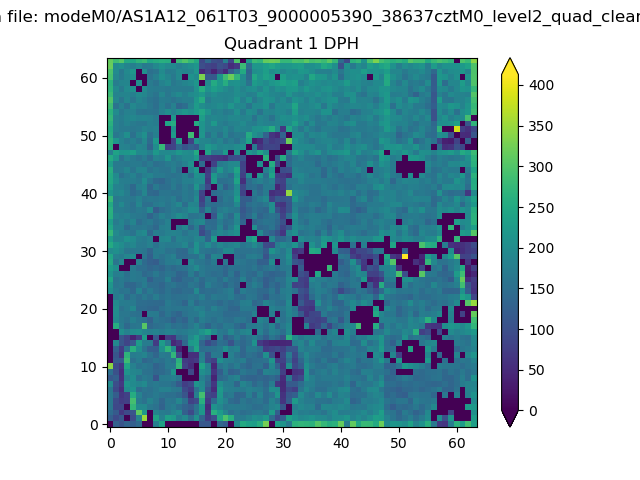 |
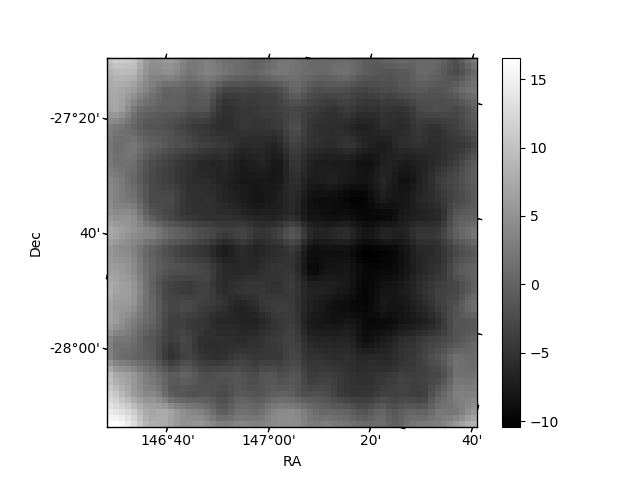
Quadrant B |
|---|---|---|---|
| Quadrant D | 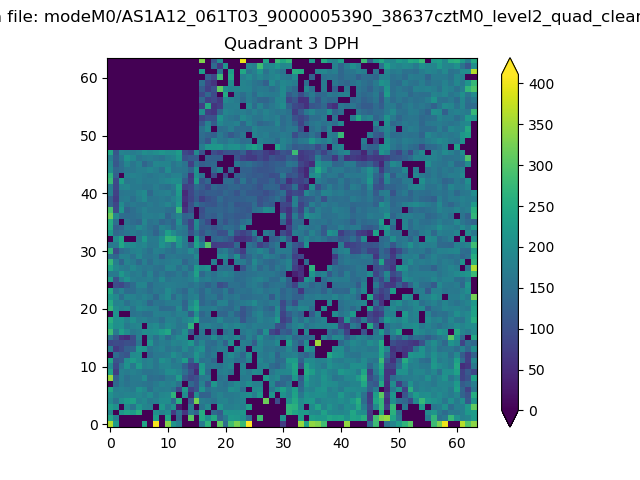 |
 |
Quadrant C |
| Plot type | Count rate plots | Images |
|---|---|---|
| Comparison with Poisson distribution Blue bars denote a histogram of data divided into 1 sec bins. Red curve is a Poisson curve with rate = median count rate of data. |
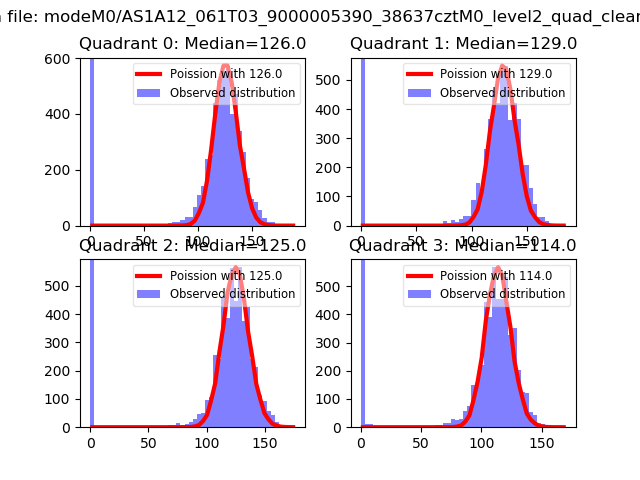 |
 |
| Quadrant-wise count rates Data is divided into 100 sec bins |
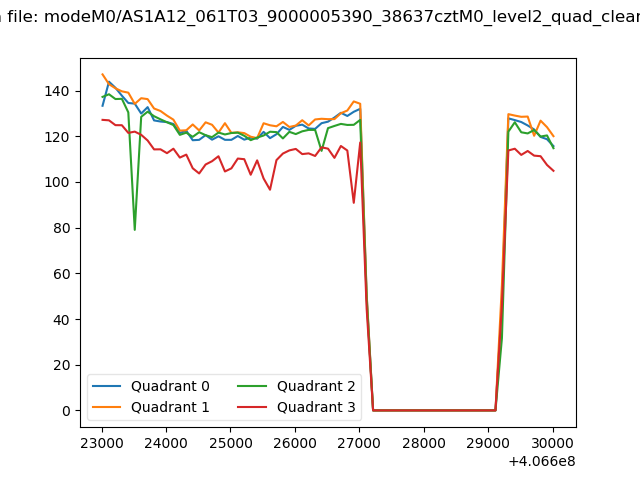 |
|
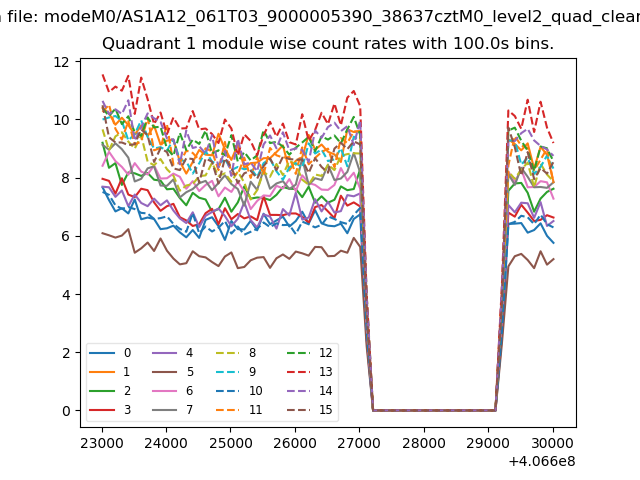
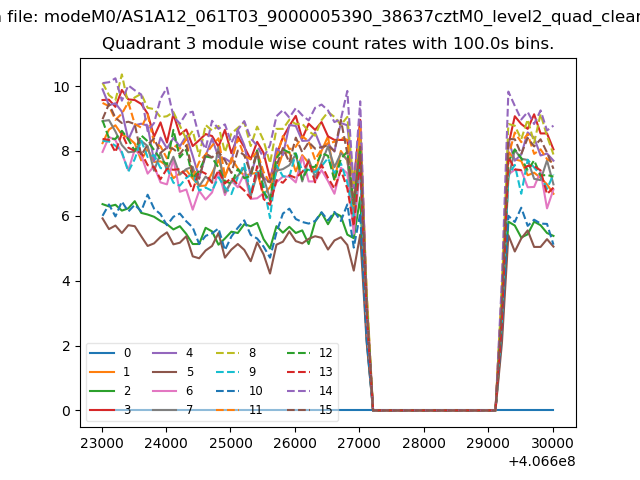
| Module-wise count rates for Quadrant A Data is divided into 100 sec bins |
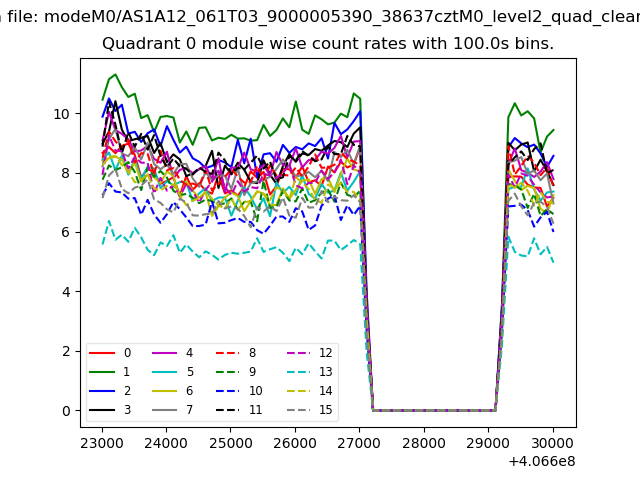 |
 |
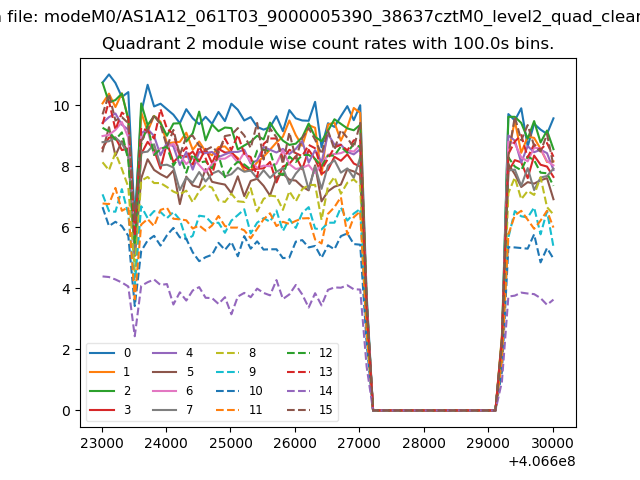
| Module-wise count rates for Quadrant B Data is divided into 100 sec bins |
 |
 |
| Module-wise count rates for Quadrant C Data is divided into 100 sec bins |
 |
 |
| Module-wise count rates for Quadrant D Data is divided into 100 sec bins |
 |
 |
| Parameter | Plot |
|---|---|
| CZT HV Monitor | 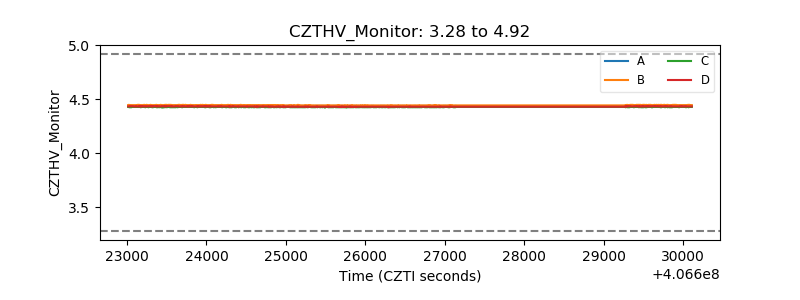 |
| D_VDD | 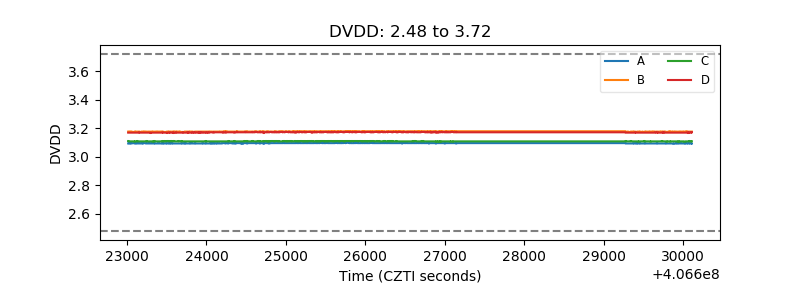 |
| Temperature 1 | 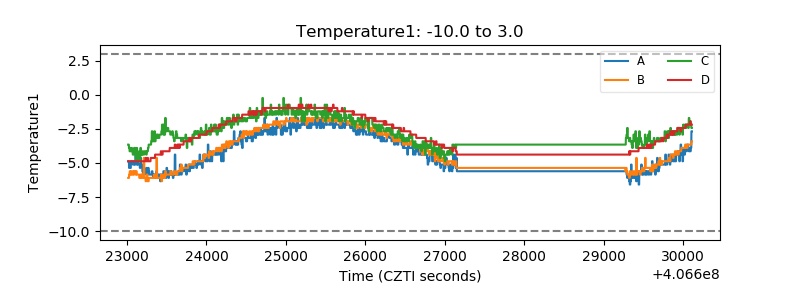 |
| Veto HV Monitor | 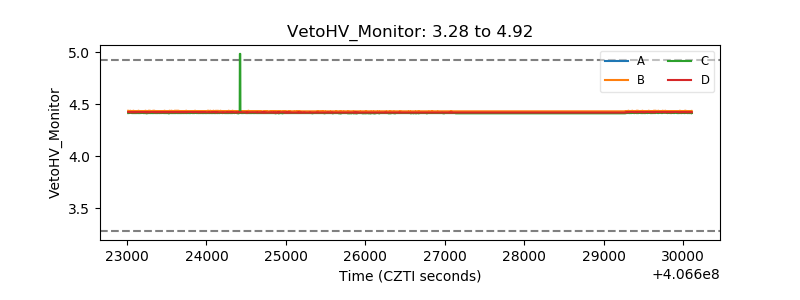 |
| Veto LLD | 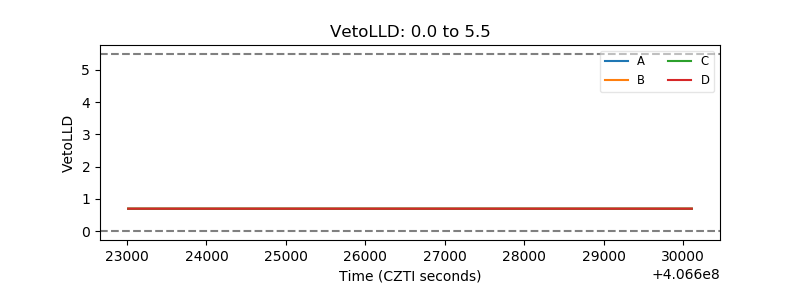 |
| Alpha Counter | 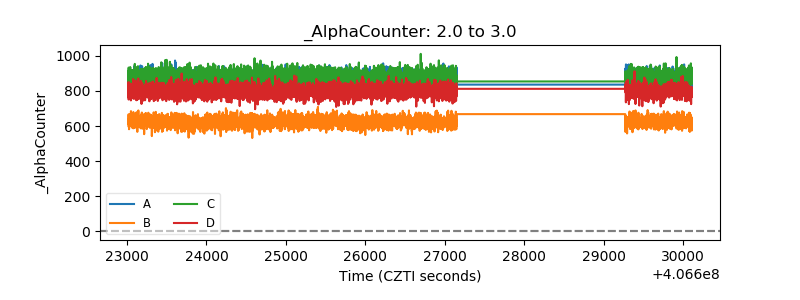 |
| _CPM_Rate | 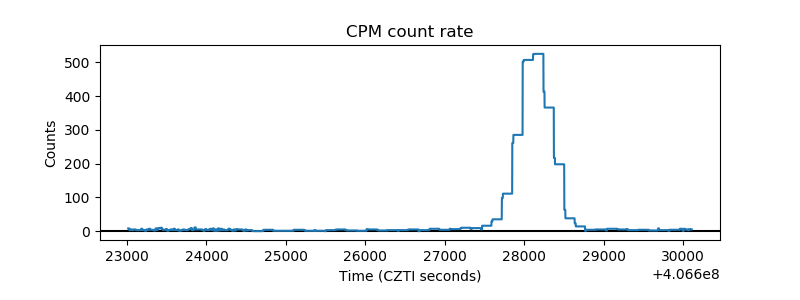 |
| CZT Counter | 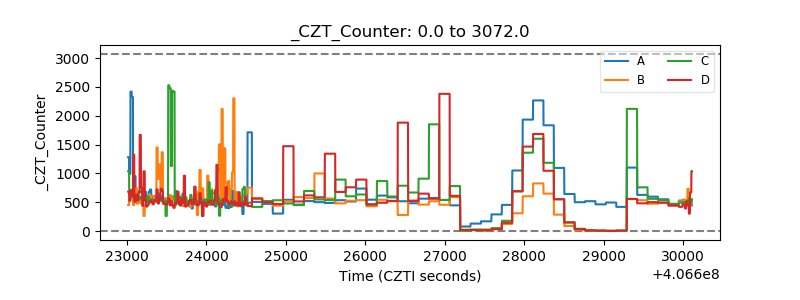 |
| +2.5 Volts monitor | 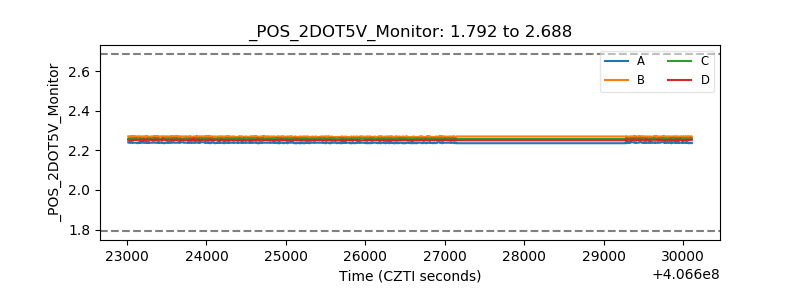 |
| +5 Volts monitor | 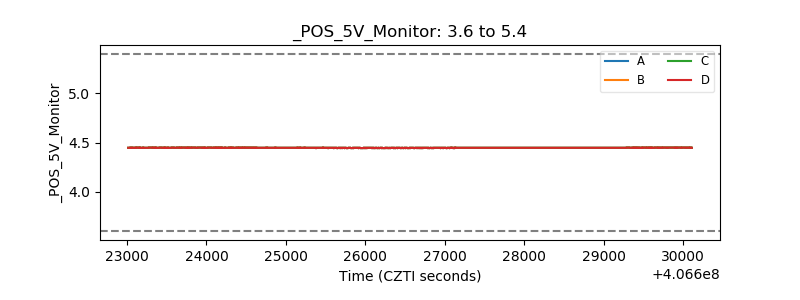 |
| _ROLL_ROT | 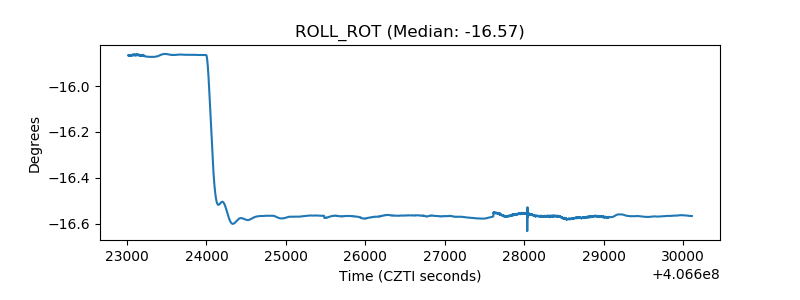 |
| _Roll_DEC | 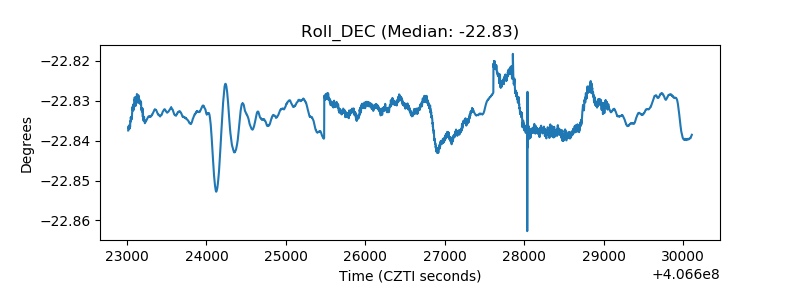 |
| _Roll_RA | 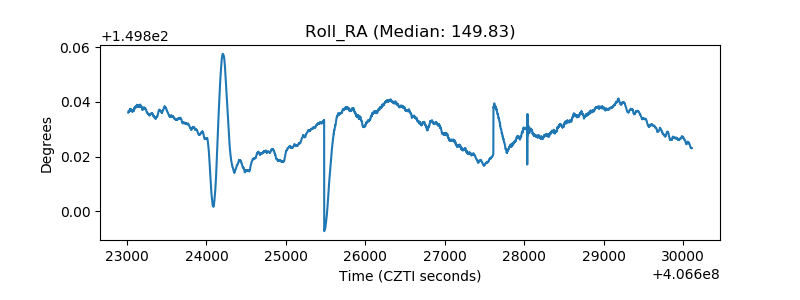 |
| Veto Counter | 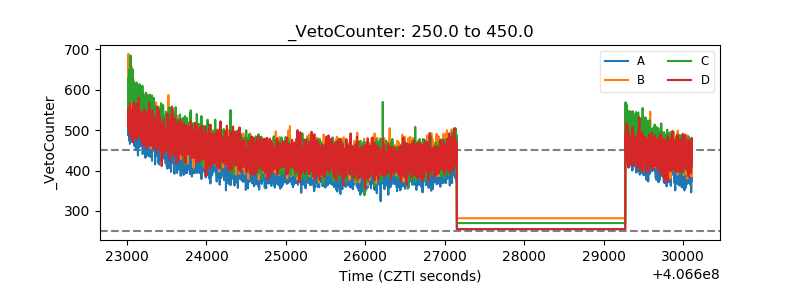 |