| Param | Original file | Final file |
|---|---|---|
| Filename | modeM0/AS1A12_061T03_9000005390_38638cztM0_level2.fits | modeM0/AS1A12_061T03_9000005390_38638cztM0_level2_quad_clean.evt |
| Size (bytes) | 327,689,280 | 88,920,000 |
| Size | 312.5 MB | 84.8 MB |
| Events in quadrant A | 3,100,193 | 595,279 |
| Events in quadrant B | 2,889,173 | 608,003 |
| Events in quadrant C | 2,860,472 | 590,034 |
| Events in quadrant D | 2,887,628 | 545,708 |
| Mode SS | |||
|---|---|---|---|
| Quadrant | BADHDUFLAG | Total packets | Discarded packets |
| A | 0 | 104 | 0 |
| B | 0 | 104 | 0 |
| C | 0 | 104 | 0 |
| D | 0 | 104 | 0 |
| Mode M9 | |||
|---|---|---|---|
| Quadrant | BADHDUFLAG | Total packets | Discarded packets |
| A | 0 | 23 | 0 |
| B | 0 | 23 | 0 |
| C | 0 | 23 | 0 |
| D | 0 | 24 | 0 |
| Mode M0 | |||
|---|---|---|---|
| Quadrant | BADHDUFLAG | Total packets | Discarded packets |
| A | 0 | 12173 | 3 |
| B | 0 | 11608 | 2 |
| C | 0 | 11410 | 2 |
| D | 0 | 11699 | 2 |
| Quadrant | Total seconds | Saturated seconds | Saturation percentage |
|---|---|---|---|
| A | 5042 | 63 | 1.249504% |
| B | 5042 | 110 | 2.181674% |
| C | 5042 | 53 | 1.051170% |
| D | 5042 | 45 | 0.892503% |
Noise dominated data is calculated using 1-second bins in cleaned event files. If a bin has >2000 counts, and if more than 50% of those come from <1% of pixels, then it is considered to be noise-dominated and hence unusable.
| Quadrant | # 1 sec bins | Bins with >0 counts | Bins with >2000 counts | High rate bins dominated by noise | Noise dominated (total time) | Noise dominated (detector-on time) | Marked lightcurve |
|---|---|---|---|---|---|---|---|
| A | 7045 | 5043 | 48 | 48 | 0.68% | 0.95% | 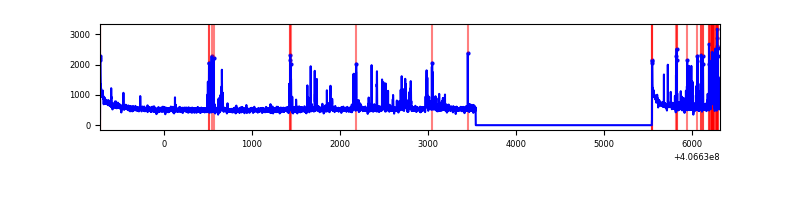 |
| B | 7045 | 5043 | 71 | 71 | 1.01% | 1.41% | 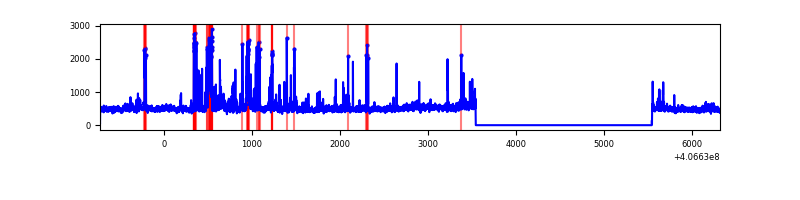 |
| C | 7045 | 5043 | 49 | 49 | 0.70% | 0.97% | 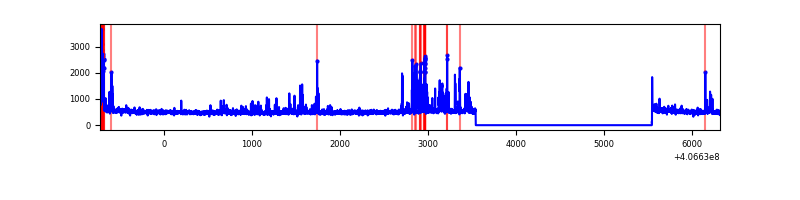 |
| D | 7045 | 5043 | 33 | 33 | 0.47% | 0.65% | 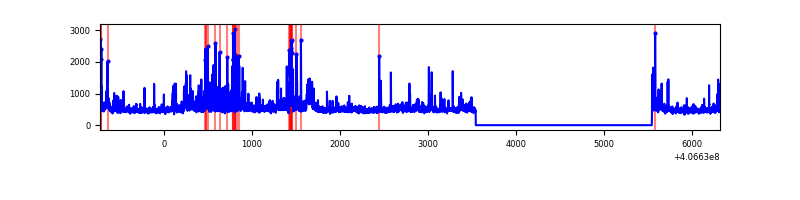 |
Top three noisy pixels from each quadrant. If the there are fewer than three noisy pixels in the level2.evt file, extra rows are filled as -1
| Pixel properties | Quadrant properties | ||||||
|---|---|---|---|---|---|---|---|
| Quadrant | DetID | PixID | Counts | Sigma | Mean | Median | Sigma |
| A | 10 | 83 | 402725 | 3348.57 | 592 | 581 | 120.1 |
| A | 13 | 248 | 250946 | 2084.74 | 592 | 581 | 120.1 |
| A | 15 | 174 | 48626 | 400.06 | 592 | 581 | 120.1 |
| B | 4 | 171 | 301841 | 2665.9 | 585 | 570 | 113.0 |
| B | 5 | 184 | 91990 | 808.96 | 585 | 570 | 113.0 |
| B | 0 | 155 | 48579 | 424.82 | 585 | 570 | 113.0 |
| C | 15 | 214 | 205218 | 1501.58 | 580 | 585 | 136.3 |
| C | 3 | 110 | 171197 | 1251.93 | 580 | 585 | 136.3 |
| C | 15 | 159 | 80417 | 585.8 | 580 | 585 | 136.3 |
| D | 12 | 233 | 135538 | 938.76 | 585 | 568 | 143.8 |
| D | 13 | 249 | 85178 | 588.49 | 585 | 568 | 143.8 |
| D | 2 | 16 | 68460 | 472.21 | 585 | 568 | 143.8 |
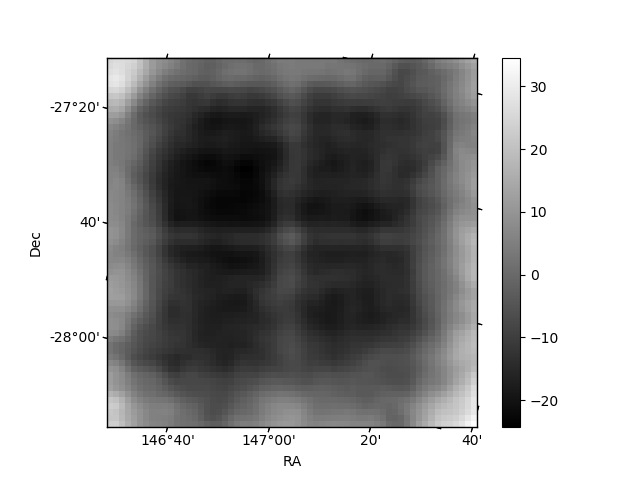
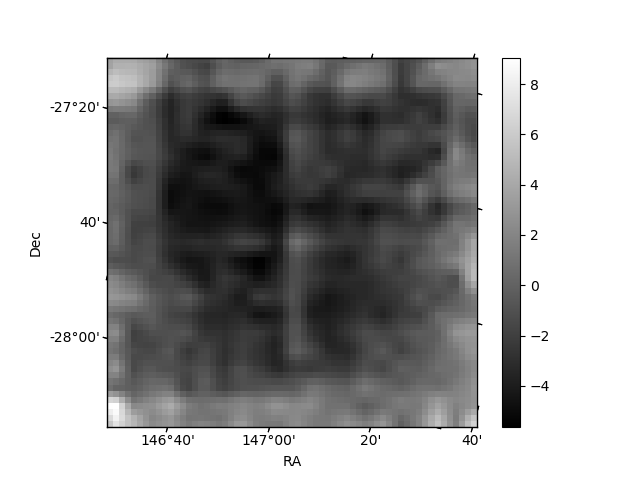
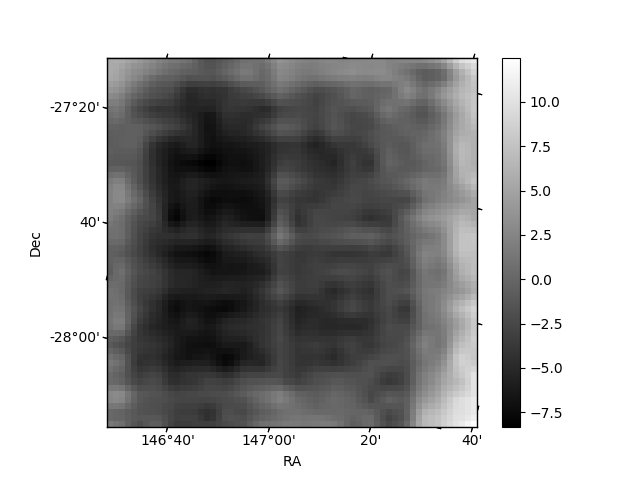
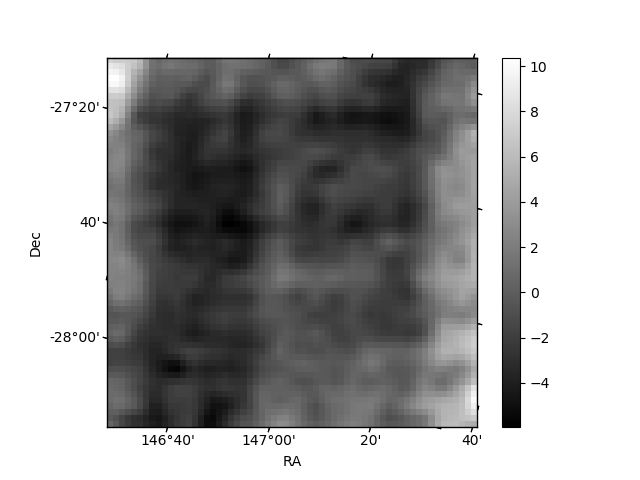
Histogram calculated using DETX and DETY for each event in the final _common_clean file
| Quadrant A | 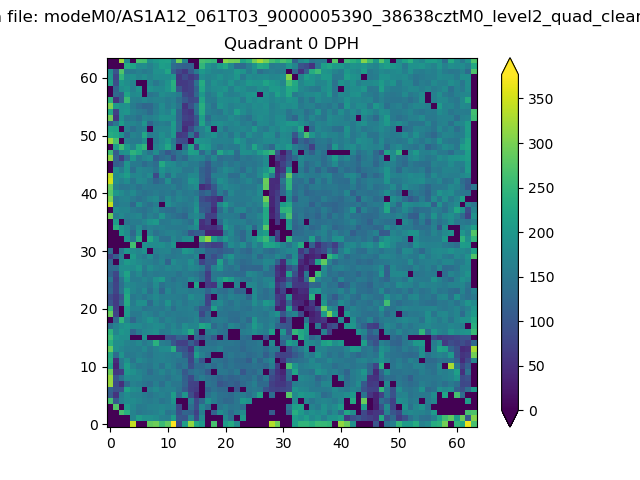 |
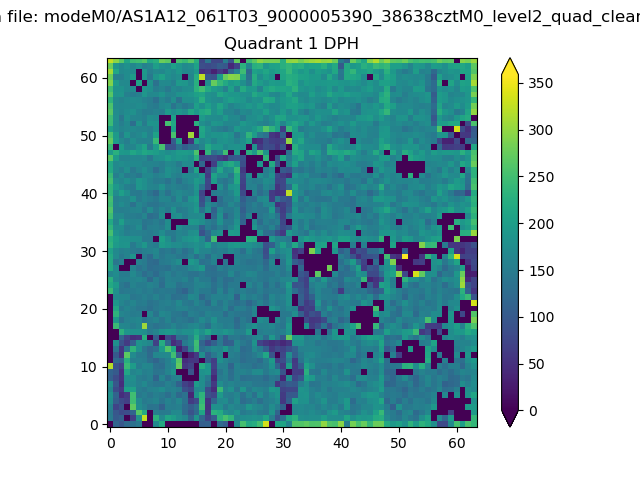 |
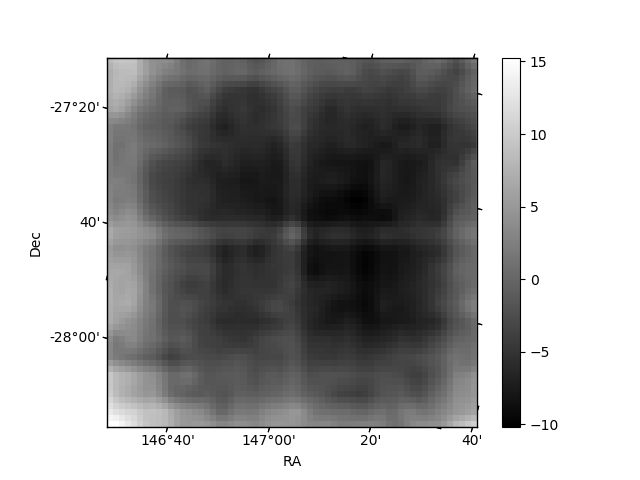
Quadrant B |
|---|---|---|---|
| Quadrant D | 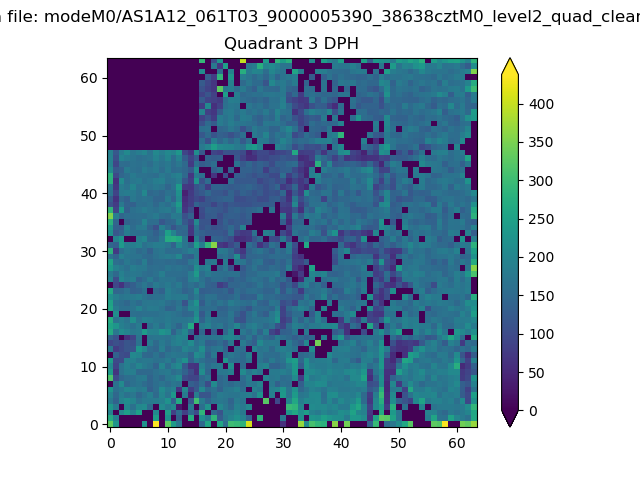 |
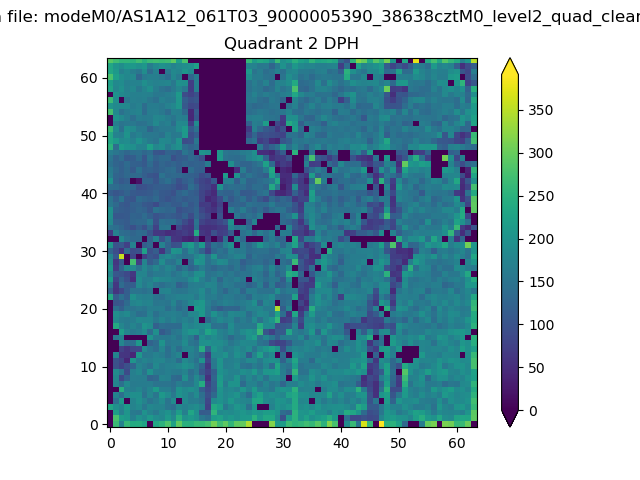 |
Quadrant C |
| Plot type | Count rate plots | Images |
|---|---|---|
| Comparison with Poisson distribution Blue bars denote a histogram of data divided into 1 sec bins. Red curve is a Poisson curve with rate = median count rate of data. |
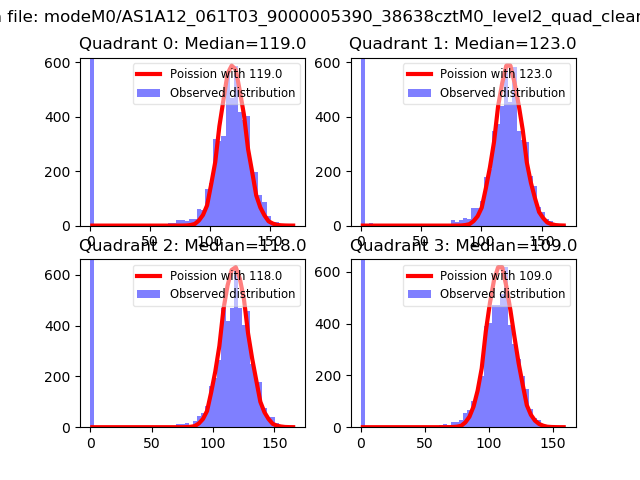 |
 |
| Quadrant-wise count rates Data is divided into 100 sec bins |
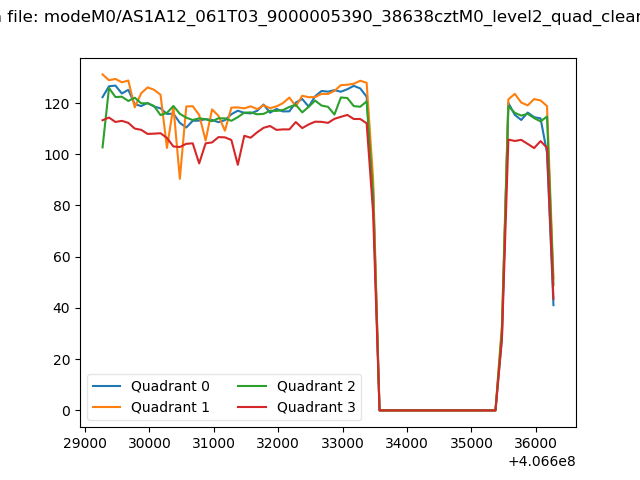 |
|
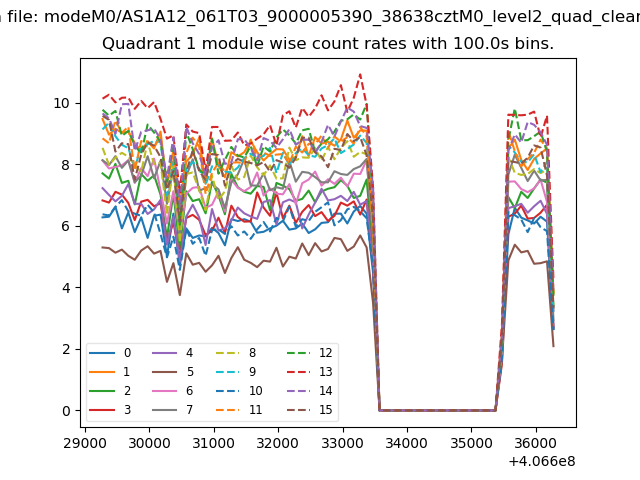
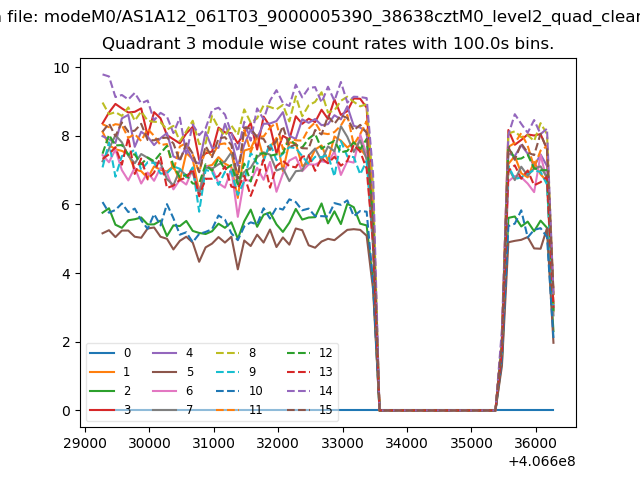
| Module-wise count rates for Quadrant A Data is divided into 100 sec bins |
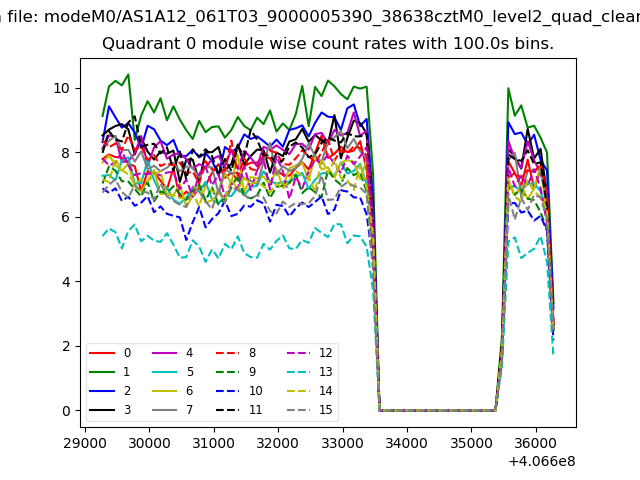 |
 |
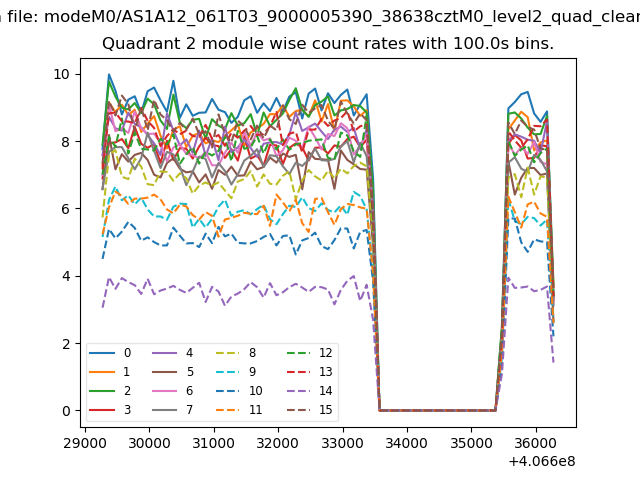
| Module-wise count rates for Quadrant B Data is divided into 100 sec bins |
 |
 |
| Module-wise count rates for Quadrant C Data is divided into 100 sec bins |
 |
 |
| Module-wise count rates for Quadrant D Data is divided into 100 sec bins |
 |
 |
| Parameter | Plot |
|---|---|
| CZT HV Monitor | 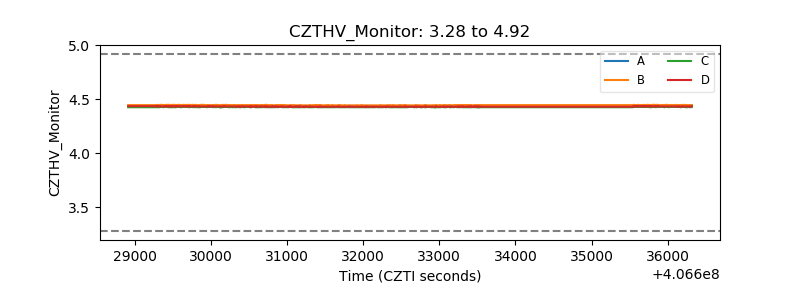 |
| D_VDD | 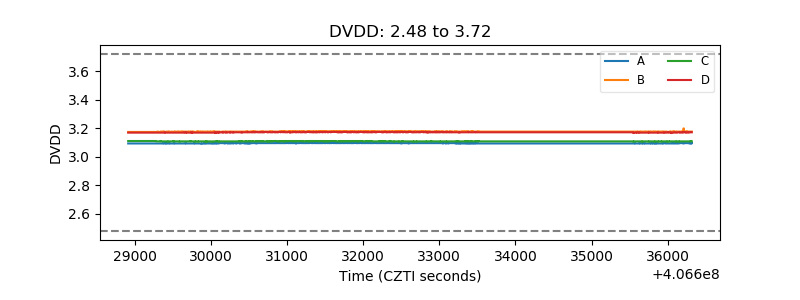 |
| Temperature 1 | 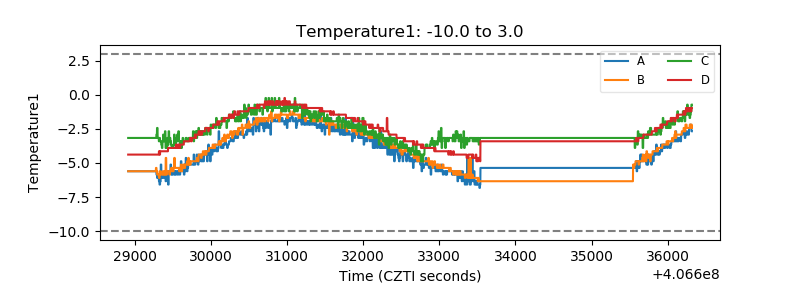 |
| Veto HV Monitor | 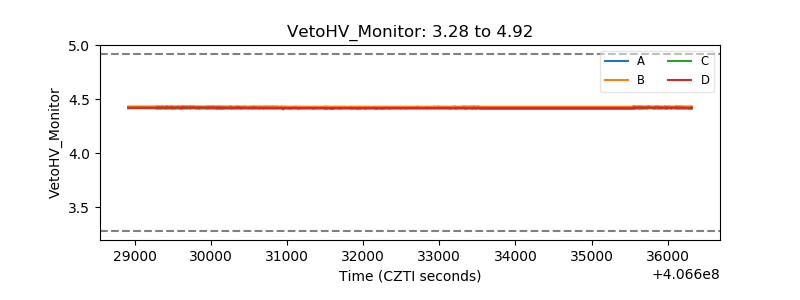 |
| Veto LLD | 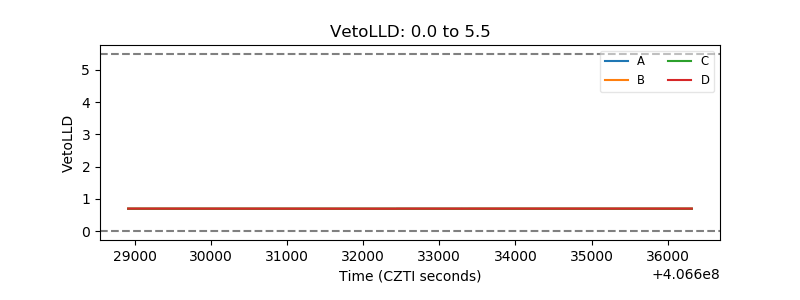 |
| Alpha Counter | 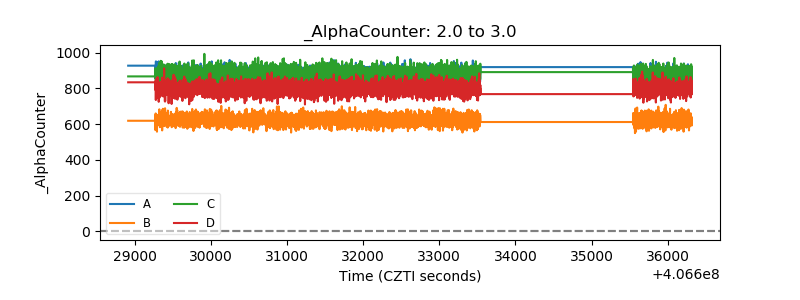 |
| _CPM_Rate | 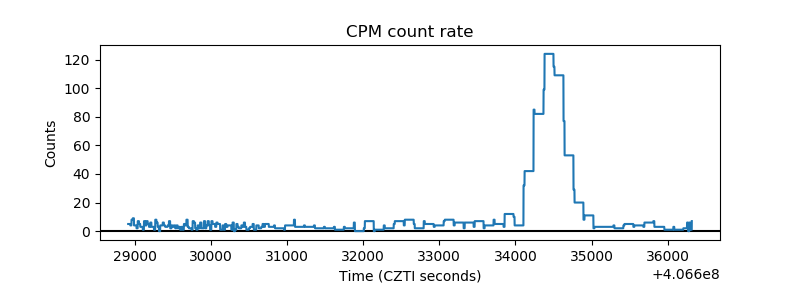 |
| CZT Counter | 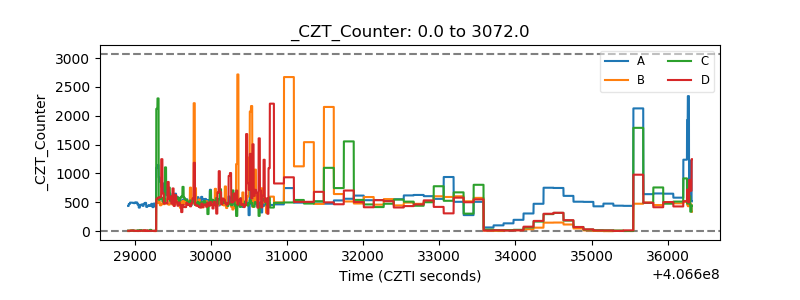 |
| +2.5 Volts monitor |  |
| +5 Volts monitor | 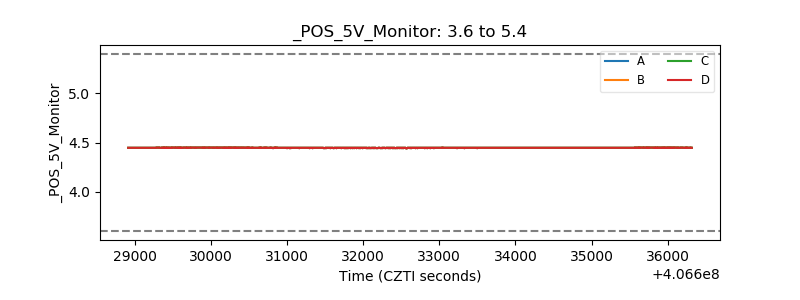 |
| _ROLL_ROT | 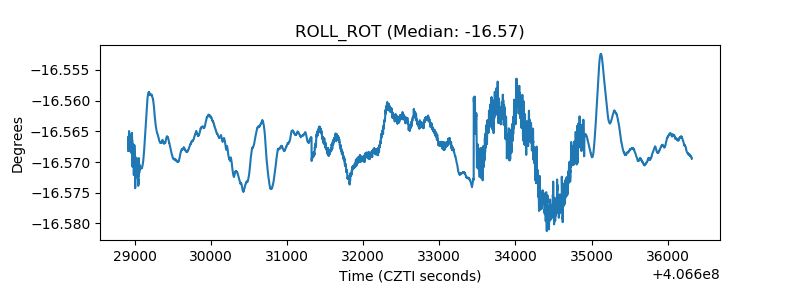 |
| _Roll_DEC | 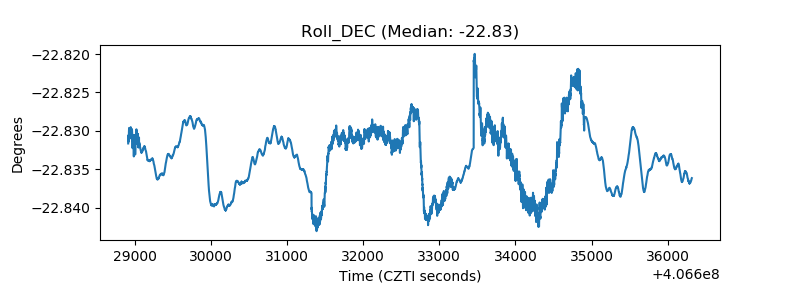 |
| _Roll_RA | 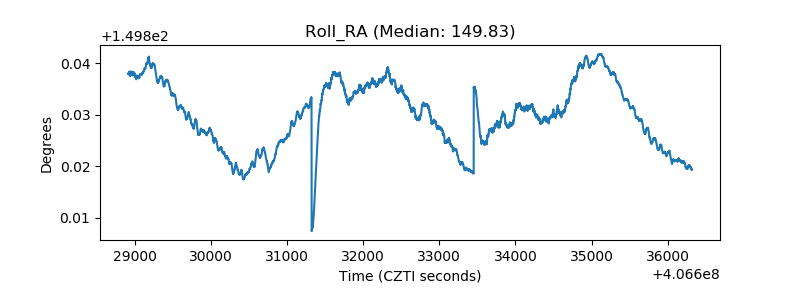 |
| Veto Counter | 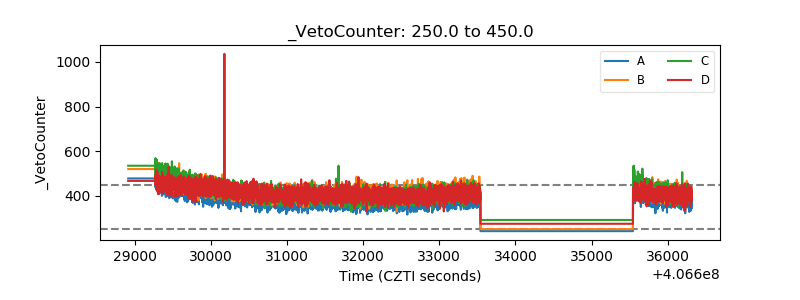 |