| Param | Original file | Final file |
|---|---|---|
| Filename | modeM0/AS1A12_061T03_9000005390_38639cztM0_level2.fits | modeM0/AS1A12_061T03_9000005390_38639cztM0_level2_quad_clean.evt |
| Size (bytes) | 385,744,320 | 88,182,720 |
| Size | 367.9 MB | 84.1 MB |
| Events in quadrant A | 3,192,035 | 603,654 |
| Events in quadrant B | 3,112,726 | 603,015 |
| Events in quadrant C | 2,779,178 | 602,888 |
| Events in quadrant D | 4,781,625 | 488,593 |
| Mode SS | |||
|---|---|---|---|
| Quadrant | BADHDUFLAG | Total packets | Discarded packets |
| A | 0 | 108 | 0 |
| B | 0 | 108 | 0 |
| C | 0 | 108 | 0 |
| D | 0 | 108 | 0 |
| Mode M9 | |||
|---|---|---|---|
| Quadrant | BADHDUFLAG | Total packets | Discarded packets |
| A | 0 | 21 | 0 |
| B | 0 | 21 | 0 |
| C | 0 | 21 | 0 |
| D | 0 | 22 | 0 |
| Mode M0 | |||
|---|---|---|---|
| Quadrant | BADHDUFLAG | Total packets | Discarded packets |
| A | 0 | 12685 | 3 |
| B | 0 | 12532 | 2 |
| C | 0 | 11345 | 2 |
| D | 0 | 17671 | 2 |
| Quadrant | Total seconds | Saturated seconds | Saturation percentage |
|---|---|---|---|
| A | 5311 | 79 | 1.487479% |
| B | 5311 | 209 | 3.935229% |
| C | 5311 | 7 | 0.131802% |
| D | 5311 | 723 | 13.613256% |
Noise dominated data is calculated using 1-second bins in cleaned event files. If a bin has >2000 counts, and if more than 50% of those come from <1% of pixels, then it is considered to be noise-dominated and hence unusable.
| Quadrant | # 1 sec bins | Bins with >0 counts | Bins with >2000 counts | High rate bins dominated by noise | Noise dominated (total time) | Noise dominated (detector-on time) | Marked lightcurve |
|---|---|---|---|---|---|---|---|
| A | 7014 | 5311 | 62 | 62 | 0.88% | 1.17% | 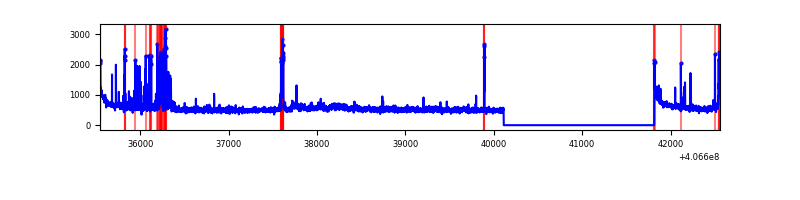 |
| B | 7014 | 5311 | 155 | 155 | 2.21% | 2.92% | 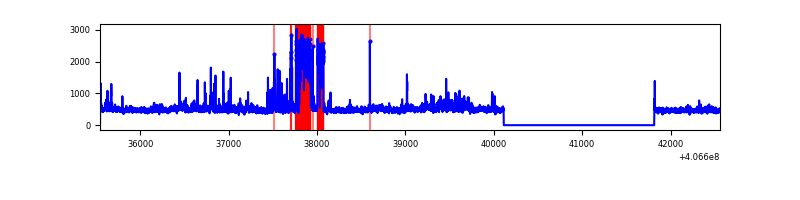 |
| C | 7014 | 5311 | 3 | 3 | 0.04% | 0.06% | 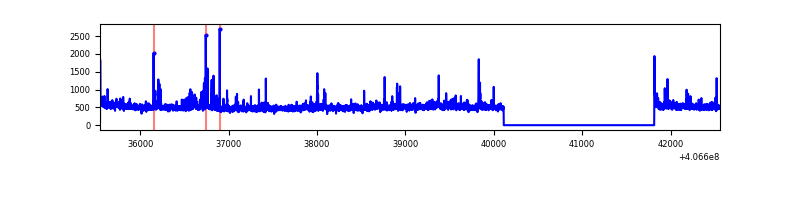 |
| D | 7014 | 5311 | 697 | 697 | 9.94% | 13.12% | 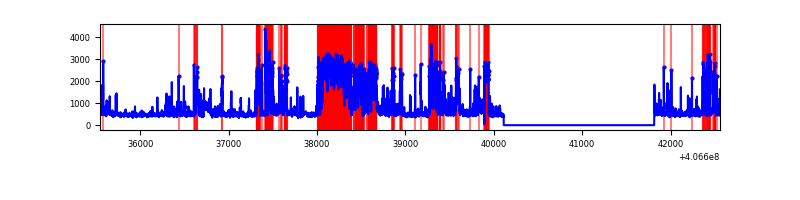 |
Top three noisy pixels from each quadrant. If the there are fewer than three noisy pixels in the level2.evt file, extra rows are filled as -1
| Pixel properties | Quadrant properties | ||||||
|---|---|---|---|---|---|---|---|
| Quadrant | DetID | PixID | Counts | Sigma | Mean | Median | Sigma |
| A | 10 | 83 | 422825 | 3368.48 | 610 | 597 | 125.3 |
| A | 13 | 248 | 241932 | 1925.34 | 610 | 597 | 125.3 |
| A | 10 | 255 | 53907 | 425.3 | 610 | 597 | 125.3 |
| B | 4 | 171 | 544517 | 4702.86 | 598 | 580 | 115.7 |
| B | 0 | 155 | 100913 | 867.48 | 598 | 580 | 115.7 |
| B | 5 | 184 | 42324 | 360.92 | 598 | 580 | 115.7 |
| C | 15 | 214 | 214764 | 1517.44 | 599 | 601 | 141.1 |
| C | 14 | 254 | 98014 | 690.21 | 599 | 601 | 141.1 |
| C | 3 | 110 | 92910 | 654.05 | 599 | 601 | 141.1 |
| D | 2 | 249 | 1322465 | 9345.56 | 564 | 547 | 141.4 |
| D | 13 | 249 | 538989 | 3806.62 | 564 | 547 | 141.4 |
| D | 12 | 233 | 414312 | 2925.19 | 564 | 547 | 141.4 |
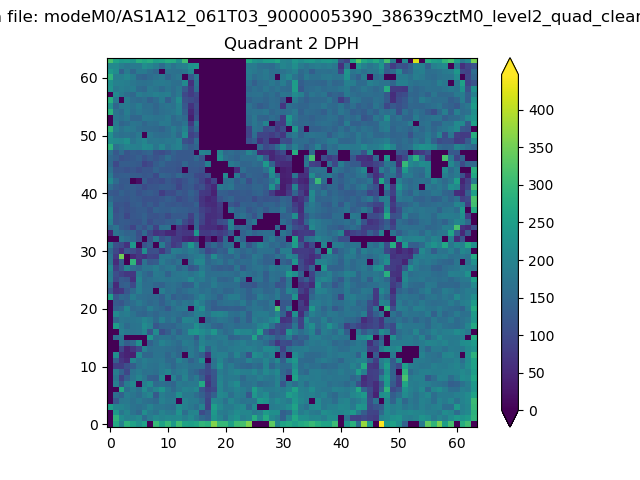
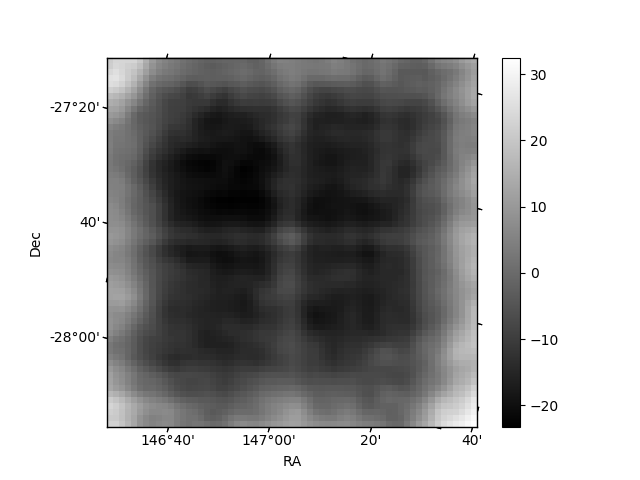
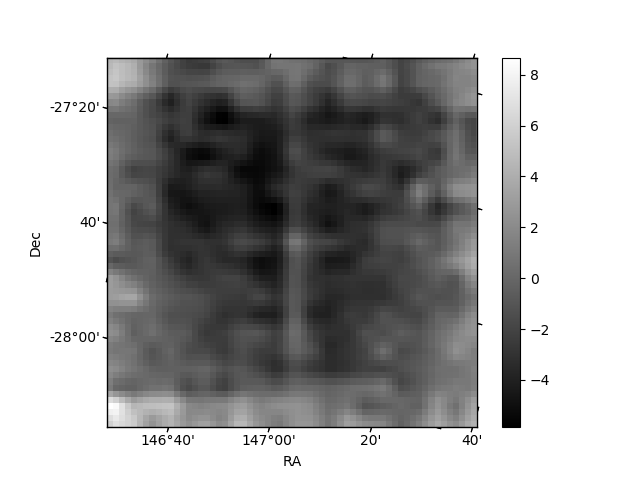
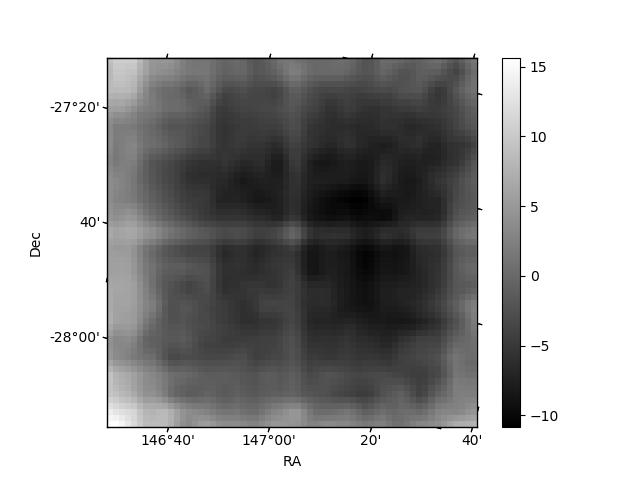
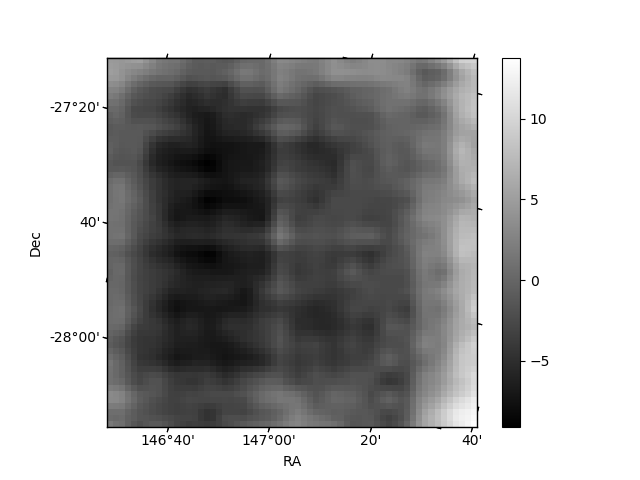
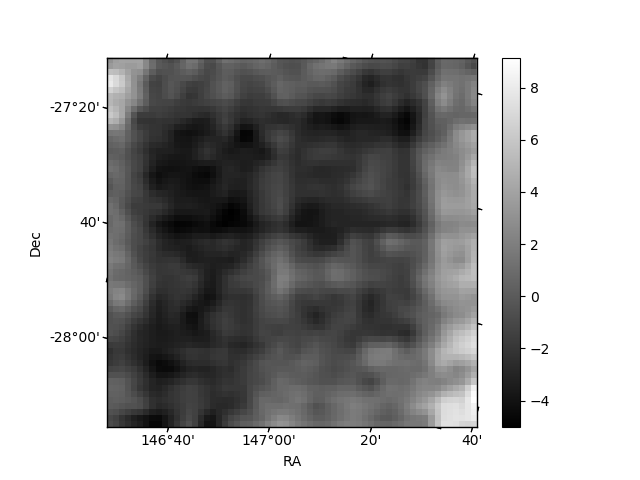
Histogram calculated using DETX and DETY for each event in the final _common_clean file
| Quadrant A | 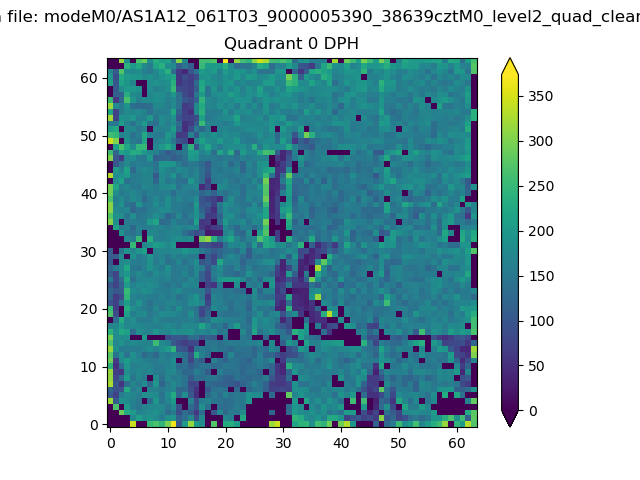 |
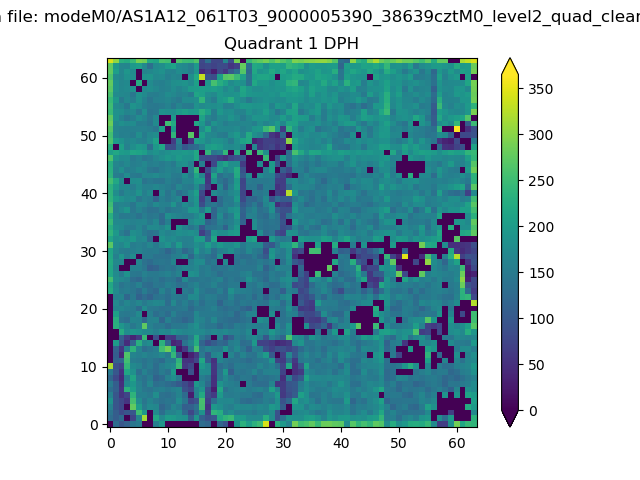 |
Quadrant B |
|---|---|---|---|
| Quadrant D | 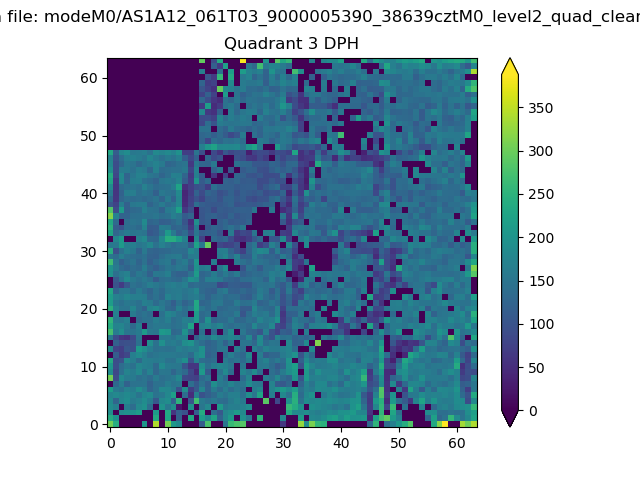 |
 |
Quadrant C |
| Plot type | Count rate plots | Images |
|---|---|---|
| Comparison with Poisson distribution Blue bars denote a histogram of data divided into 1 sec bins. Red curve is a Poisson curve with rate = median count rate of data. |
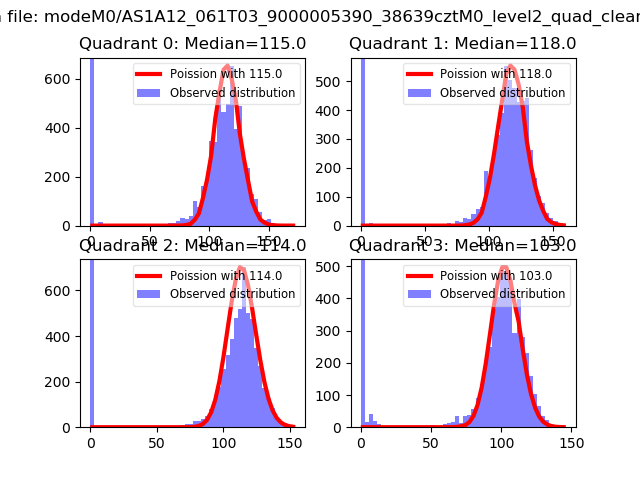 |
 |
| Quadrant-wise count rates Data is divided into 100 sec bins |
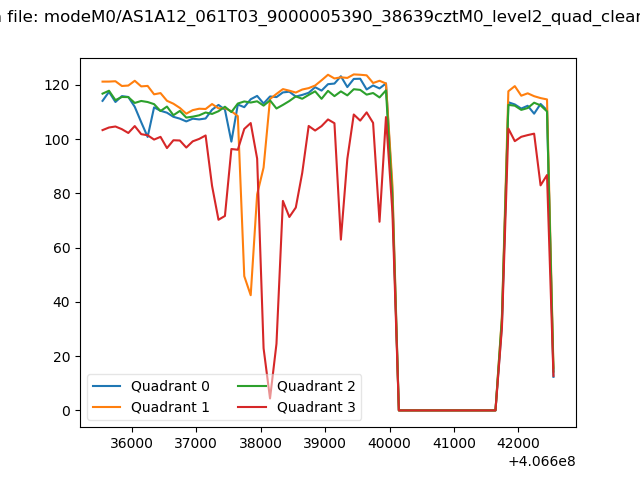 |
|
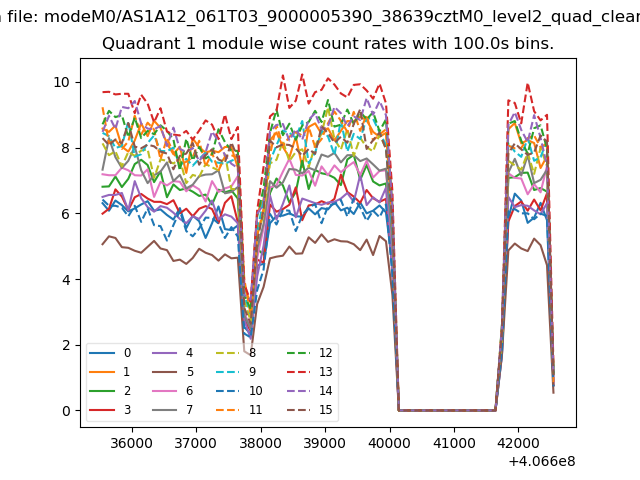
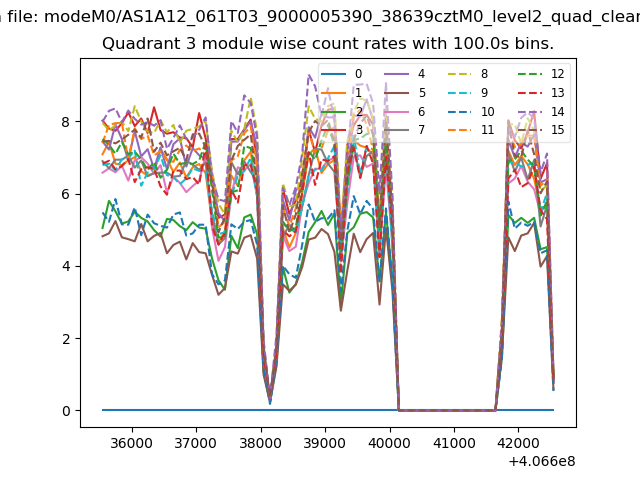
| Module-wise count rates for Quadrant A Data is divided into 100 sec bins |
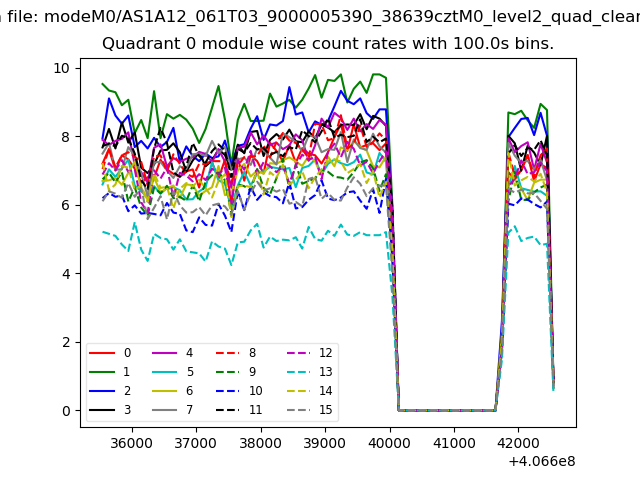 |
 |
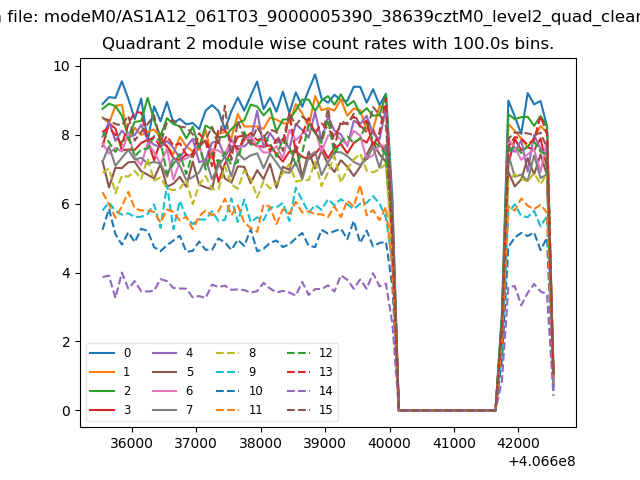
| Module-wise count rates for Quadrant B Data is divided into 100 sec bins |
 |
 |
| Module-wise count rates for Quadrant C Data is divided into 100 sec bins |
 |
 |
| Module-wise count rates for Quadrant D Data is divided into 100 sec bins |
 |
 |
| Parameter | Plot |
|---|---|
| CZT HV Monitor | 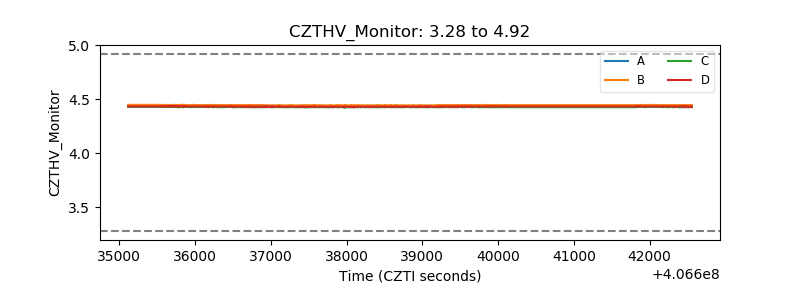 |
| D_VDD | 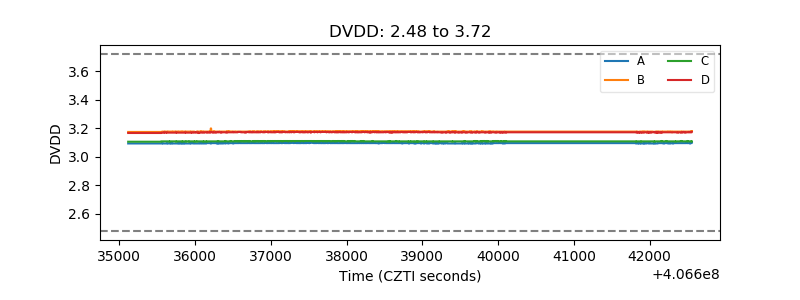 |
| Temperature 1 | 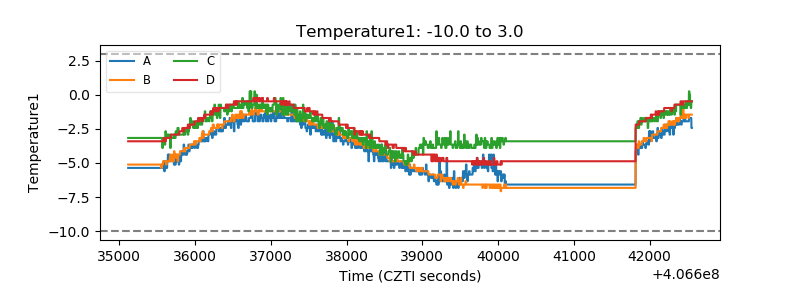 |
| Veto HV Monitor |  |
| Veto LLD | 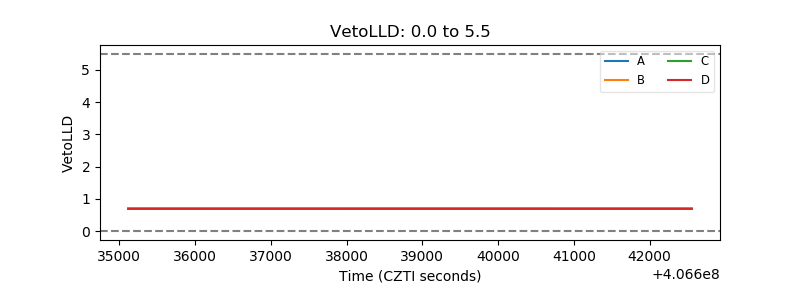 |
| Alpha Counter | 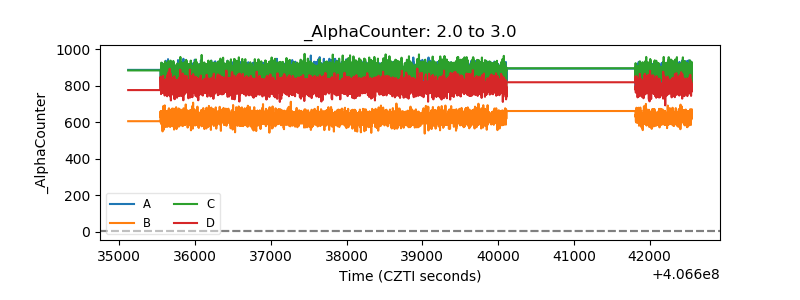 |
| _CPM_Rate | 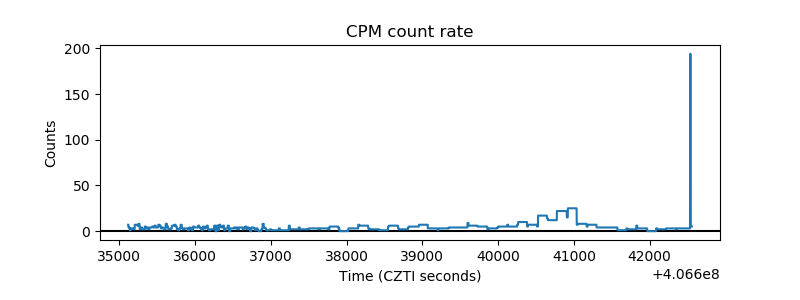 |
| CZT Counter | 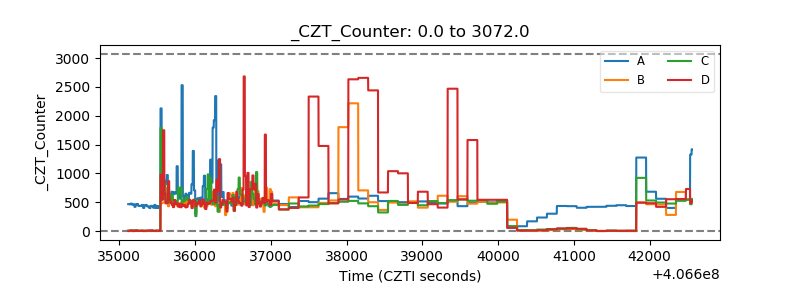 |
| +2.5 Volts monitor | 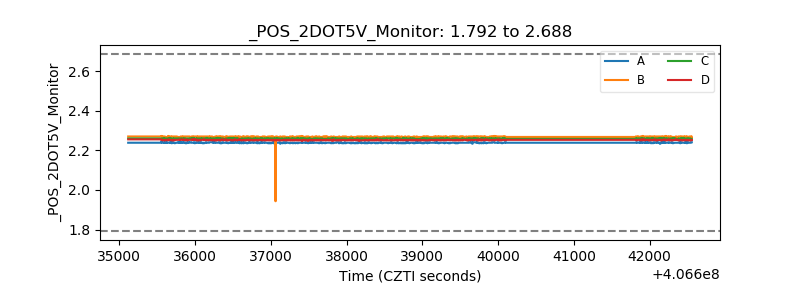 |
| +5 Volts monitor | 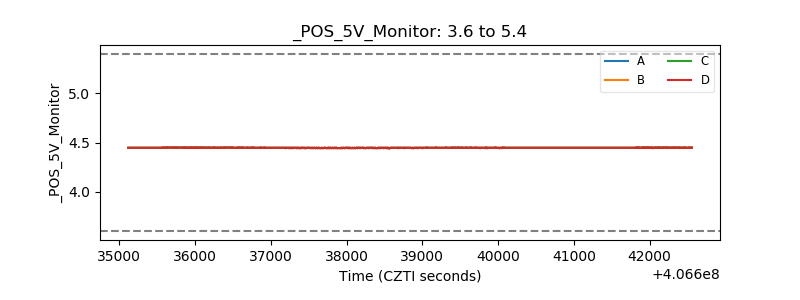 |
| _ROLL_ROT | 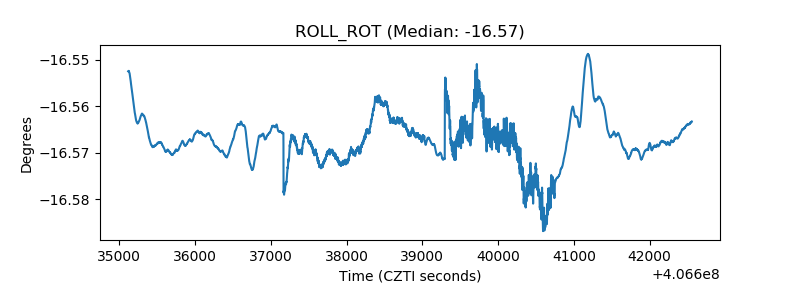 |
| _Roll_DEC | 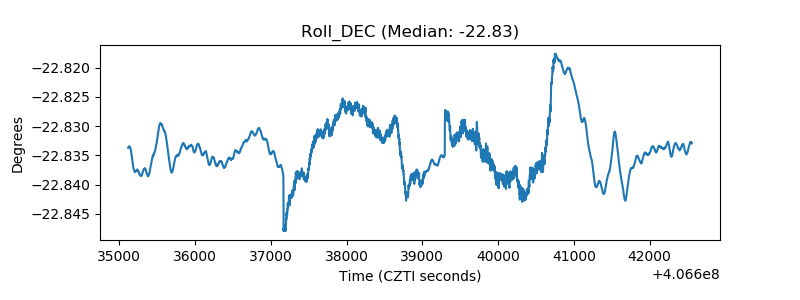 |
| _Roll_RA | 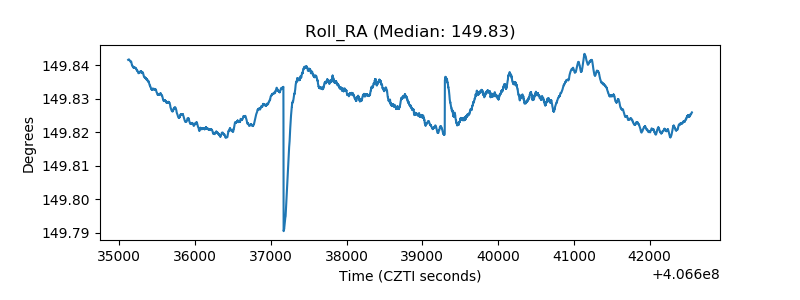 |
| Veto Counter | 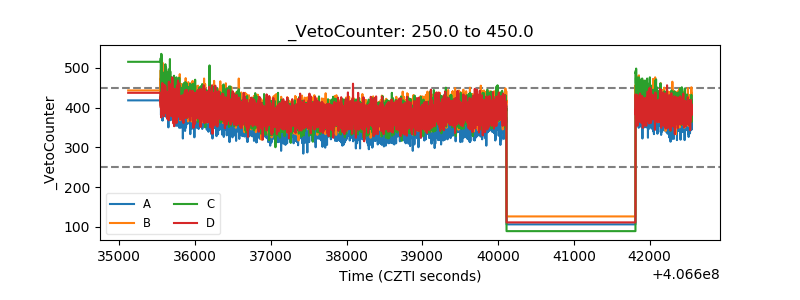 |