| Param | Original file | Final file |
|---|---|---|
| Filename | modeM0/AS1A12_061T03_9000005390_38640cztM0_level2.fits | modeM0/AS1A12_061T03_9000005390_38640cztM0_level2_quad_clean.evt |
| Size (bytes) | 457,067,520 | 99,311,040 |
| Size | 435.9 MB | 94.7 MB |
| Events in quadrant A | 4,426,624 | 667,787 |
| Events in quadrant B | 4,472,823 | 663,243 |
| Events in quadrant C | 3,070,964 | 669,225 |
| Events in quadrant D | 4,481,622 | 586,273 |
| Mode SS | |||
|---|---|---|---|
| Quadrant | BADHDUFLAG | Total packets | Discarded packets |
| A | 0 | 124 | 0 |
| B | 0 | 124 | 0 |
| C | 0 | 124 | 0 |
| D | 0 | 124 | 0 |
| Mode M9 | |||
|---|---|---|---|
| Quadrant | BADHDUFLAG | Total packets | Discarded packets |
| A | 0 | 21 | 0 |
| B | 0 | 21 | 0 |
| C | 0 | 21 | 0 |
| D | 0 | 22 | 0 |
| Mode M0 | |||
|---|---|---|---|
| Quadrant | BADHDUFLAG | Total packets | Discarded packets |
| A | 0 | 16805 | 3 |
| B | 0 | 17064 | 2 |
| C | 0 | 12747 | 2 |
| D | 0 | 17272 | 2 |
| Quadrant | Total seconds | Saturated seconds | Saturation percentage |
|---|---|---|---|
| A | 6014 | 124 | 2.061856% |
| B | 6014 | 450 | 7.482541% |
| C | 6014 | 8 | 0.133023% |
| D | 6014 | 399 | 6.634519% |
Noise dominated data is calculated using 1-second bins in cleaned event files. If a bin has >2000 counts, and if more than 50% of those come from <1% of pixels, then it is considered to be noise-dominated and hence unusable.
| Quadrant | # 1 sec bins | Bins with >0 counts | Bins with >2000 counts | High rate bins dominated by noise | Noise dominated (total time) | Noise dominated (detector-on time) | Marked lightcurve |
|---|---|---|---|---|---|---|---|
| A | 7416 | 6014 | 113 | 113 | 1.52% | 1.88% | 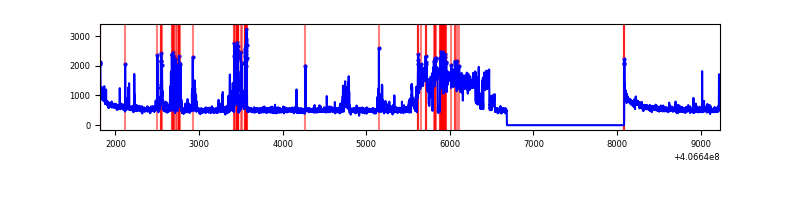 |
| B | 7416 | 6014 | 341 | 341 | 4.60% | 5.67% | 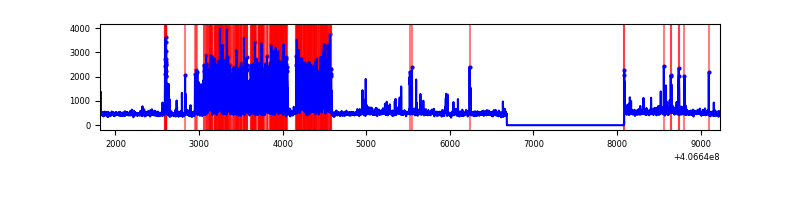 |
| C | 7416 | 6014 | 2 | 2 | 0.03% | 0.03% | 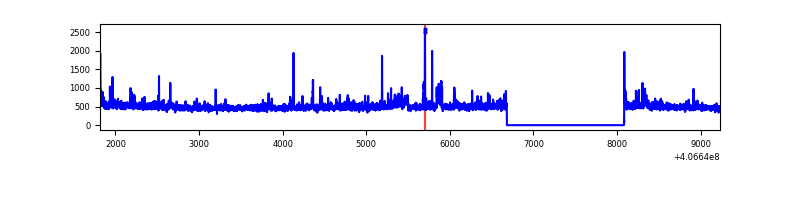 |
| D | 7416 | 6014 | 375 | 375 | 5.06% | 6.24% | 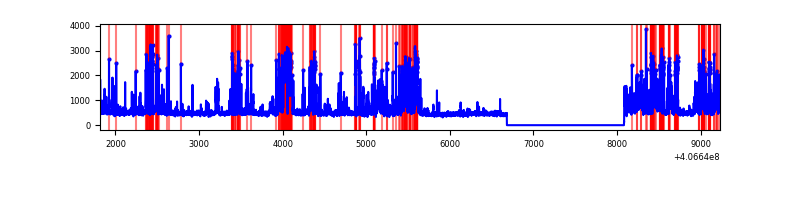 |
Top three noisy pixels from each quadrant. If the there are fewer than three noisy pixels in the level2.evt file, extra rows are filled as -1
| Pixel properties | Quadrant properties | ||||||
|---|---|---|---|---|---|---|---|
| Quadrant | DetID | PixID | Counts | Sigma | Mean | Median | Sigma |
| A | 0 | 247 | 803163 | 5750.81 | 681 | 664 | 139.5 |
| A | 10 | 83 | 466347 | 3337.15 | 681 | 664 | 139.5 |
| A | 13 | 248 | 375146 | 2683.59 | 681 | 664 | 139.5 |
| B | 4 | 251 | 1560030 | 12173.32 | 665 | 647 | 128.1 |
| B | 4 | 171 | 93235 | 722.79 | 665 | 647 | 128.1 |
| B | 5 | 184 | 72846 | 563.62 | 665 | 647 | 128.1 |
| C | 15 | 214 | 243101 | 1542.14 | 669 | 673 | 157.2 |
| C | 3 | 110 | 129352 | 818.55 | 669 | 673 | 157.2 |
| C | 14 | 254 | 54534 | 342.62 | 669 | 673 | 157.2 |
| D | 12 | 233 | 692133 | 4322.35 | 652 | 634 | 160.0 |
| D | 2 | 249 | 311688 | 1944.3 | 652 | 634 | 160.0 |
| D | 13 | 249 | 278985 | 1739.89 | 652 | 634 | 160.0 |
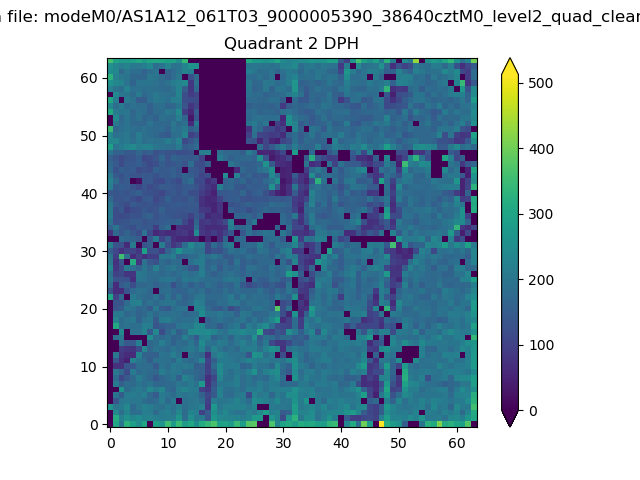
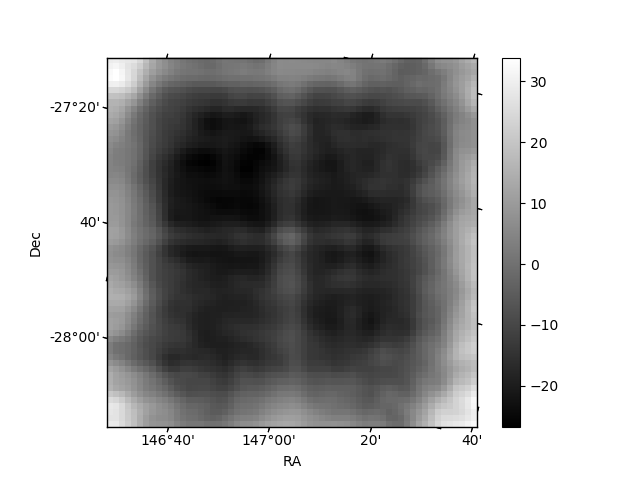
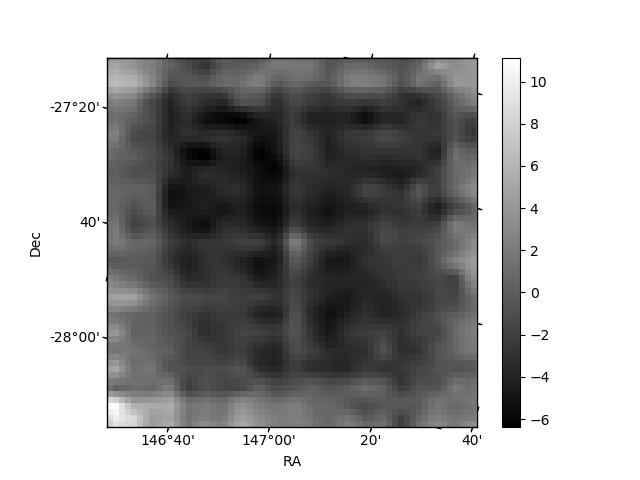
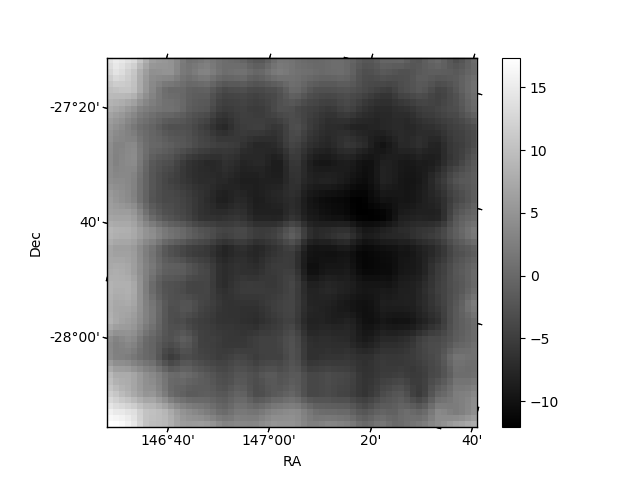
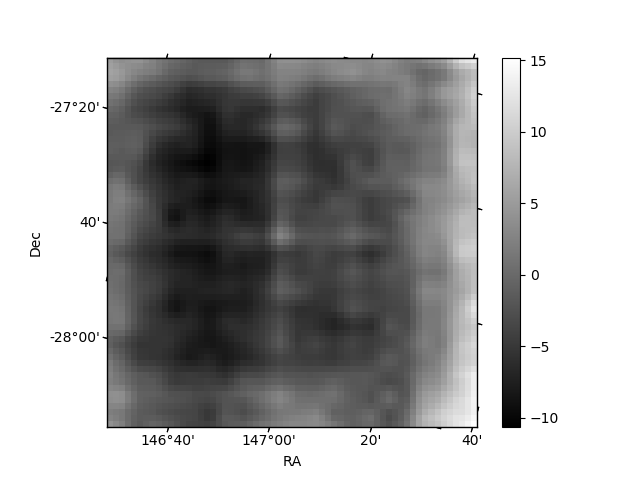
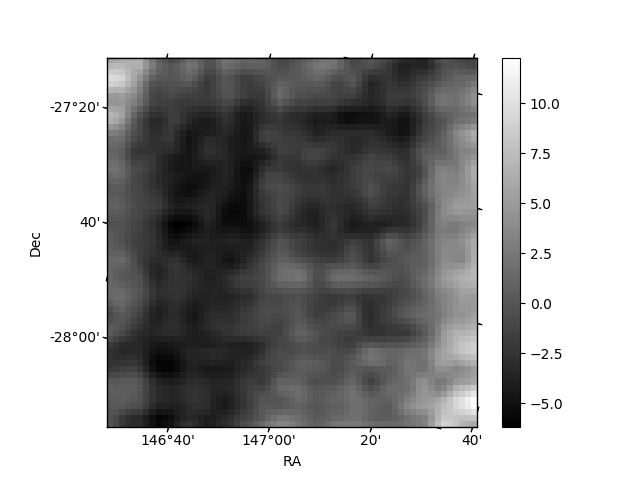
Histogram calculated using DETX and DETY for each event in the final _common_clean file
| Quadrant A | 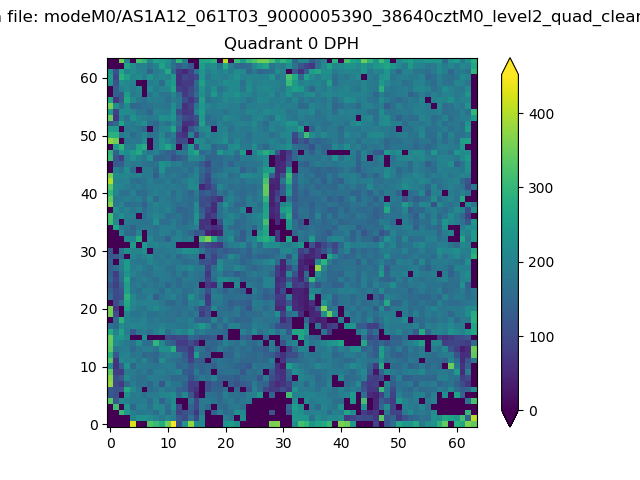 |
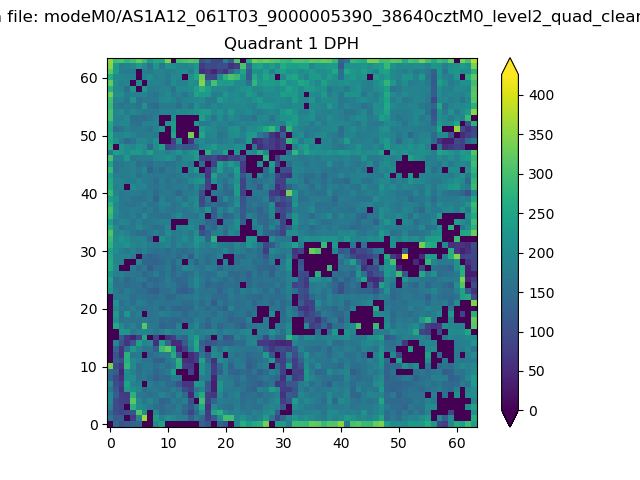 |
Quadrant B |
|---|---|---|---|
| Quadrant D | 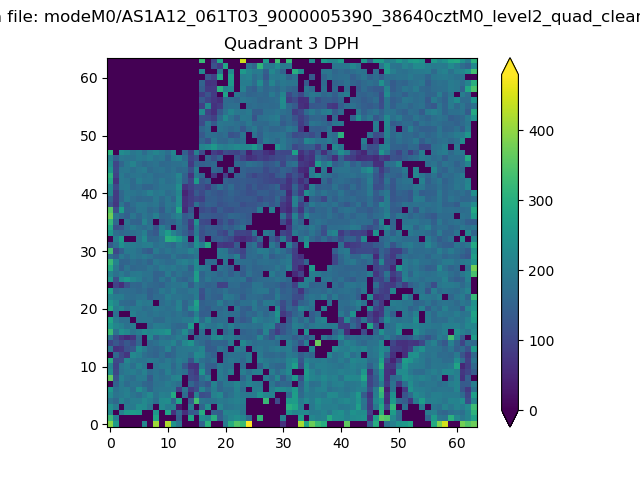 |
 |
Quadrant C |
| Plot type | Count rate plots | Images |
|---|---|---|
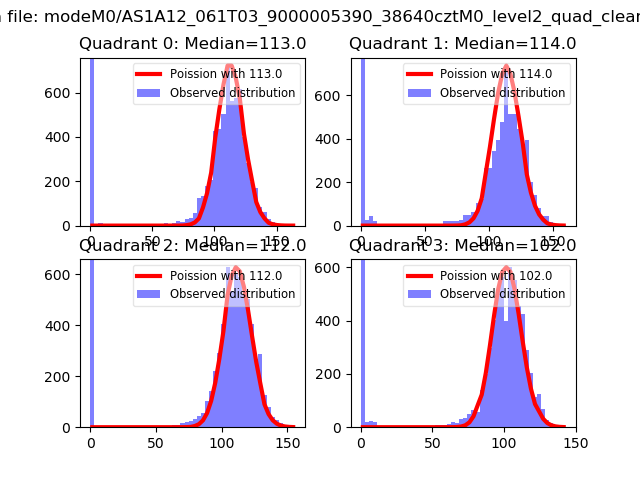
| Comparison with Poisson distribution Blue bars denote a histogram of data divided into 1 sec bins. Red curve is a Poisson curve with rate = median count rate of data. |
 |
 |
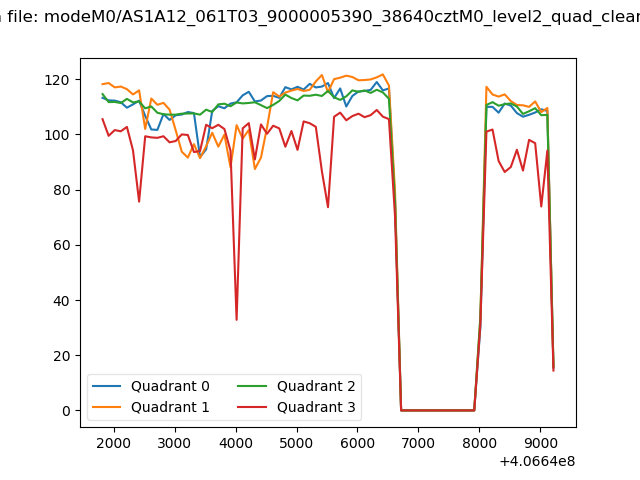
| Quadrant-wise count rates Data is divided into 100 sec bins |
 |
|
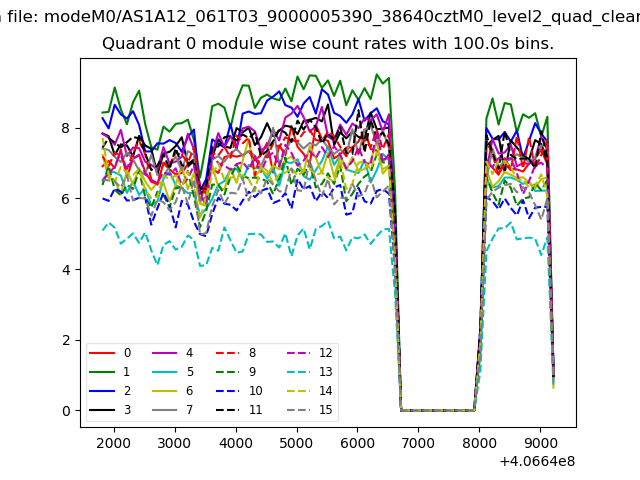
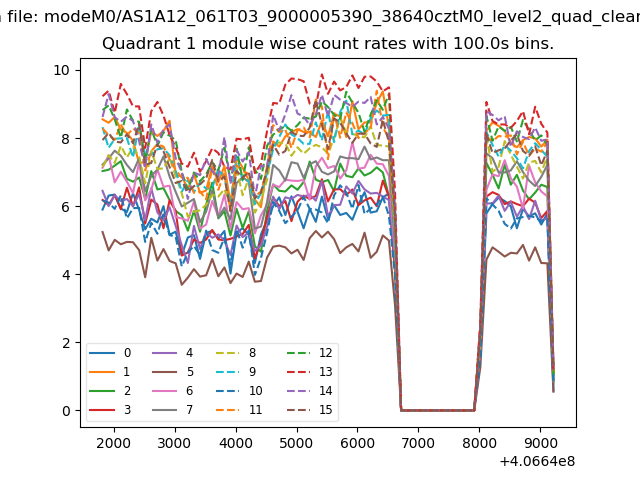
| Module-wise count rates for Quadrant A Data is divided into 100 sec bins |
 |
 |
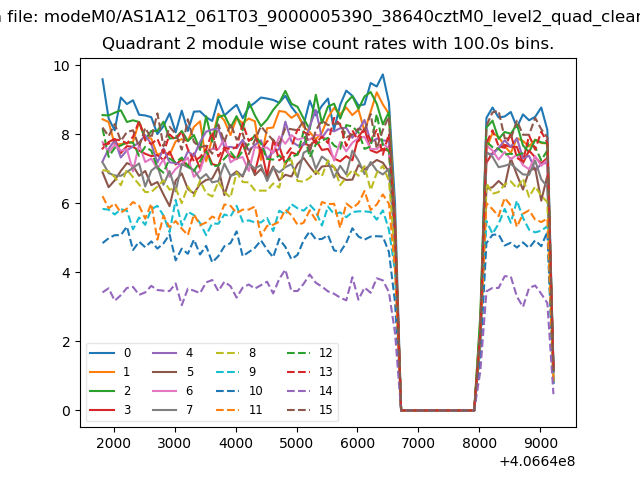
| Module-wise count rates for Quadrant B Data is divided into 100 sec bins |
 |
 |
| Module-wise count rates for Quadrant C Data is divided into 100 sec bins |
 |
 |
| Module-wise count rates for Quadrant D Data is divided into 100 sec bins |
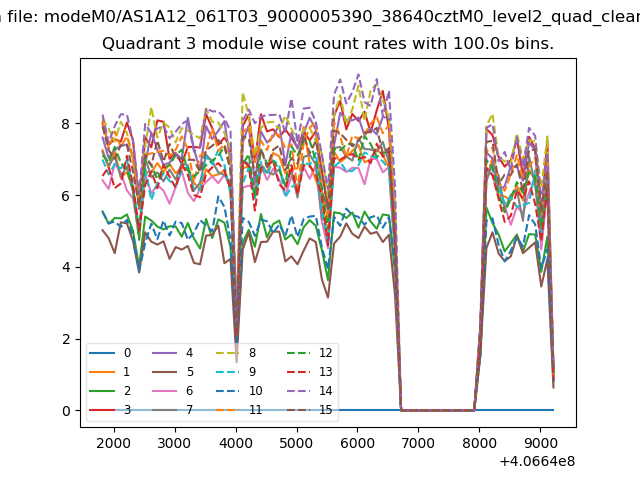 |
 |
| Parameter | Plot |
|---|---|
| CZT HV Monitor | 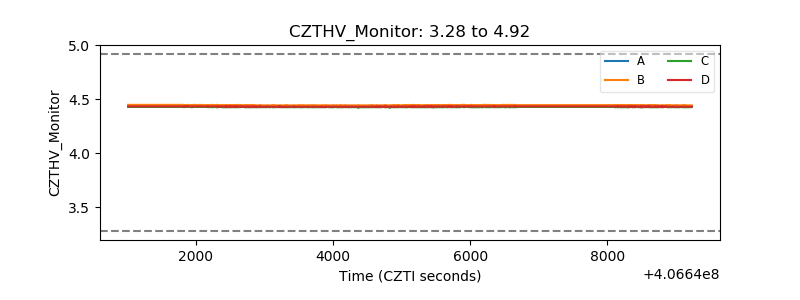 |
| D_VDD | 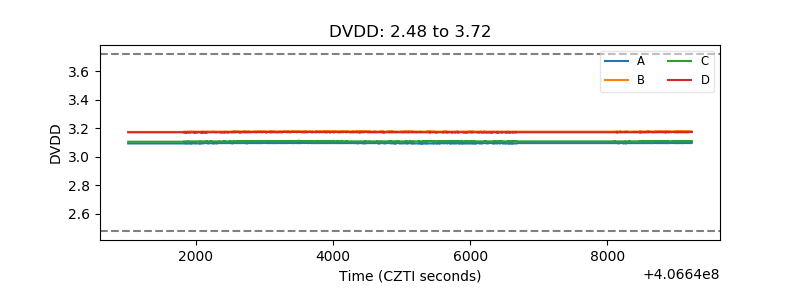 |
| Temperature 1 | 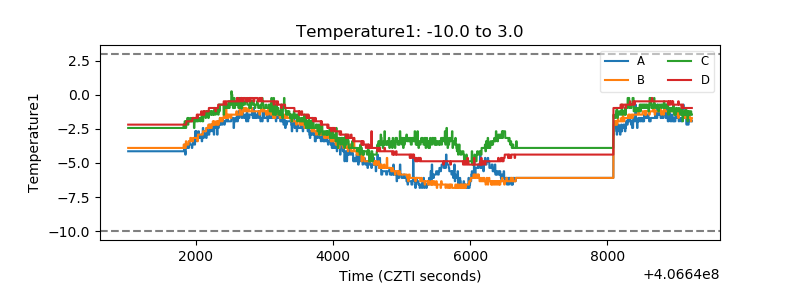 |
| Veto HV Monitor | 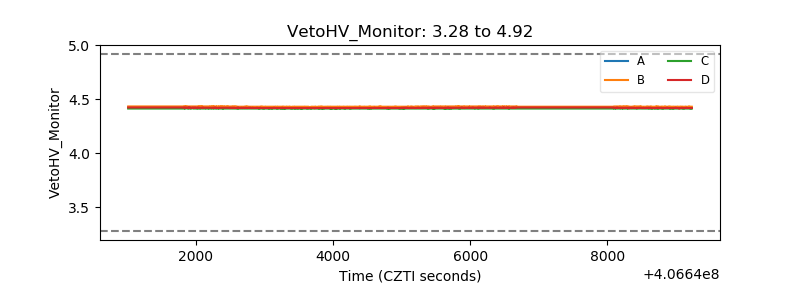 |
| Veto LLD | 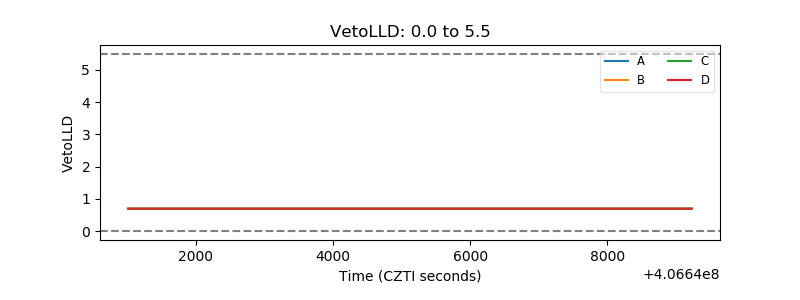 |
| Alpha Counter | 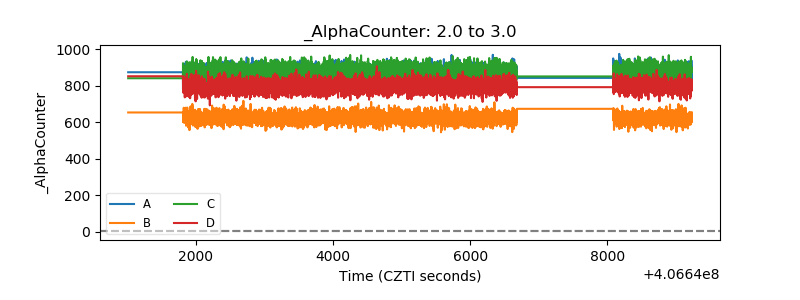 |
| _CPM_Rate | 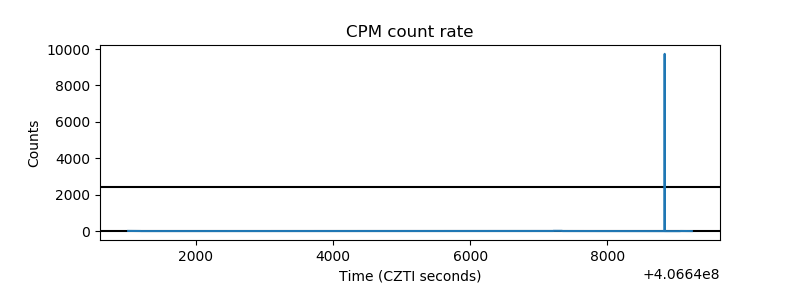 |
| CZT Counter | 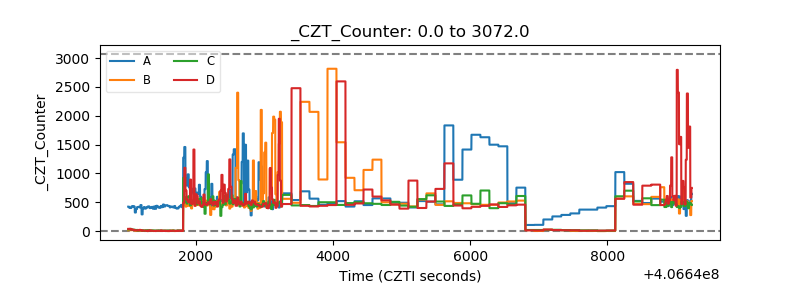 |
| +2.5 Volts monitor | 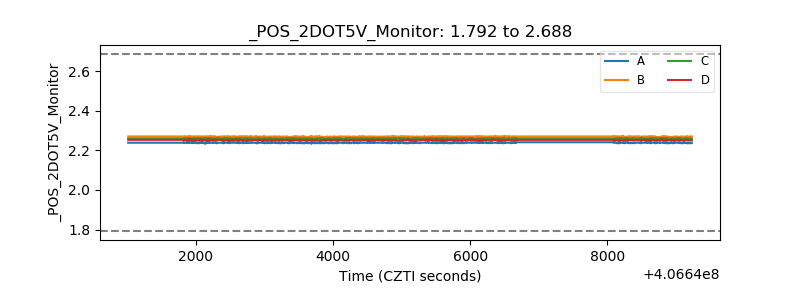 |
| +5 Volts monitor | 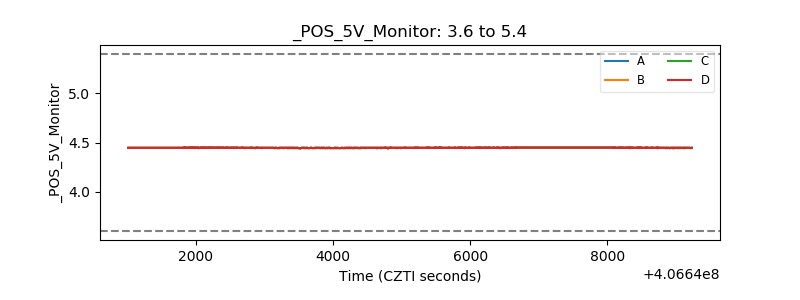 |
| _ROLL_ROT | 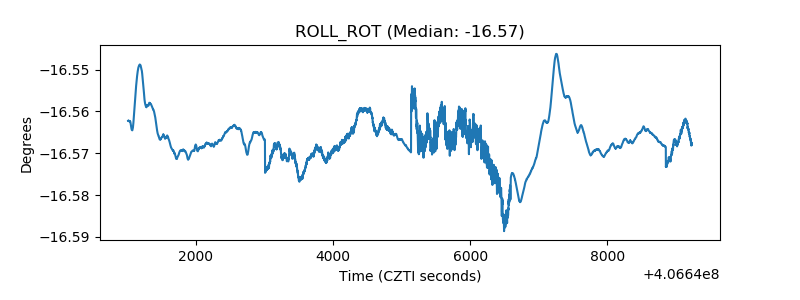 |
| _Roll_DEC | 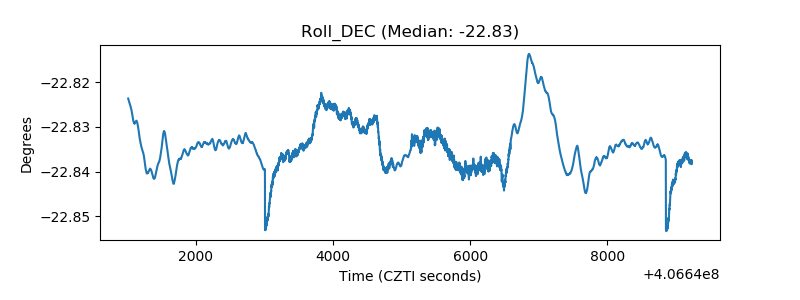 |
| _Roll_RA | 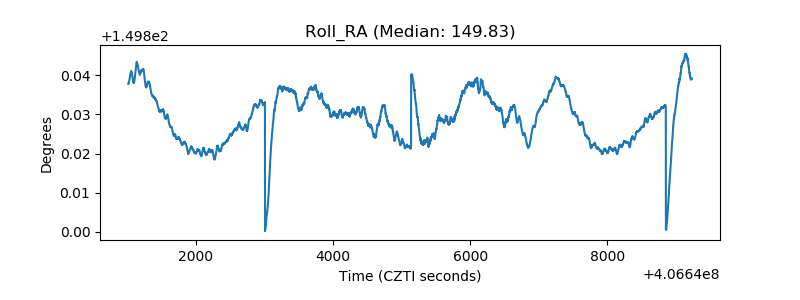 |
| Veto Counter | 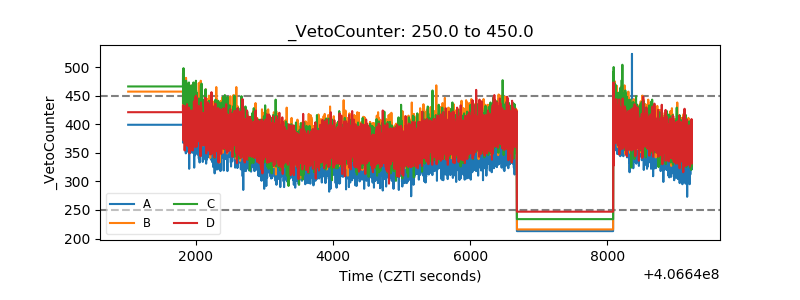 |