| Param | Original file | Final file |
|---|---|---|
| Filename | modeM0/AS1A12_061T03_9000005390_38641cztM0_level2.fits | modeM0/AS1A12_061T03_9000005390_38641cztM0_level2_quad_clean.evt |
| Size (bytes) | 414,167,040 | 99,120,960 |
| Size | 395.0 MB | 94.5 MB |
| Events in quadrant A | 3,420,831 | 665,797 |
| Events in quadrant B | 3,265,022 | 678,793 |
| Events in quadrant C | 2,940,591 | 657,335 |
| Events in quadrant D | 5,241,173 | 582,580 |
| Mode SS | |||
|---|---|---|---|
| Quadrant | BADHDUFLAG | Total packets | Discarded packets |
| A | 0 | 122 | 0 |
| B | 0 | 122 | 0 |
| C | 0 | 122 | 0 |
| D | 0 | 122 | 0 |
| Mode M9 | |||
|---|---|---|---|
| Quadrant | BADHDUFLAG | Total packets | Discarded packets |
| A | 0 | 15 | 0 |
| B | 0 | 15 | 0 |
| C | 0 | 15 | 0 |
| D | 0 | 16 | 0 |
| Mode M0 | |||
|---|---|---|---|
| Quadrant | BADHDUFLAG | Total packets | Discarded packets |
| A | 0 | 13692 | 3 |
| B | 0 | 13217 | 2 |
| C | 0 | 12286 | 2 |
| D | 0 | 19610 | 2 |
| Quadrant | Total seconds | Saturated seconds | Saturation percentage |
|---|---|---|---|
| A | 5964 | 51 | 0.855131% |
| B | 5964 | 33 | 0.553320% |
| C | 5964 | 9 | 0.150905% |
| D | 5964 | 421 | 7.059021% |
Noise dominated data is calculated using 1-second bins in cleaned event files. If a bin has >2000 counts, and if more than 50% of those come from <1% of pixels, then it is considered to be noise-dominated and hence unusable.
| Quadrant | # 1 sec bins | Bins with >0 counts | Bins with >2000 counts | High rate bins dominated by noise | Noise dominated (total time) | Noise dominated (detector-on time) | Marked lightcurve |
|---|---|---|---|---|---|---|---|
| A | 7277 | 5965 | 31 | 31 | 0.43% | 0.52% | 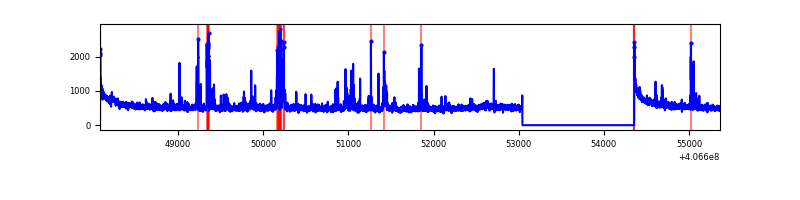 |
| B | 7277 | 5965 | 15 | 15 | 0.21% | 0.25% | 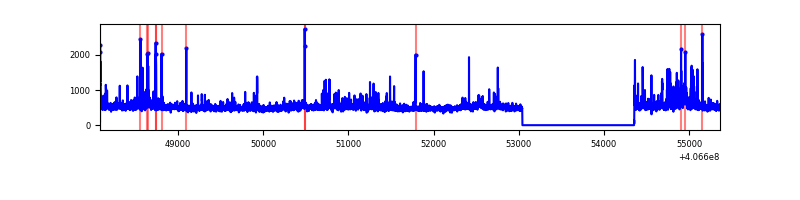 |
| C | 7277 | 5965 | 3 | 3 | 0.04% | 0.05% | 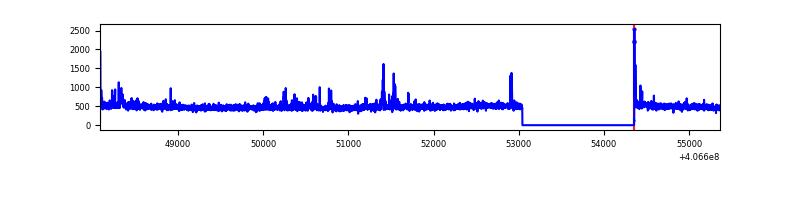 |
| D | 7277 | 5965 | 415 | 415 | 5.70% | 6.96% | 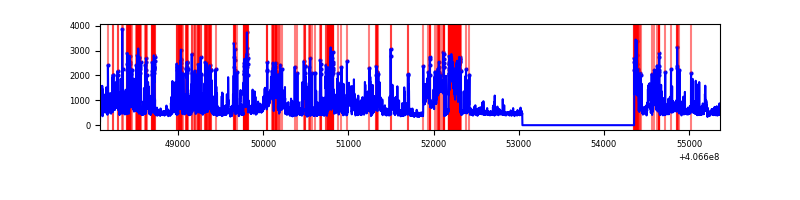 |
Top three noisy pixels from each quadrant. If the there are fewer than three noisy pixels in the level2.evt file, extra rows are filled as -1
| Pixel properties | Quadrant properties | ||||||
|---|---|---|---|---|---|---|---|
| Quadrant | DetID | PixID | Counts | Sigma | Mean | Median | Sigma |
| A | 10 | 83 | 472384 | 3424.88 | 674 | 660 | 137.7 |
| A | 13 | 248 | 254871 | 1845.66 | 674 | 660 | 137.7 |
| A | 9 | 143 | 28612 | 202.94 | 674 | 660 | 137.7 |
| B | 4 | 251 | 262689 | 2026.54 | 674 | 655 | 129.3 |
| B | 4 | 171 | 172822 | 1331.52 | 674 | 655 | 129.3 |
| B | 5 | 184 | 67591 | 517.67 | 674 | 655 | 129.3 |
| C | 15 | 214 | 241474 | 1556.84 | 662 | 667 | 154.7 |
| C | 3 | 110 | 65056 | 416.28 | 662 | 667 | 154.7 |
| C | 0 | 10 | 18590 | 115.87 | 662 | 667 | 154.7 |
| D | 2 | 249 | 605315 | 3826.72 | 644 | 626 | 158.0 |
| D | 1 | 47 | 455731 | 2880.09 | 644 | 626 | 158.0 |
| D | 13 | 174 | 421607 | 2664.14 | 644 | 626 | 158.0 |
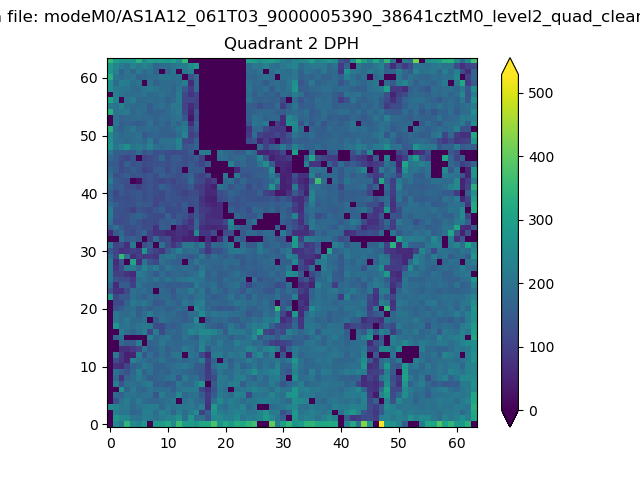
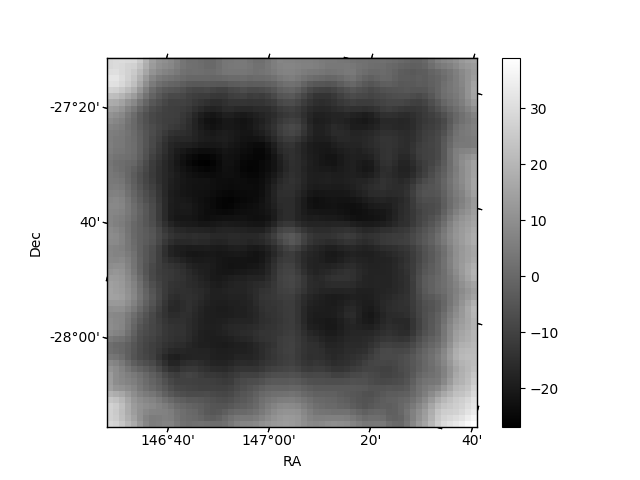
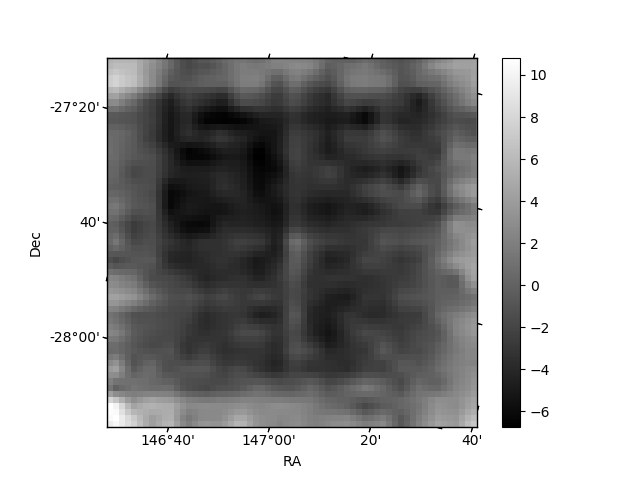
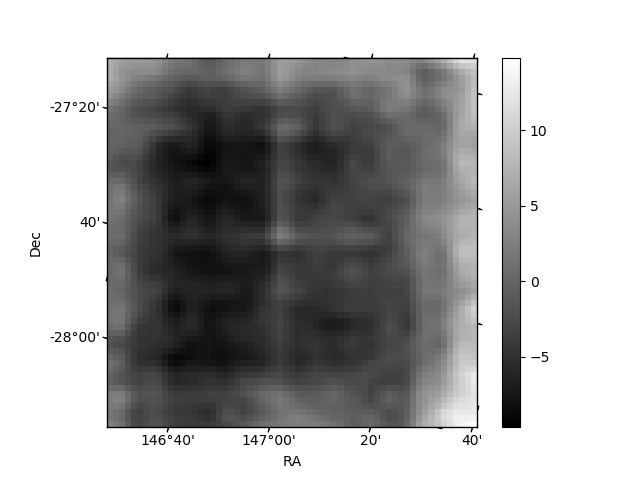
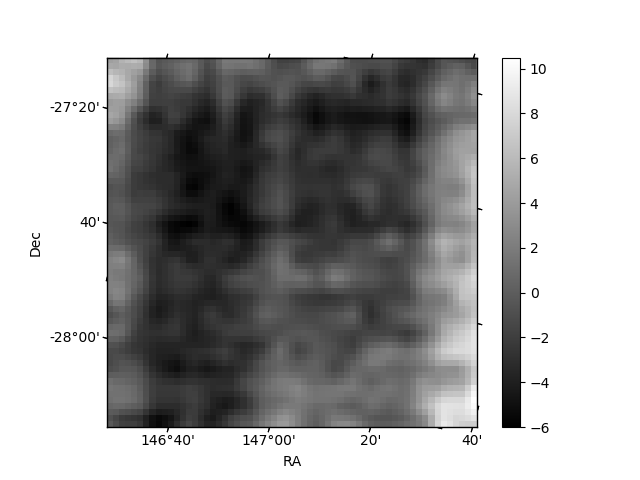
Histogram calculated using DETX and DETY for each event in the final _common_clean file
| Quadrant A | 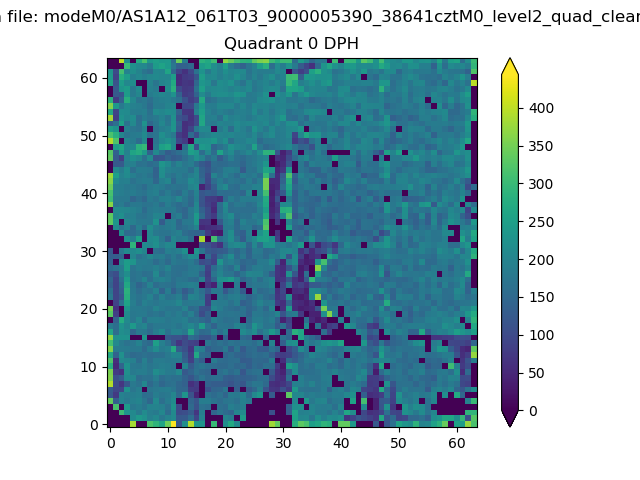 |
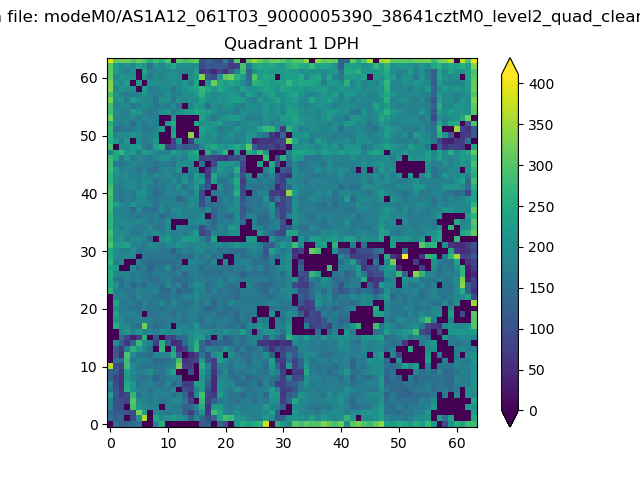 |
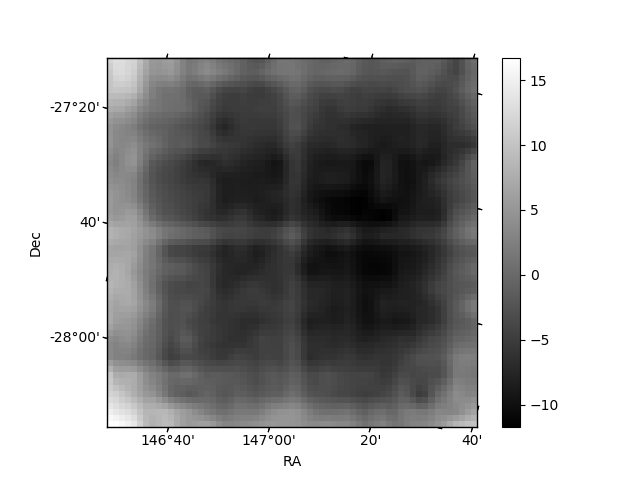
Quadrant B |
|---|---|---|---|
| Quadrant D | 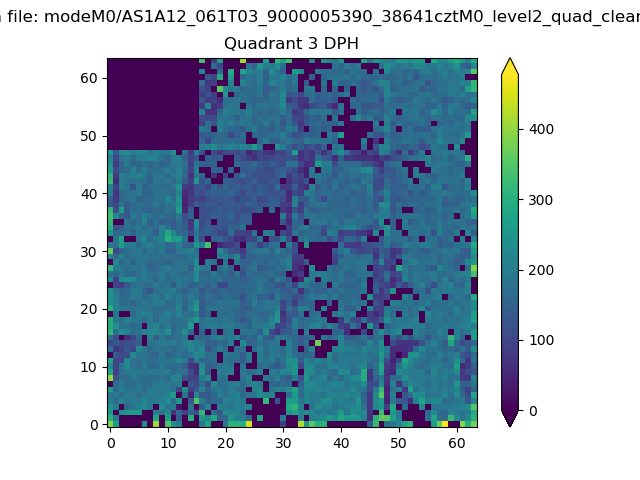 |
 |
Quadrant C |
| Plot type | Count rate plots | Images |
|---|---|---|
| Comparison with Poisson distribution Blue bars denote a histogram of data divided into 1 sec bins. Red curve is a Poisson curve with rate = median count rate of data. |
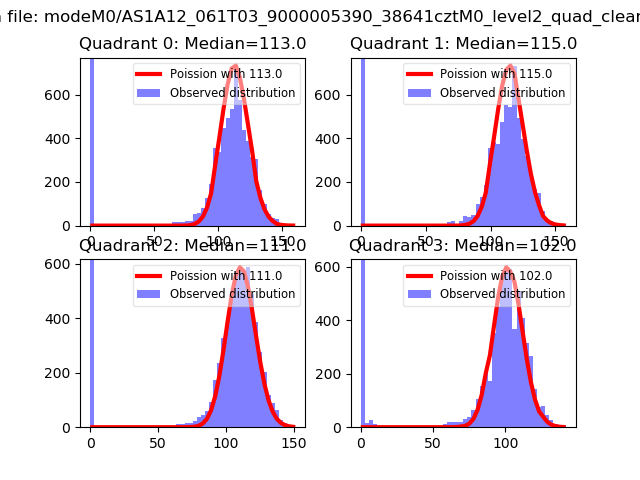 |
 |
| Quadrant-wise count rates Data is divided into 100 sec bins |
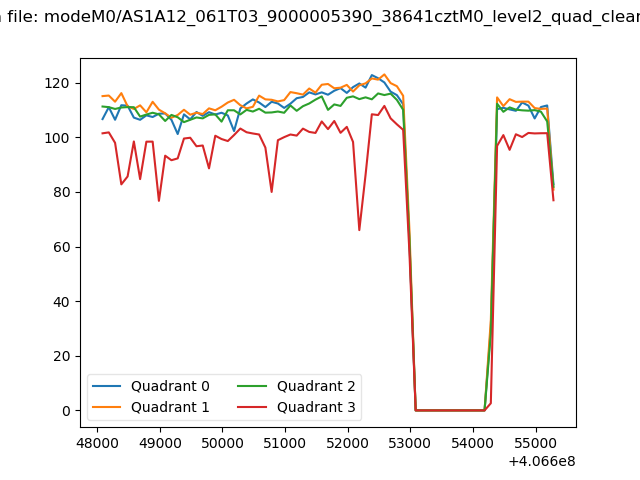 |
|
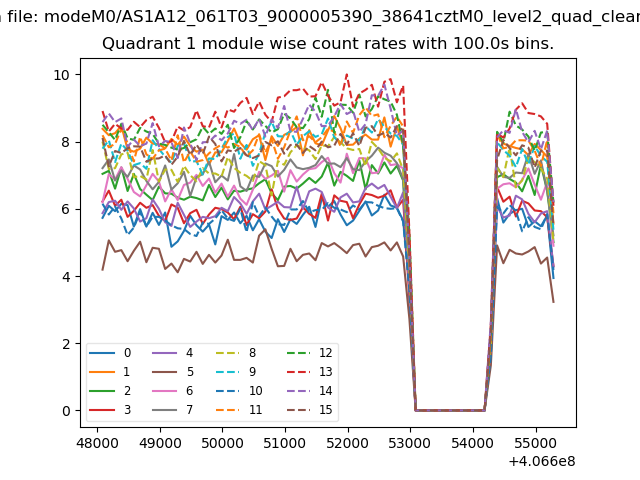
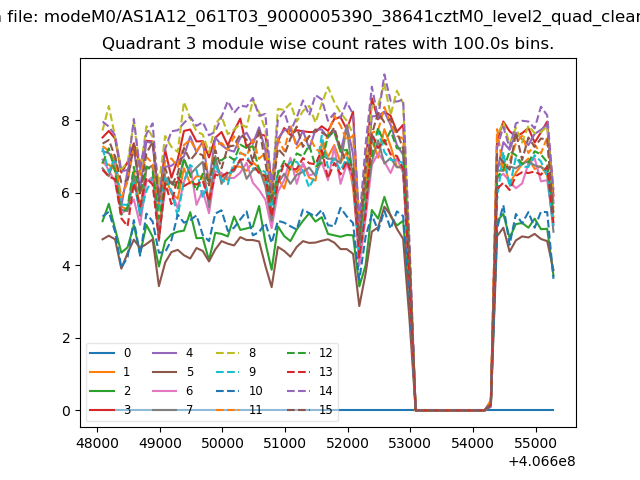
| Module-wise count rates for Quadrant A Data is divided into 100 sec bins |
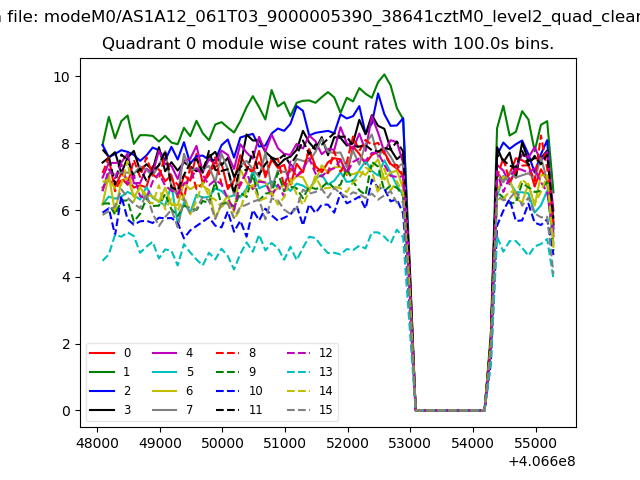 |
 |
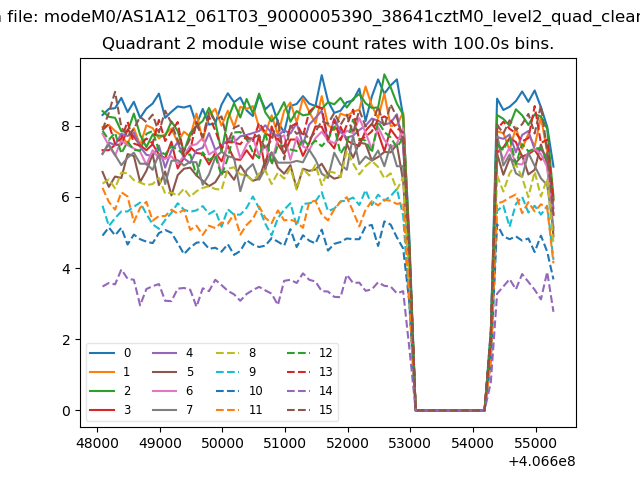
| Module-wise count rates for Quadrant B Data is divided into 100 sec bins |
 |
 |
| Module-wise count rates for Quadrant C Data is divided into 100 sec bins |
 |
 |
| Module-wise count rates for Quadrant D Data is divided into 100 sec bins |
 |
 |
| Parameter | Plot |
|---|---|
| CZT HV Monitor | 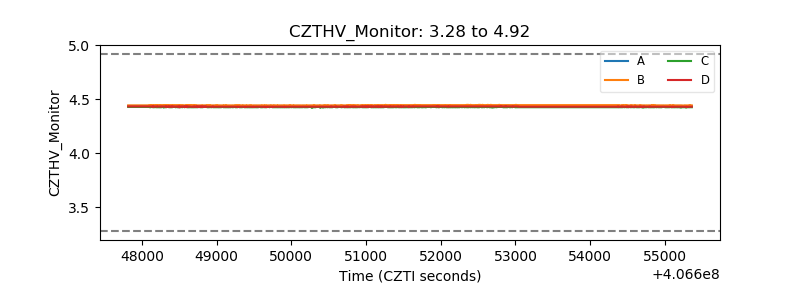 |
| D_VDD | 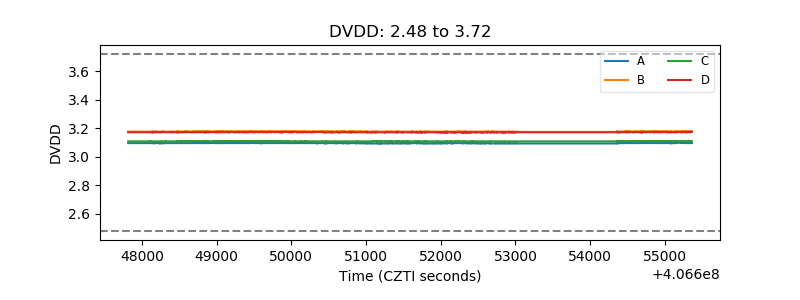 |
| Temperature 1 | 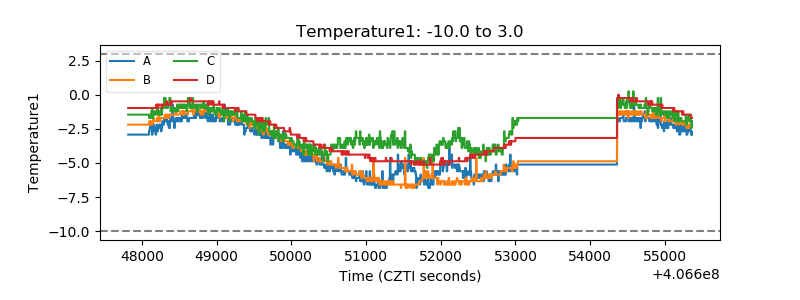 |
| Veto HV Monitor | 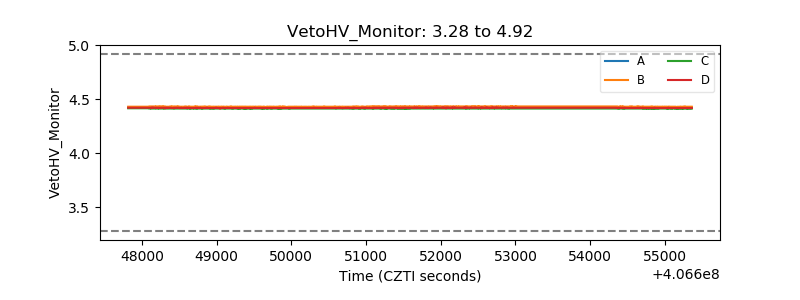 |
| Veto LLD | 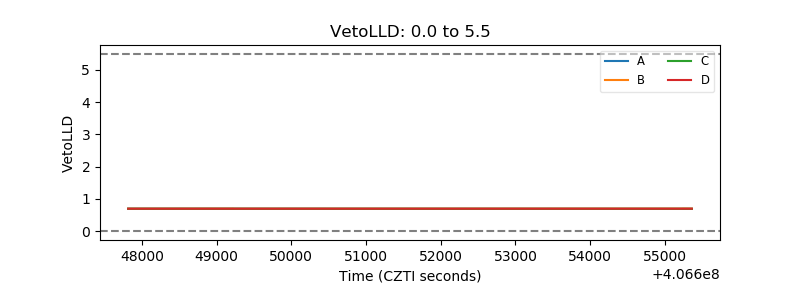 |
| Alpha Counter | 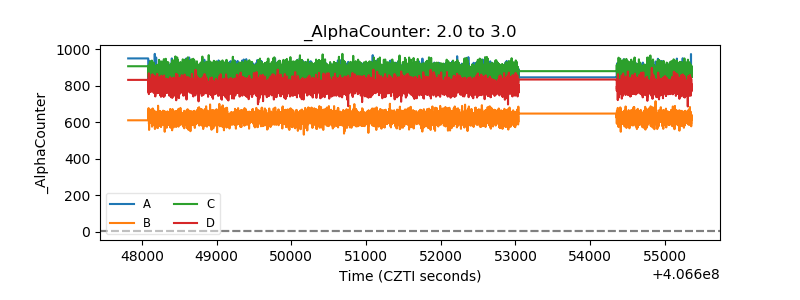 |
| _CPM_Rate | 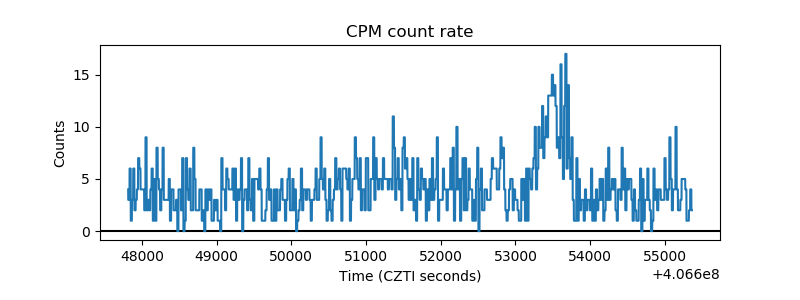 |
| CZT Counter | 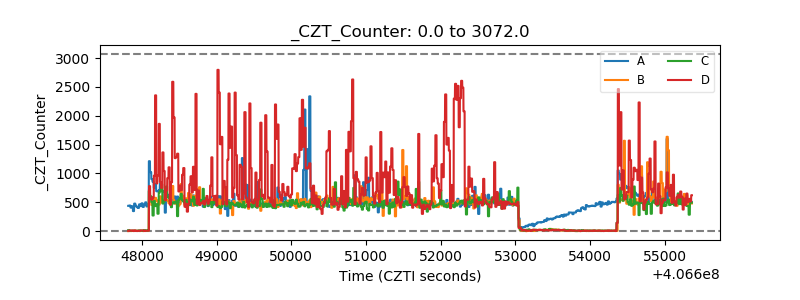 |
| +2.5 Volts monitor | 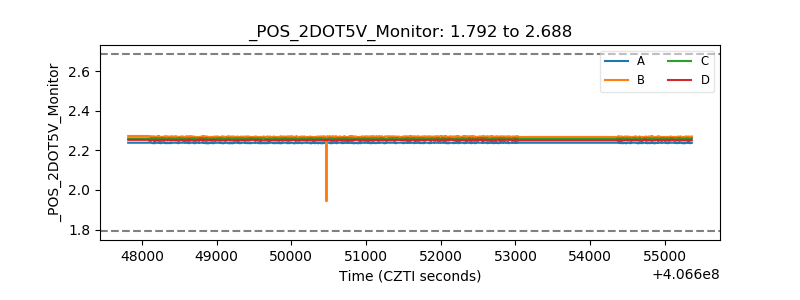 |
| +5 Volts monitor | 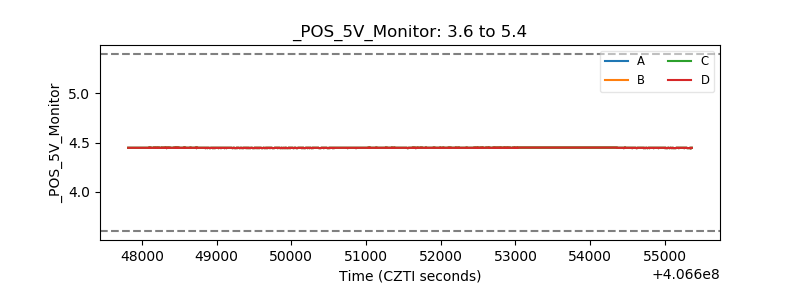 |
| _ROLL_ROT |  |
| _Roll_DEC | 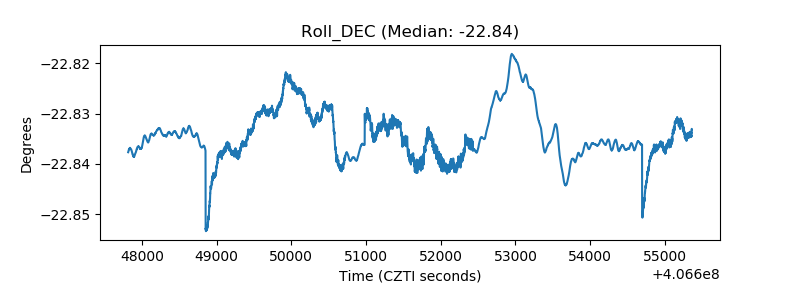 |
| _Roll_RA | 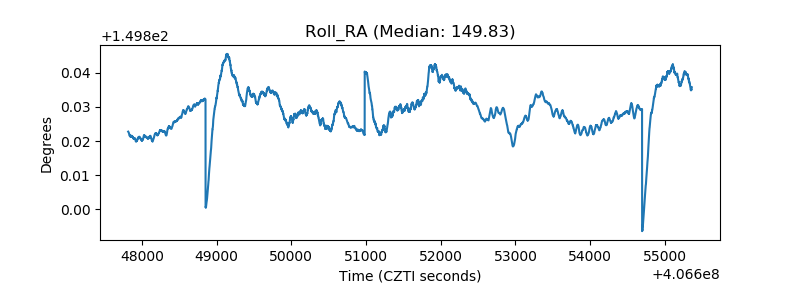 |
| Veto Counter | 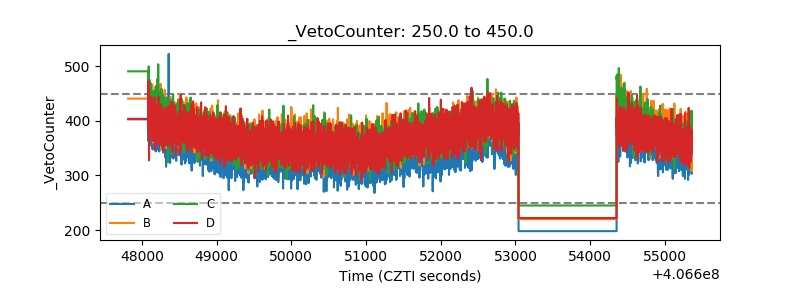 |