| Param | Original file | Final file |
|---|---|---|
| Filename | modeM0/AS1A12_061T03_9000005390_38644cztM0_level2.fits | modeM0/AS1A12_061T03_9000005390_38644cztM0_level2_quad_clean.evt |
| Size (bytes) | 1,012,870,080 | 254,177,280 |
| Size | 965.9 MB | 242.4 MB |
| Events in quadrant A | 9,005,632 | 1,683,758 |
| Events in quadrant B | 8,279,220 | 1,742,618 |
| Events in quadrant C | 7,534,763 | 1,692,221 |
| Events in quadrant D | 11,476,045 | 1,509,815 |
| Mode SS | |||
|---|---|---|---|
| Quadrant | BADHDUFLAG | Total packets | Discarded packets |
| A | 0 | 314 | 0 |
| B | 0 | 314 | 0 |
| C | 0 | 314 | 0 |
| D | 0 | 314 | 0 |
| Mode M9 | |||
|---|---|---|---|
| Quadrant | BADHDUFLAG | Total packets | Discarded packets |
| A | 0 | 50 | 0 |
| B | 0 | 50 | 0 |
| C | 0 | 50 | 0 |
| D | 0 | 51 | 0 |
| Mode M0 | |||
|---|---|---|---|
| Quadrant | BADHDUFLAG | Total packets | Discarded packets |
| A | 0 | 36258 | 5 |
| B | 0 | 34213 | 4 |
| C | 0 | 31806 | 4 |
| D | 0 | 44686 | 4 |
| Quadrant | Total seconds | Saturated seconds | Saturation percentage |
|---|---|---|---|
| A | 15471 | 308 | 1.990822% |
| B | 15471 | 94 | 0.607588% |
| C | 15471 | 26 | 0.168056% |
| D | 15471 | 782 | 5.054618% |
Noise dominated data is calculated using 1-second bins in cleaned event files. If a bin has >2000 counts, and if more than 50% of those come from <1% of pixels, then it is considered to be noise-dominated and hence unusable.
| Quadrant | # 1 sec bins | Bins with >0 counts | Bins with >2000 counts | High rate bins dominated by noise | Noise dominated (total time) | Noise dominated (detector-on time) | Marked lightcurve |
|---|---|---|---|---|---|---|---|
| A | 19710 | 15474 | 230 | 230 | 1.17% | 1.49% | 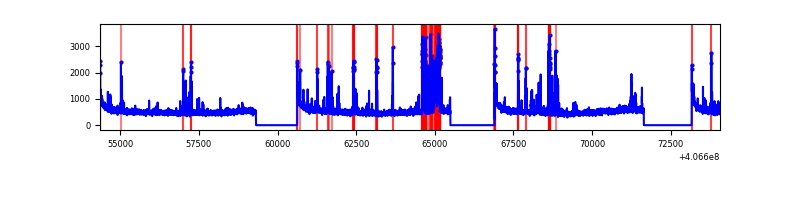 |
| B | 19710 | 15474 | 41 | 41 | 0.21% | 0.26% | 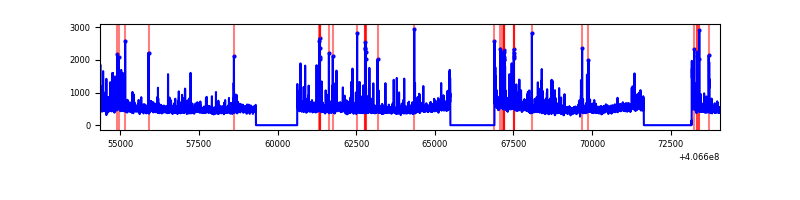 |
| C | 19710 | 15474 | 15 | 15 | 0.08% | 0.10% | 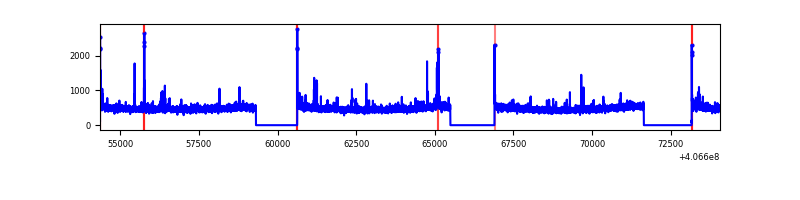 |
| D | 19710 | 15474 | 748 | 748 | 3.80% | 4.83% | 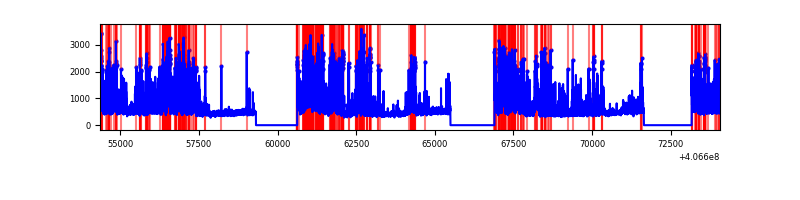 |
Top three noisy pixels from each quadrant. If the there are fewer than three noisy pixels in the level2.evt file, extra rows are filled as -1
| Pixel properties | Quadrant properties | ||||||
|---|---|---|---|---|---|---|---|
| Quadrant | DetID | PixID | Counts | Sigma | Mean | Median | Sigma |
| A | 10 | 83 | 1087761 | 3098.63 | 1728 | 1693 | 350.5 |
| A | 9 | 143 | 867700 | 2470.78 | 1728 | 1693 | 350.5 |
| A | 15 | 174 | 87631 | 245.19 | 1728 | 1693 | 350.5 |
| B | 4 | 251 | 637627 | 1916.09 | 1741 | 1694 | 331.9 |
| B | 4 | 171 | 469242 | 1408.74 | 1741 | 1694 | 331.9 |
| B | 5 | 172 | 85463 | 252.4 | 1741 | 1694 | 331.9 |
| C | 15 | 214 | 614403 | 1535.74 | 1715 | 1728 | 398.9 |
| C | 3 | 110 | 105144 | 259.22 | 1715 | 1728 | 398.9 |
| C | 0 | 10 | 44204 | 106.47 | 1715 | 1728 | 398.9 |
| D | 2 | 249 | 1712525 | 4202.43 | 1675 | 1627 | 407.1 |
| D | 2 | 153 | 921672 | 2259.88 | 1675 | 1627 | 407.1 |
| D | 2 | 250 | 599065 | 1467.47 | 1675 | 1627 | 407.1 |
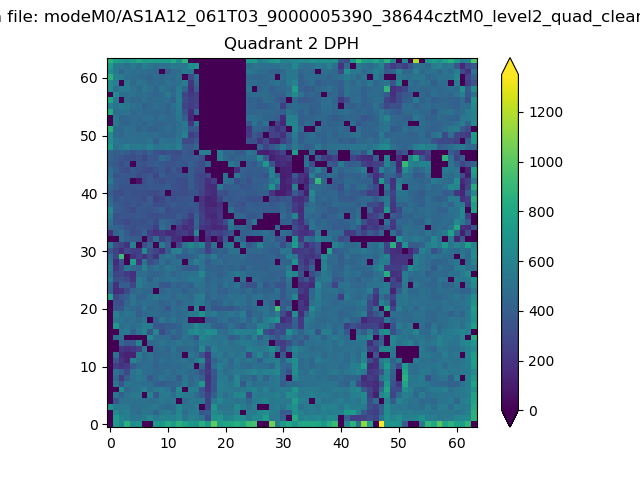
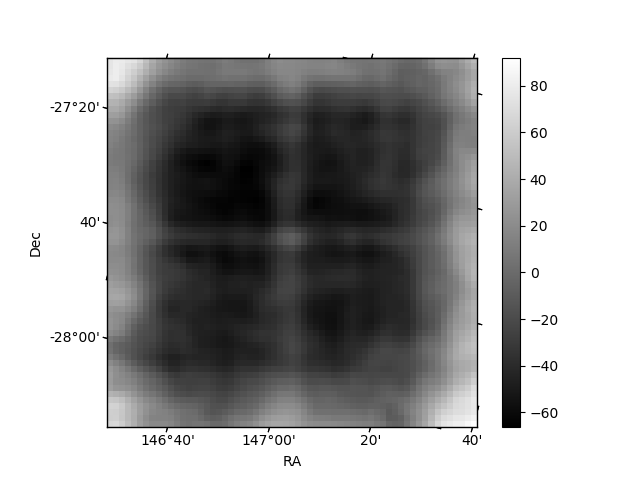
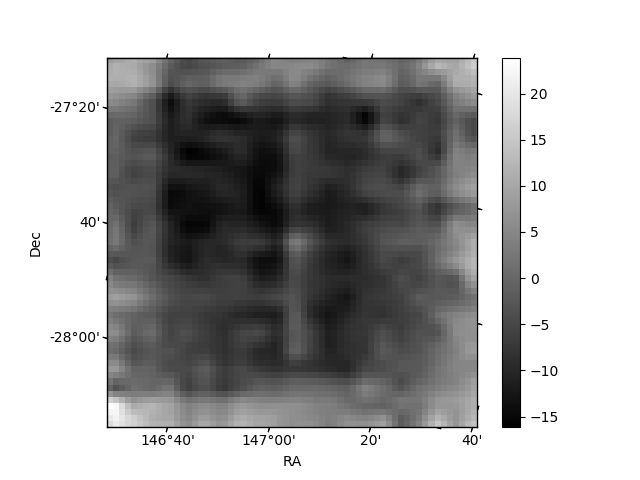
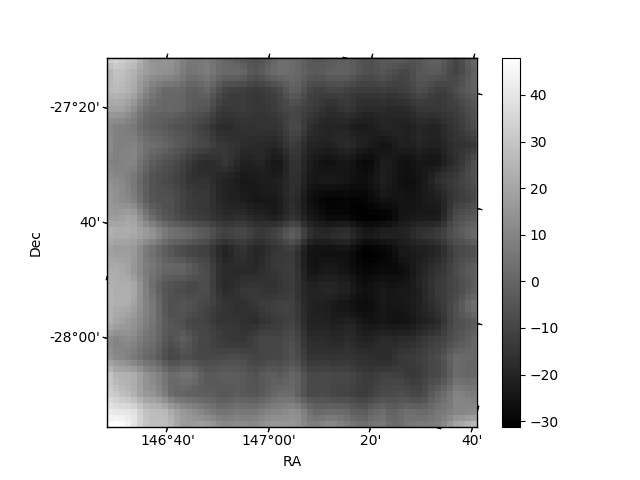
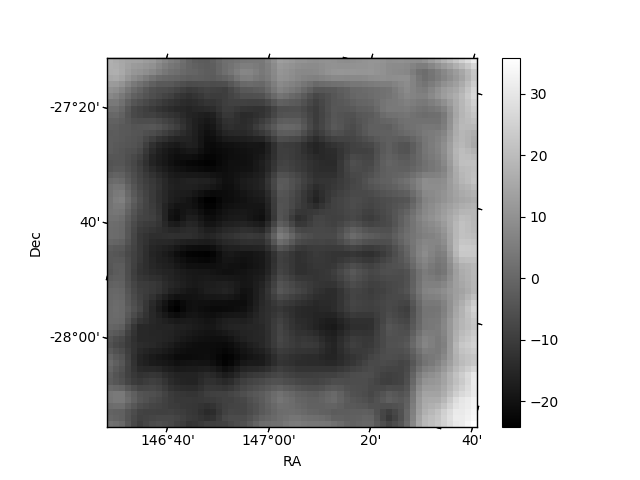
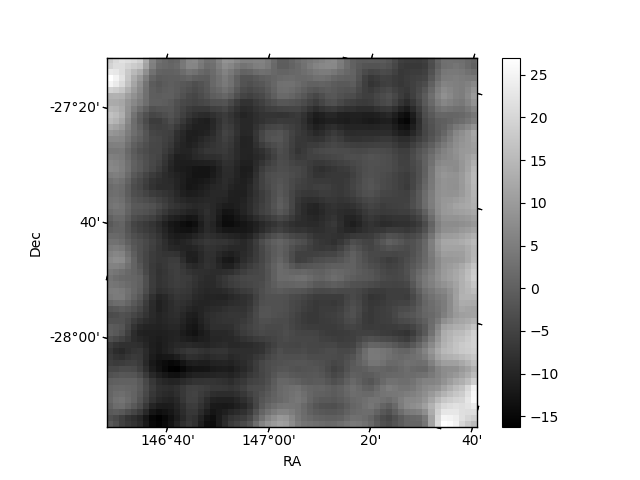
Histogram calculated using DETX and DETY for each event in the final _common_clean file
| Quadrant A | 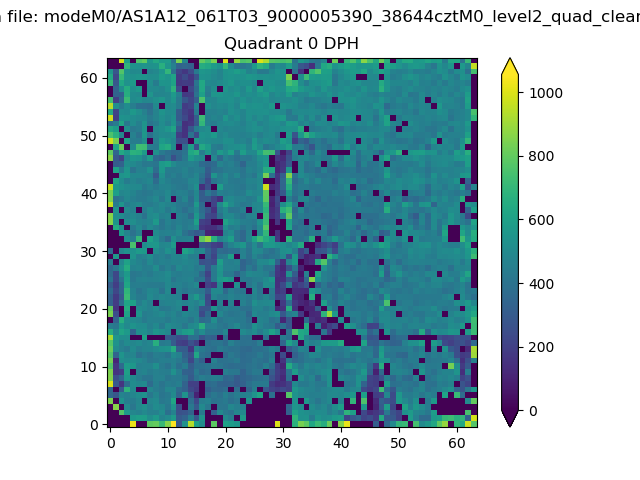 |
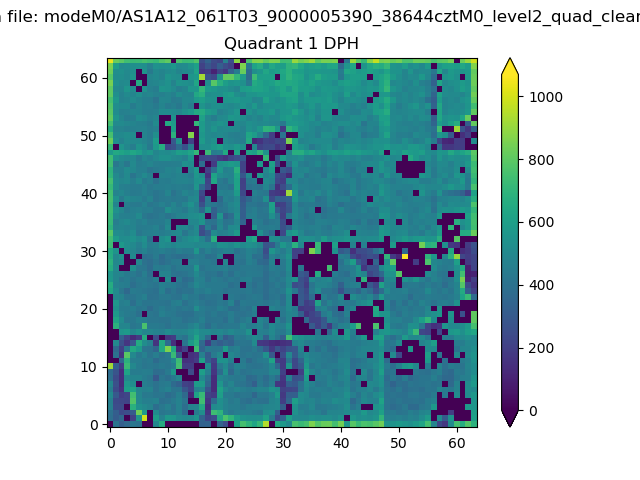 |
Quadrant B |
|---|---|---|---|
| Quadrant D | 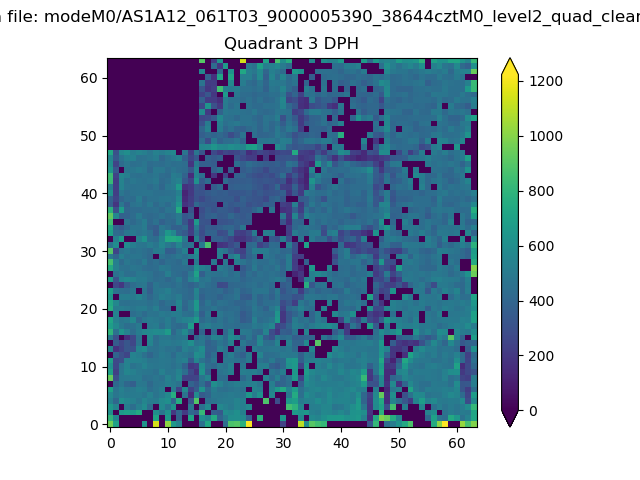 |
 |
Quadrant C |
| Plot type | Count rate plots | Images |
|---|---|---|
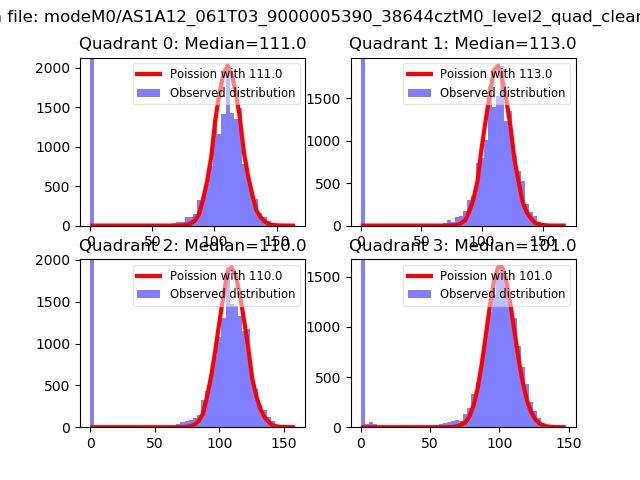
| Comparison with Poisson distribution Blue bars denote a histogram of data divided into 1 sec bins. Red curve is a Poisson curve with rate = median count rate of data. |
 |
 |
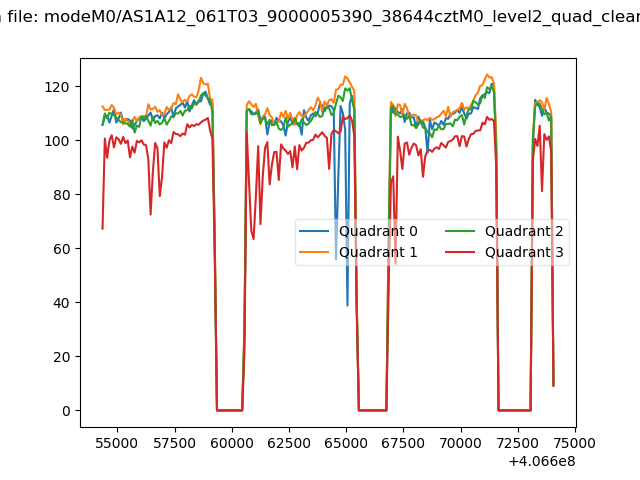
| Quadrant-wise count rates Data is divided into 100 sec bins |
 |
|
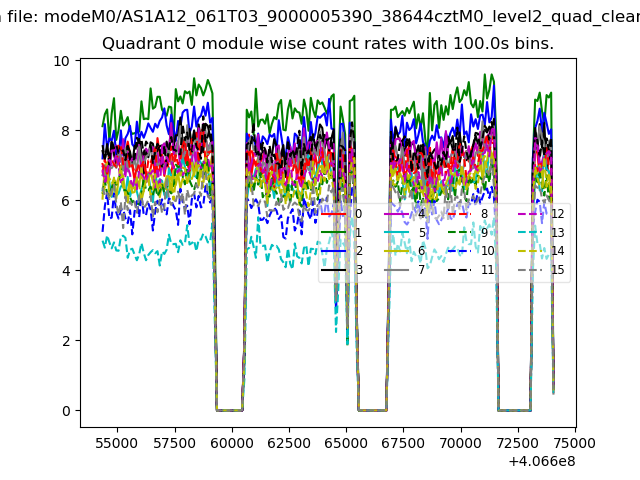
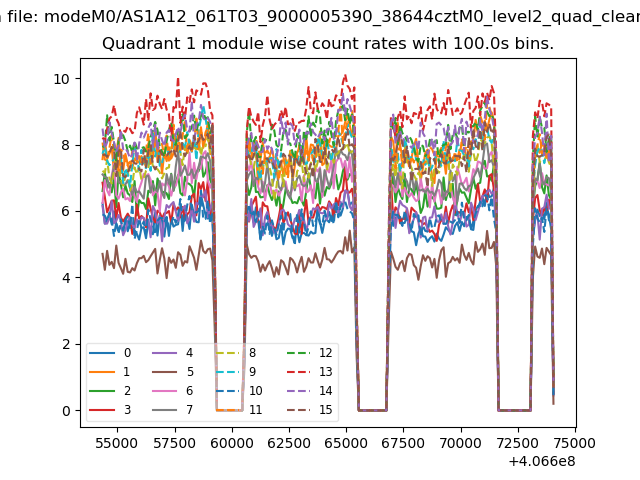
| Module-wise count rates for Quadrant A Data is divided into 100 sec bins |
 |
 |
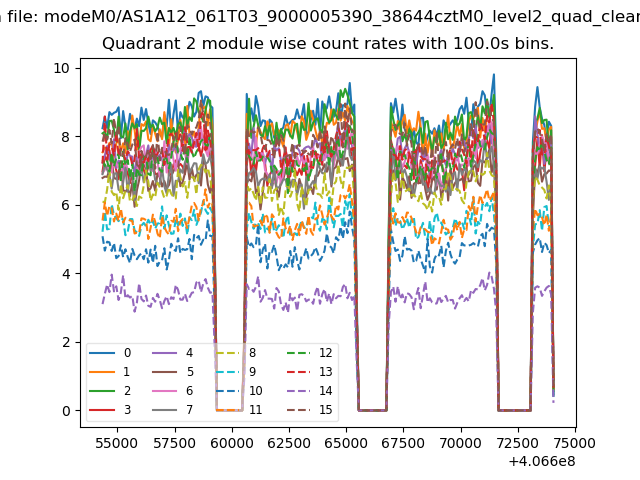
| Module-wise count rates for Quadrant B Data is divided into 100 sec bins |
 |
 |
| Module-wise count rates for Quadrant C Data is divided into 100 sec bins |
 |
 |
| Module-wise count rates for Quadrant D Data is divided into 100 sec bins |
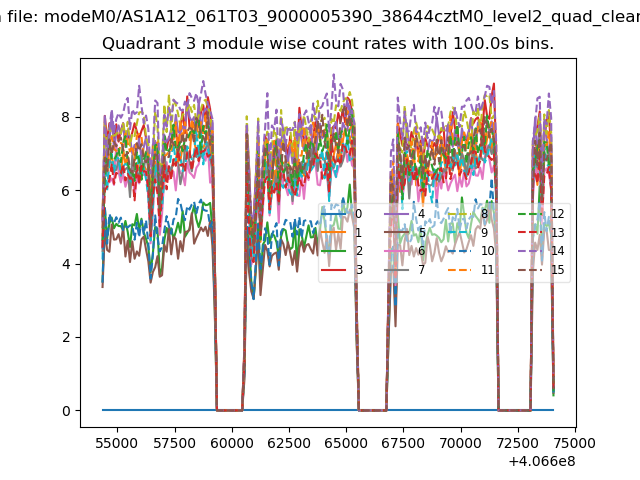 |
 |
| Parameter | Plot |
|---|---|
| CZT HV Monitor | 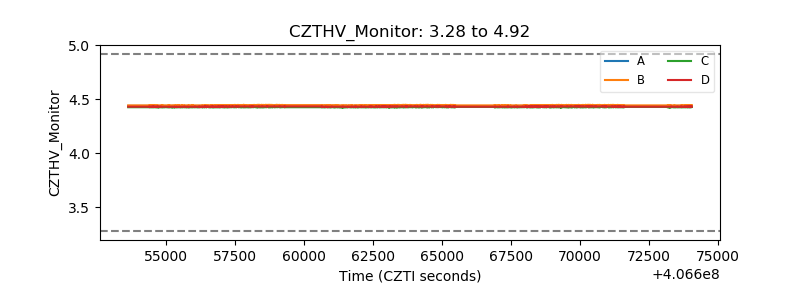 |
| D_VDD | 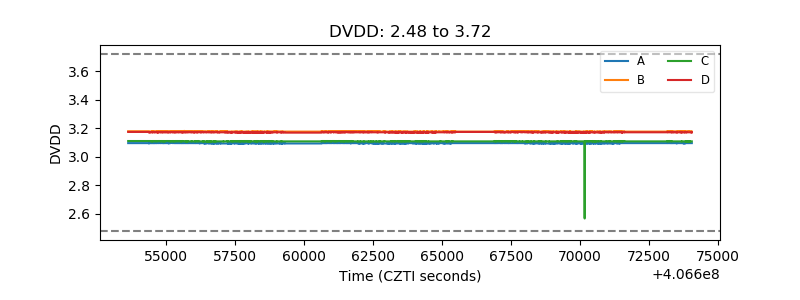 |
| Temperature 1 | 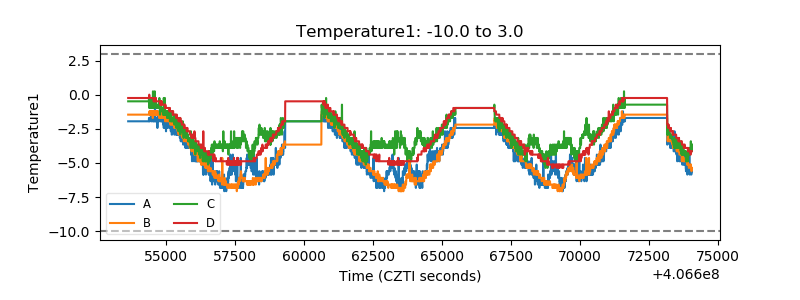 |
| Veto HV Monitor | 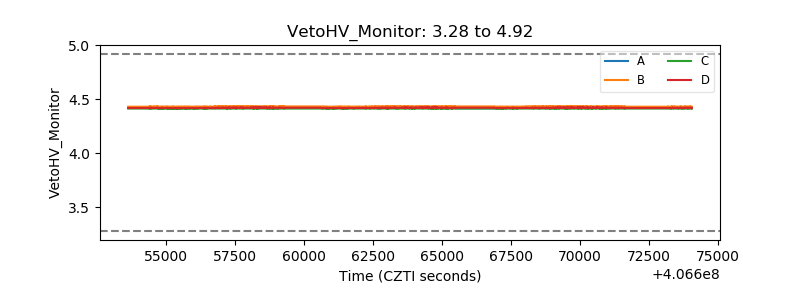 |
| Veto LLD | 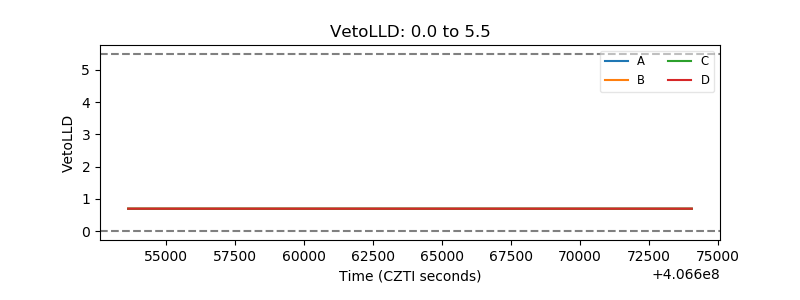 |
| Alpha Counter | 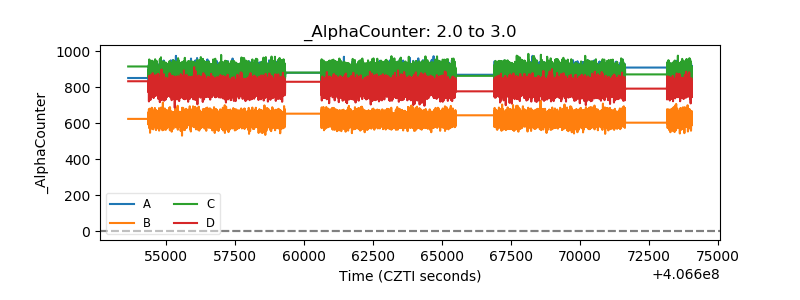 |
| _CPM_Rate | 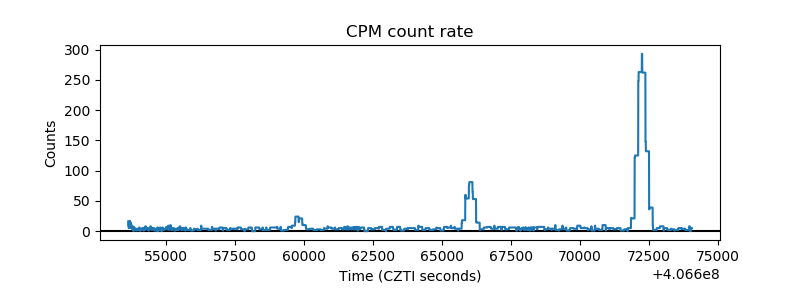 |
| CZT Counter | 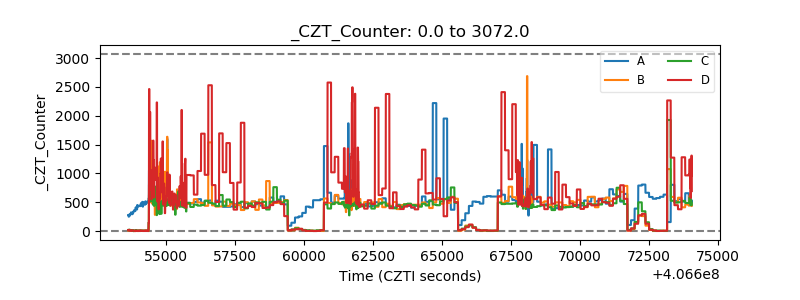 |
| +2.5 Volts monitor | 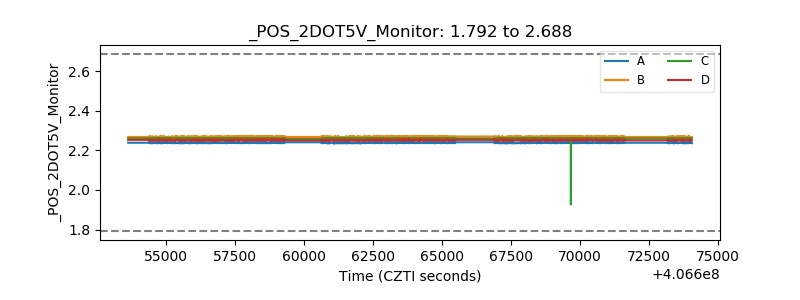 |
| +5 Volts monitor | 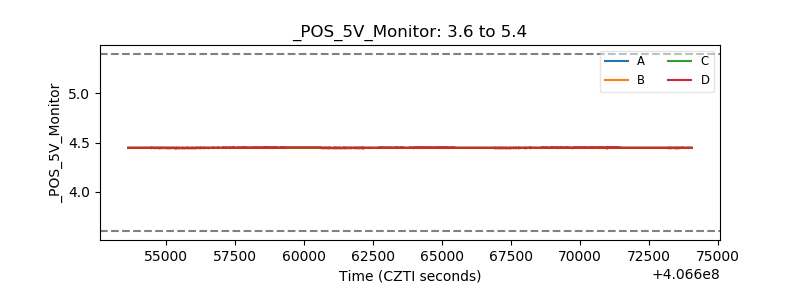 |
| _ROLL_ROT | 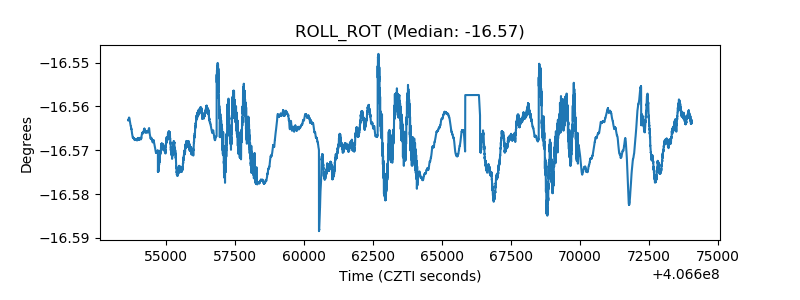 |
| _Roll_DEC | 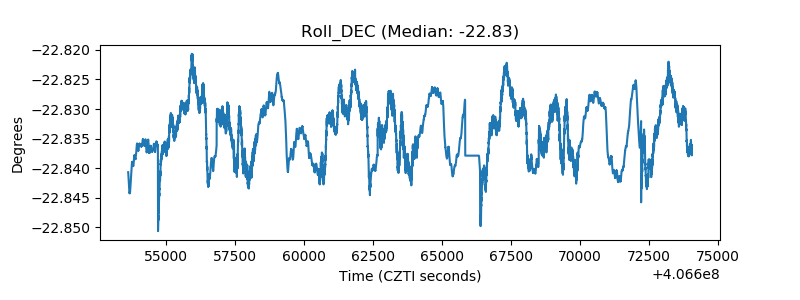 |
| _Roll_RA | 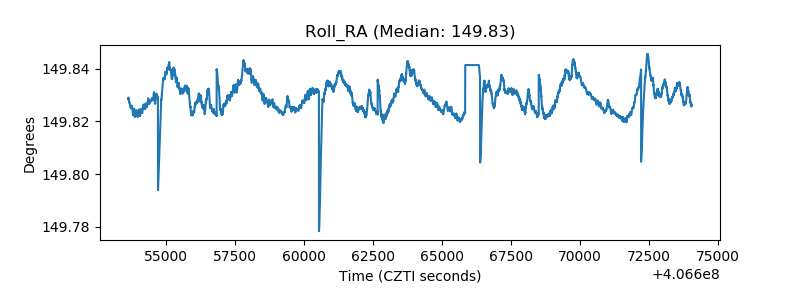 |
| Veto Counter | 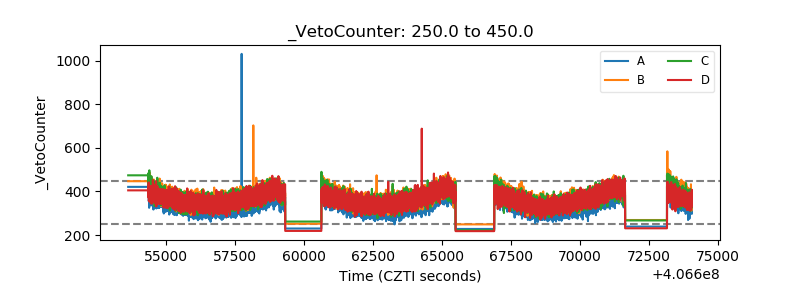 |