| Param | Original file | Final file |
|---|---|---|
| Filename | modeM0/AS1A12_061T03_9000005390_38645cztM0_level2.fits | modeM0/AS1A12_061T03_9000005390_38645cztM0_level2_quad_clean.evt |
| Size (bytes) | 356,163,840 | 92,689,920 |
| Size | 339.7 MB | 88.4 MB |
| Events in quadrant A | 2,968,583 | 623,849 |
| Events in quadrant B | 2,855,458 | 635,531 |
| Events in quadrant C | 3,302,254 | 602,955 |
| Events in quadrant D | 3,626,993 | 557,275 |
| Mode SS | |||
|---|---|---|---|
| Quadrant | BADHDUFLAG | Total packets | Discarded packets |
| A | 0 | 112 | 0 |
| B | 0 | 112 | 0 |
| C | 0 | 112 | 0 |
| D | 0 | 112 | 0 |
| Mode M9 | |||
|---|---|---|---|
| Quadrant | BADHDUFLAG | Total packets | Discarded packets |
| A | 0 | 27 | 0 |
| B | 0 | 27 | 0 |
| C | 0 | 27 | 0 |
| D | 0 | 28 | 0 |
| Mode M0 | |||
|---|---|---|---|
| Quadrant | BADHDUFLAG | Total packets | Discarded packets |
| A | 0 | 12270 | 3 |
| B | 0 | 12207 | 2 |
| C | 0 | 13280 | 2 |
| D | 0 | 14455 | 2 |
| Quadrant | Total seconds | Saturated seconds | Saturation percentage |
|---|---|---|---|
| A | 5532 | 22 | 0.397686% |
| B | 5532 | 76 | 1.373825% |
| C | 5532 | 135 | 2.440347% |
| D | 5532 | 163 | 2.946493% |
Noise dominated data is calculated using 1-second bins in cleaned event files. If a bin has >2000 counts, and if more than 50% of those come from <1% of pixels, then it is considered to be noise-dominated and hence unusable.
| Quadrant | # 1 sec bins | Bins with >0 counts | Bins with >2000 counts | High rate bins dominated by noise | Noise dominated (total time) | Noise dominated (detector-on time) | Marked lightcurve |
|---|---|---|---|---|---|---|---|
| A | 7145 | 5533 | 8 | 8 | 0.11% | 0.14% | 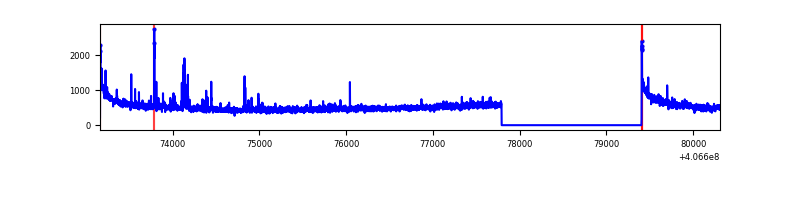 |
| B | 7145 | 5533 | 38 | 38 | 0.53% | 0.69% | 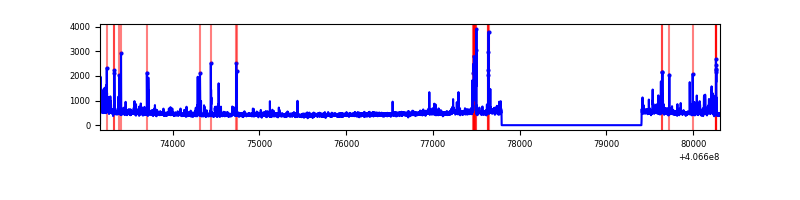 |
| C | 7145 | 5533 | 124 | 124 | 1.74% | 2.24% | 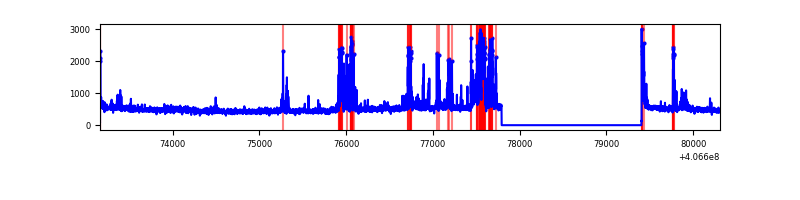 |
| D | 7145 | 5533 | 147 | 147 | 2.06% | 2.66% | 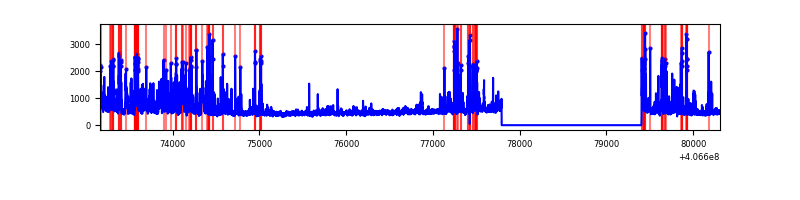 |
Top three noisy pixels from each quadrant. If the there are fewer than three noisy pixels in the level2.evt file, extra rows are filled as -1
| Pixel properties | Quadrant properties | ||||||
|---|---|---|---|---|---|---|---|
| Quadrant | DetID | PixID | Counts | Sigma | Mean | Median | Sigma |
| A | 10 | 83 | 427446 | 3345.56 | 625 | 614 | 127.6 |
| A | 13 | 6 | 22402 | 170.78 | 625 | 614 | 127.6 |
| A | 9 | 143 | 22087 | 168.31 | 625 | 614 | 127.6 |
| B | 4 | 171 | 277982 | 2323.14 | 621 | 604 | 119.4 |
| B | 4 | 251 | 52155 | 431.76 | 621 | 604 | 119.4 |
| B | 0 | 221 | 28131 | 230.55 | 621 | 604 | 119.4 |
| C | 14 | 254 | 505615 | 3525.58 | 609 | 613 | 143.2 |
| C | 15 | 214 | 219669 | 1529.3 | 609 | 613 | 143.2 |
| C | 3 | 110 | 81048 | 561.54 | 609 | 613 | 143.2 |
| D | 13 | 249 | 303694 | 2026.21 | 604 | 588 | 149.6 |
| D | 2 | 250 | 265438 | 1770.47 | 604 | 588 | 149.6 |
| D | 2 | 153 | 237524 | 1583.87 | 604 | 588 | 149.6 |
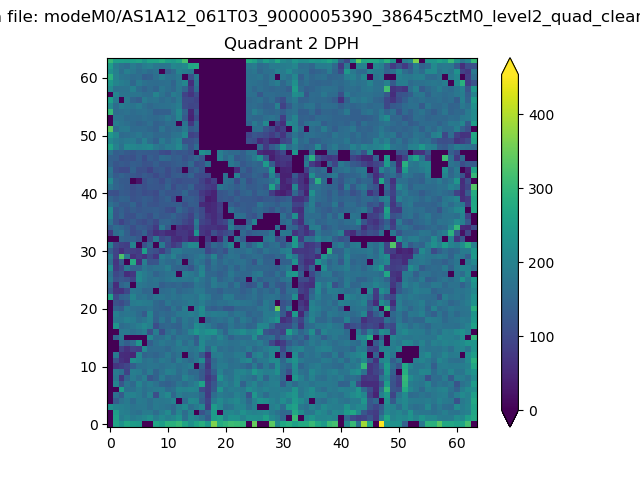
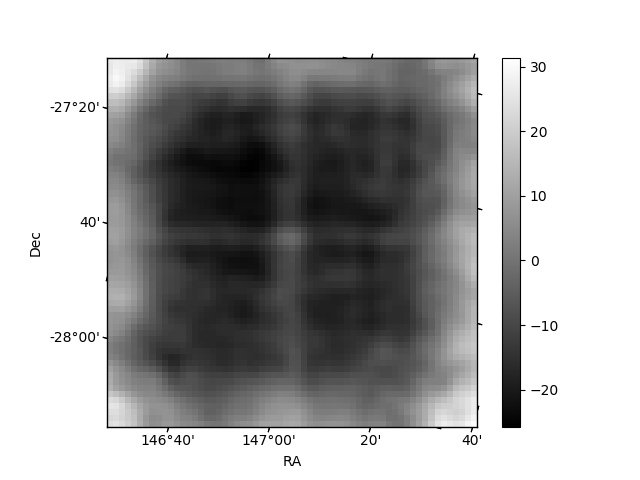
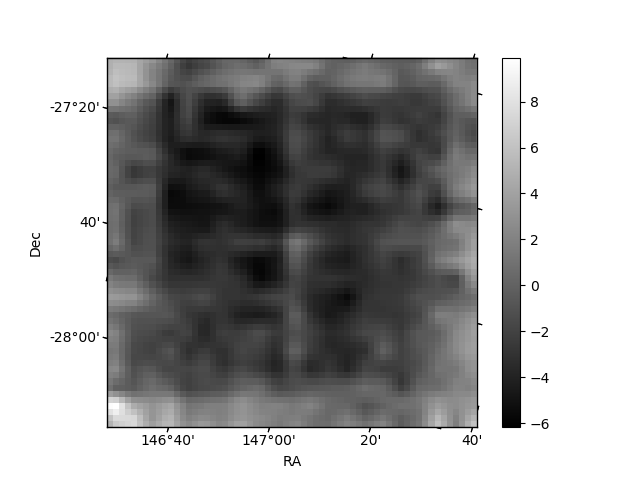
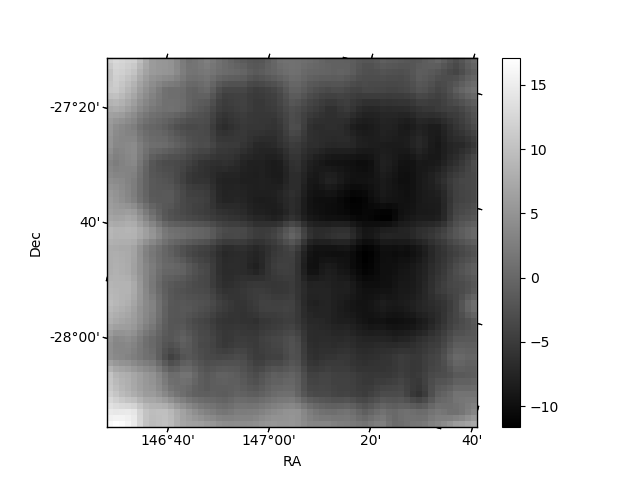
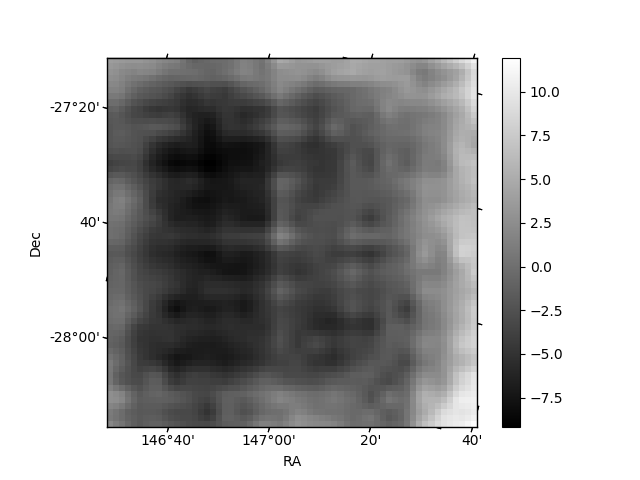
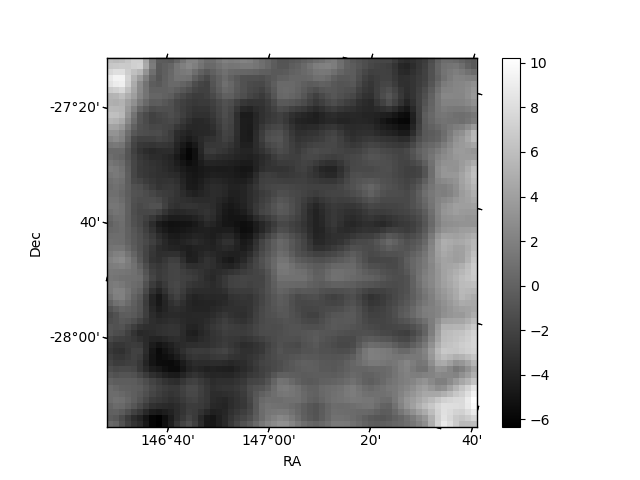
Histogram calculated using DETX and DETY for each event in the final _common_clean file
| Quadrant A | 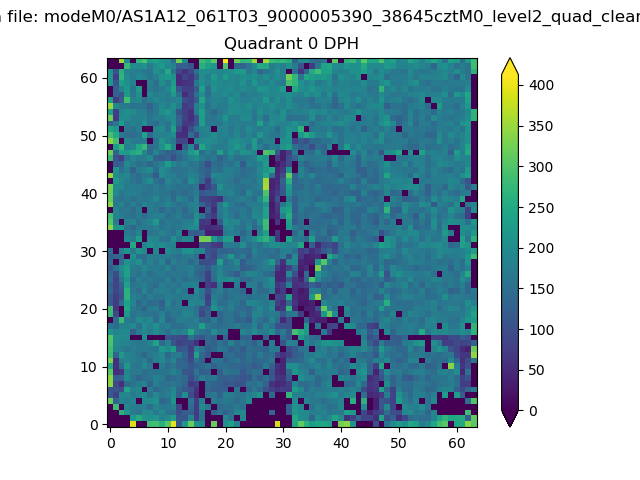 |
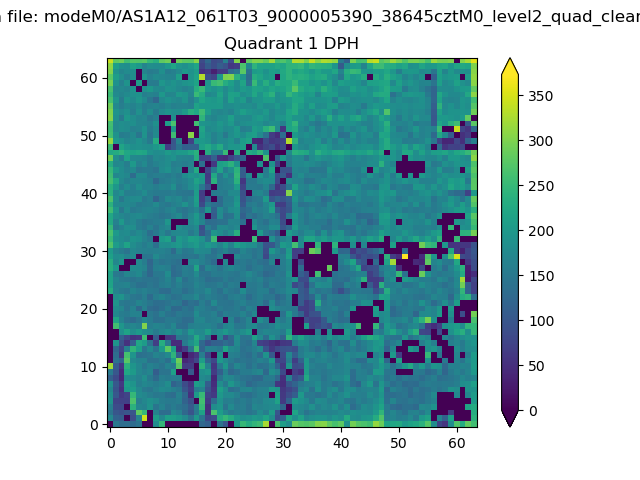 |
Quadrant B |
|---|---|---|---|
| Quadrant D | 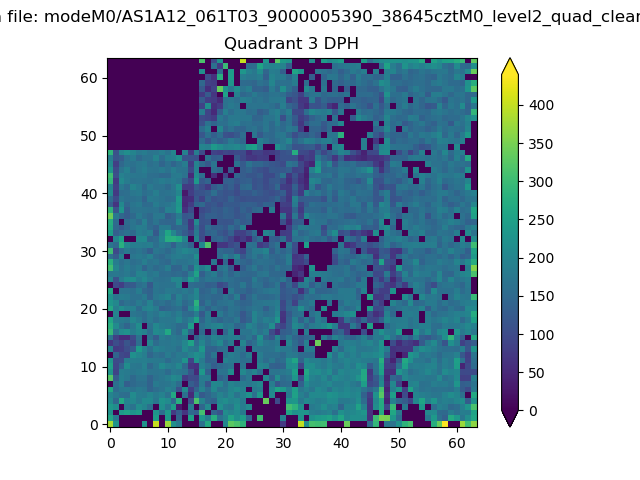 |
 |
Quadrant C |
| Plot type | Count rate plots | Images |
|---|---|---|
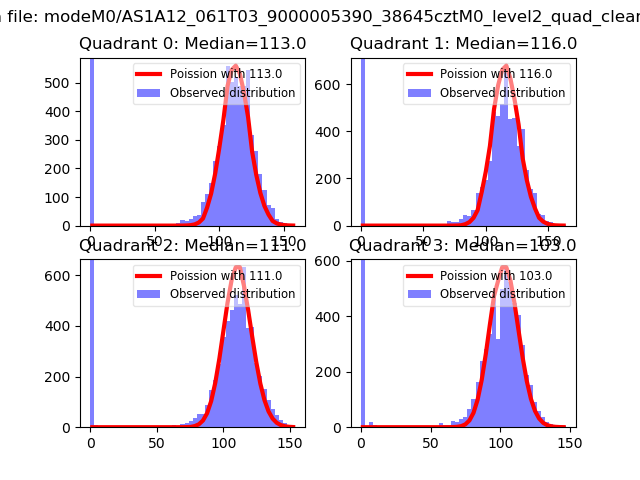
| Comparison with Poisson distribution Blue bars denote a histogram of data divided into 1 sec bins. Red curve is a Poisson curve with rate = median count rate of data. |
 |
 |
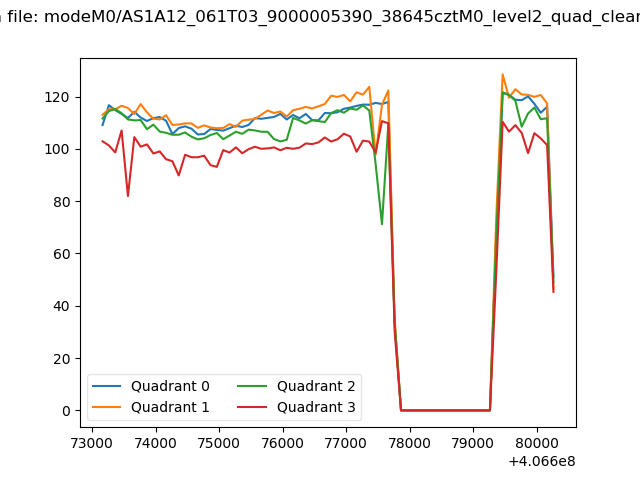
| Quadrant-wise count rates Data is divided into 100 sec bins |
 |
|
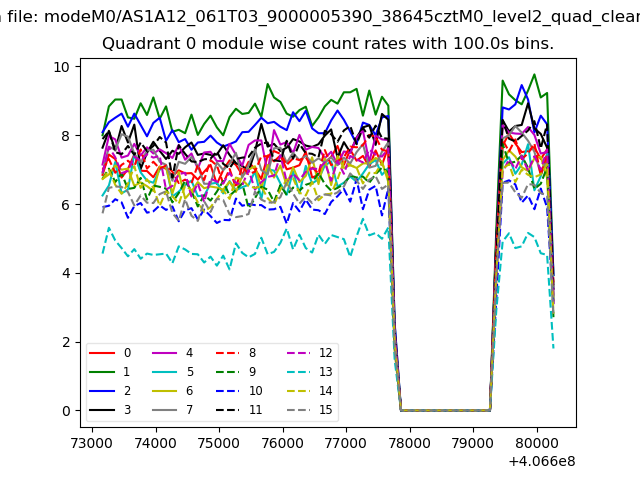
| Module-wise count rates for Quadrant A Data is divided into 100 sec bins |
 |
 |
| Module-wise count rates for Quadrant B Data is divided into 100 sec bins |
 |
 |
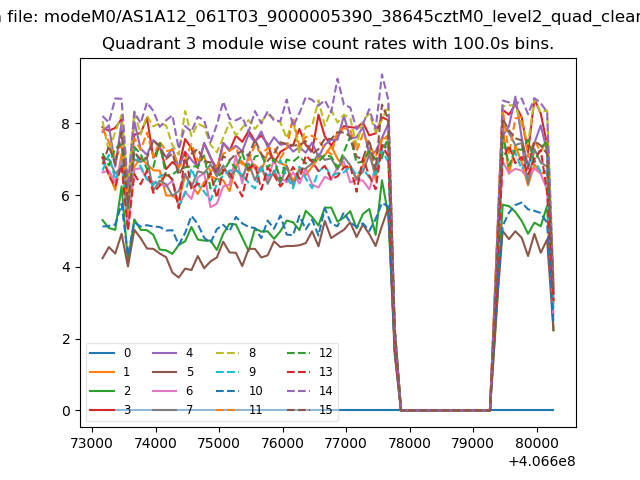
| Module-wise count rates for Quadrant C Data is divided into 100 sec bins |
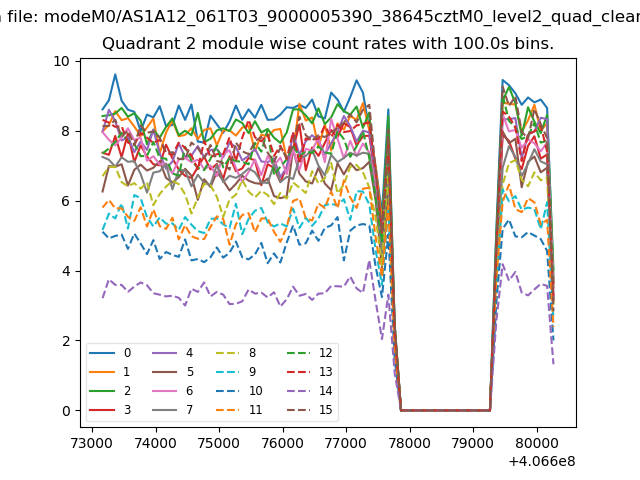 |
 |
| Module-wise count rates for Quadrant D Data is divided into 100 sec bins |
 |
 |
| Parameter | Plot |
|---|---|
| CZT HV Monitor | 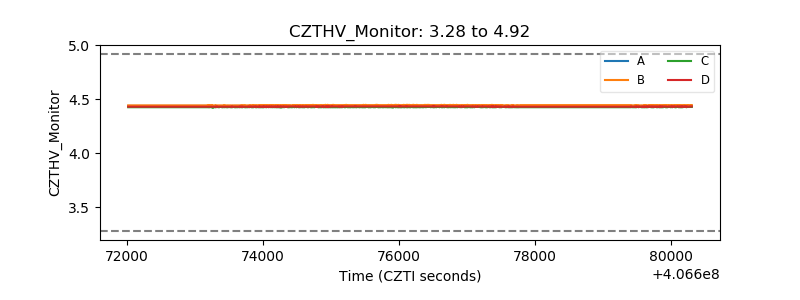 |
| D_VDD | 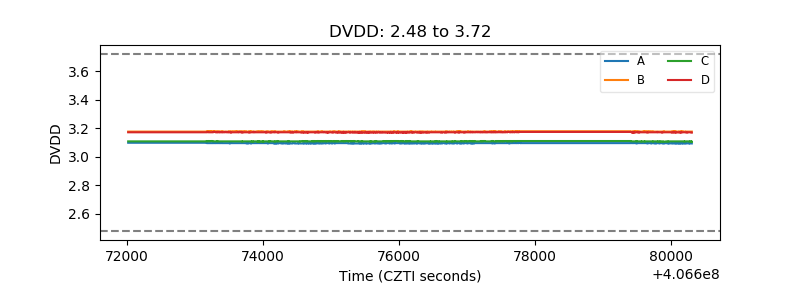 |
| Temperature 1 | 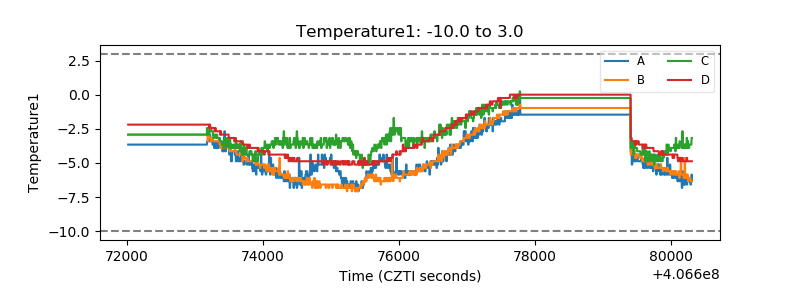 |
| Veto HV Monitor | 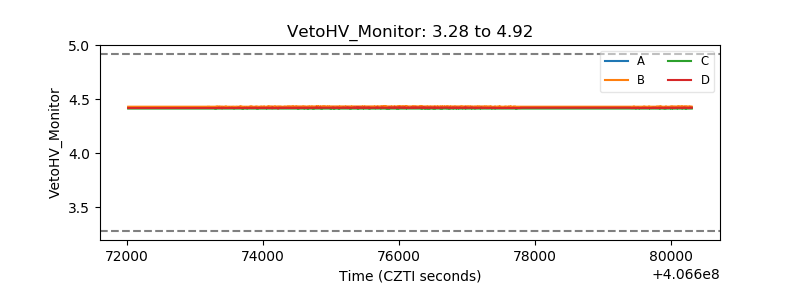 |
| Veto LLD | 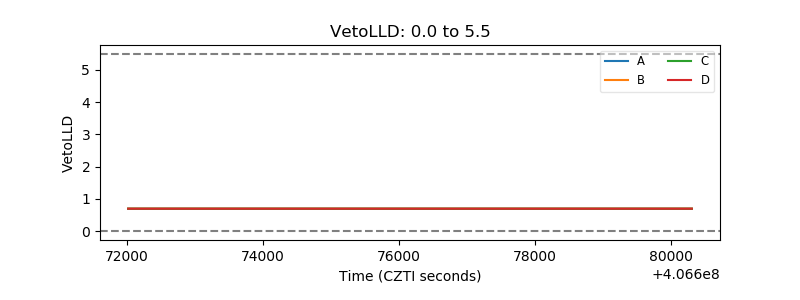 |
| Alpha Counter | 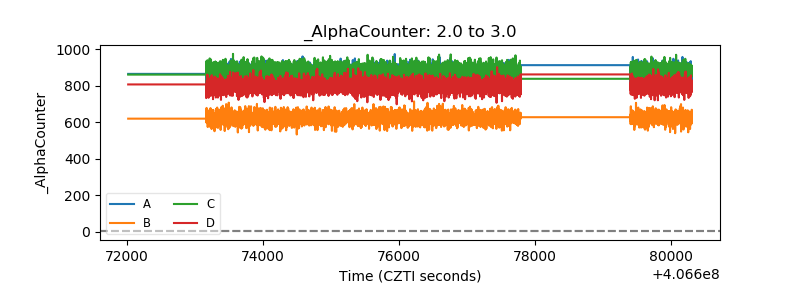 |
| _CPM_Rate | 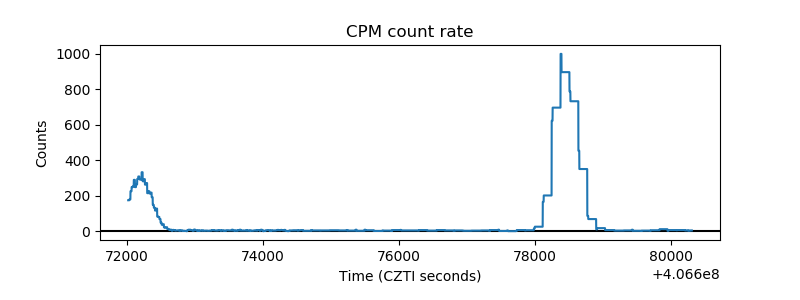 |
| CZT Counter | 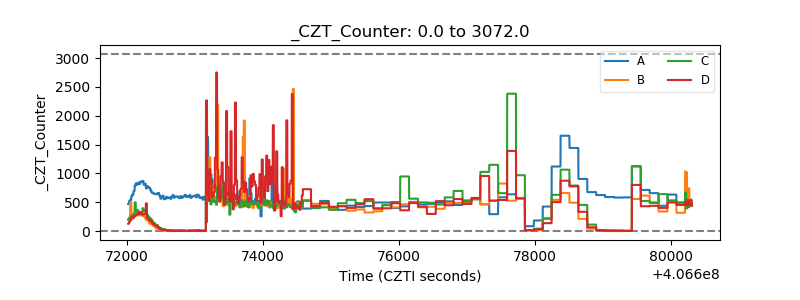 |
| +2.5 Volts monitor |  |
| +5 Volts monitor |  |
| _ROLL_ROT | 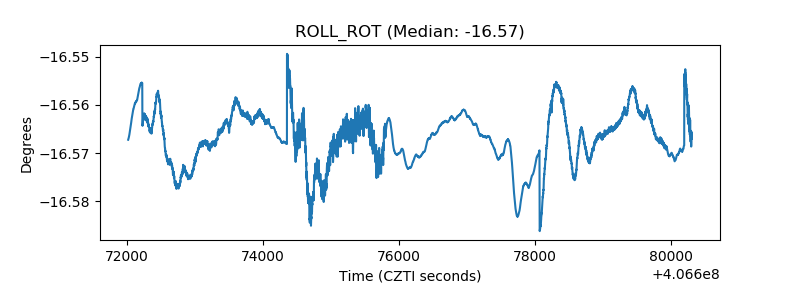 |
| _Roll_DEC | 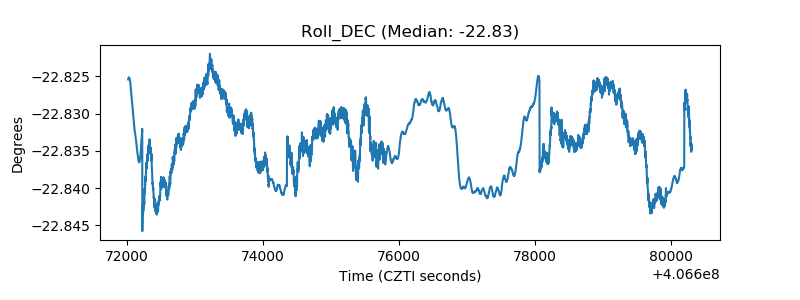 |
| _Roll_RA | 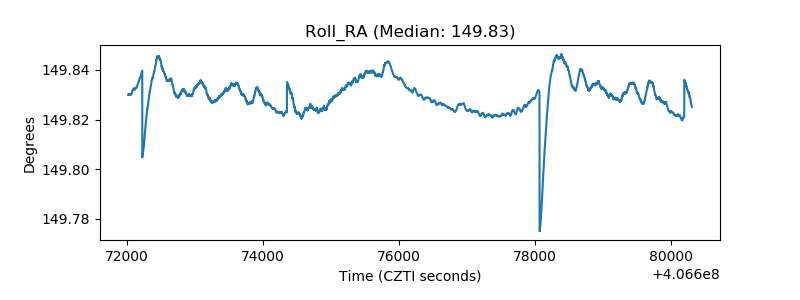 |
| Veto Counter | 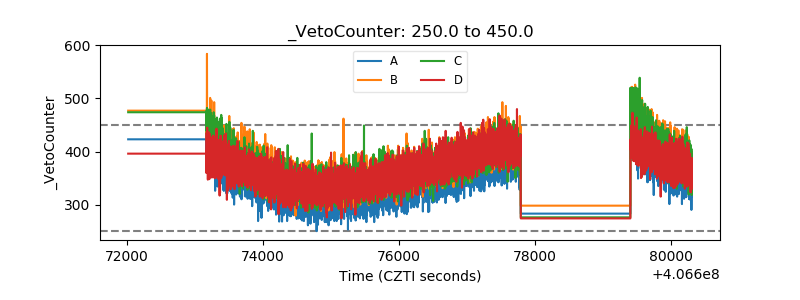 |