| Param | Original file | Final file |
|---|---|---|
| Filename | modeM0/AS1A12_061T03_9000005390_38648cztM0_level2.fits | modeM0/AS1A12_061T03_9000005390_38648cztM0_level2_quad_clean.evt |
| Size (bytes) | 334,342,080 | 99,601,920 |
| Size | 318.9 MB | 95.0 MB |
| Events in quadrant A | 3,064,049 | 669,747 |
| Events in quadrant B | 2,851,719 | 694,774 |
| Events in quadrant C | 2,826,781 | 665,044 |
| Events in quadrant D | 3,201,593 | 598,554 |
| Mode SS | |||
|---|---|---|---|
| Quadrant | BADHDUFLAG | Total packets | Discarded packets |
| A | 0 | 112 | 0 |
| B | 0 | 112 | 0 |
| C | 0 | 112 | 0 |
| D | 0 | 112 | 0 |
| Mode M9 | |||
|---|---|---|---|
| Quadrant | BADHDUFLAG | Total packets | Discarded packets |
| A | 0 | 33 | 0 |
| B | 0 | 33 | 0 |
| C | 0 | 33 | 0 |
| D | 0 | 34 | 0 |
| Mode M0 | |||
|---|---|---|---|
| Quadrant | BADHDUFLAG | Total packets | Discarded packets |
| A | 0 | 12461 | 3 |
| B | 0 | 12114 | 2 |
| C | 0 | 11585 | 2 |
| D | 0 | 13323 | 2 |
| Quadrant | Total seconds | Saturated seconds | Saturation percentage |
|---|---|---|---|
| A | 5548 | 26 | 0.468637% |
| B | 5548 | 15 | 0.270368% |
| C | 5548 | 17 | 0.306417% |
| D | 5548 | 124 | 2.235040% |
Noise dominated data is calculated using 1-second bins in cleaned event files. If a bin has >2000 counts, and if more than 50% of those come from <1% of pixels, then it is considered to be noise-dominated and hence unusable.
| Quadrant | # 1 sec bins | Bins with >0 counts | Bins with >2000 counts | High rate bins dominated by noise | Noise dominated (total time) | Noise dominated (detector-on time) | Marked lightcurve |
|---|---|---|---|---|---|---|---|
| A | 7431 | 5549 | 26 | 26 | 0.35% | 0.47% | 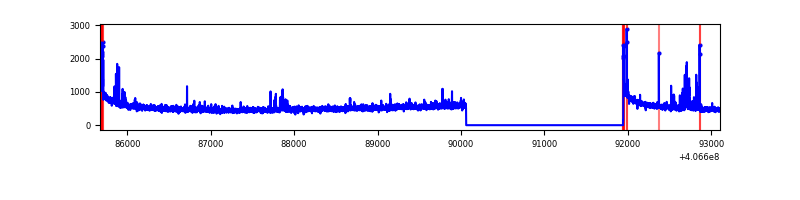 |
| B | 7431 | 5549 | 5 | 5 | 0.07% | 0.09% | 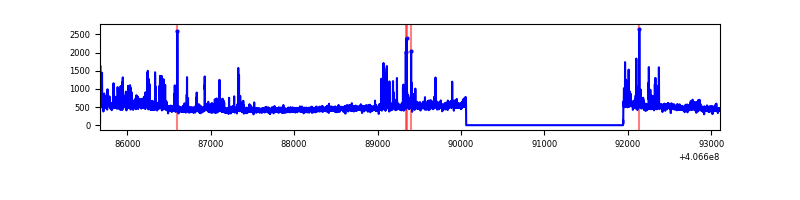 |
| C | 7431 | 5549 | 12 | 12 | 0.16% | 0.22% | 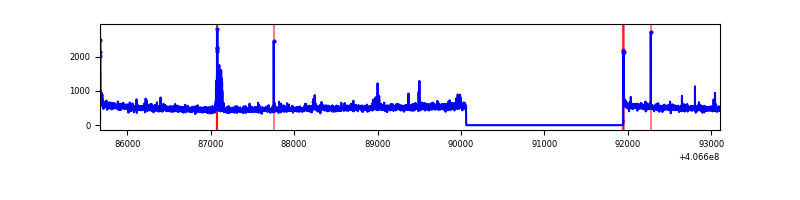 |
| D | 7431 | 5549 | 112 | 112 | 1.51% | 2.02% | 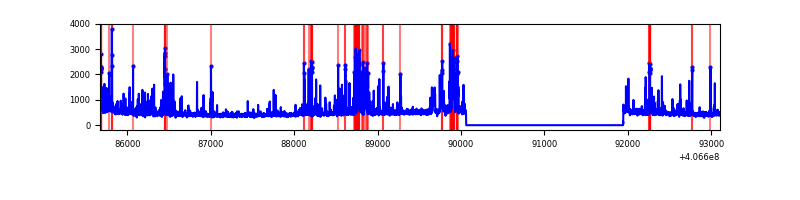 |
Top three noisy pixels from each quadrant. If the there are fewer than three noisy pixels in the level2.evt file, extra rows are filled as -1
| Pixel properties | Quadrant properties | ||||||
|---|---|---|---|---|---|---|---|
| Quadrant | DetID | PixID | Counts | Sigma | Mean | Median | Sigma |
| A | 10 | 83 | 416697 | 3178.68 | 641 | 630 | 130.9 |
| A | 7 | 3 | 62558 | 473.12 | 641 | 630 | 130.9 |
| A | 9 | 143 | 34581 | 259.38 | 641 | 630 | 130.9 |
| B | 4 | 171 | 136362 | 1105.24 | 646 | 630 | 122.8 |
| B | 0 | 155 | 73497 | 593.34 | 646 | 630 | 122.8 |
| B | 0 | 183 | 23865 | 189.2 | 646 | 630 | 122.8 |
| C | 15 | 214 | 221526 | 1483.36 | 637 | 640 | 148.9 |
| C | 14 | 254 | 31273 | 205.72 | 637 | 640 | 148.9 |
| C | 0 | 10 | 23257 | 151.88 | 637 | 640 | 148.9 |
| D | 12 | 233 | 276042 | 1803.25 | 625 | 606 | 152.7 |
| D | 13 | 249 | 166025 | 1082.98 | 625 | 606 | 152.7 |
| D | 5 | 222 | 62886 | 407.74 | 625 | 606 | 152.7 |
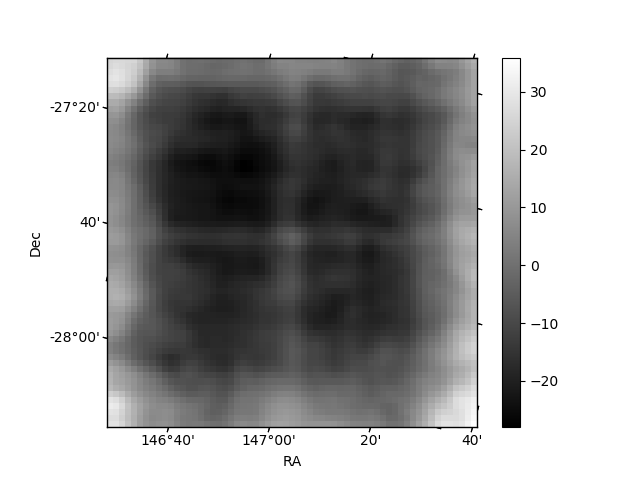
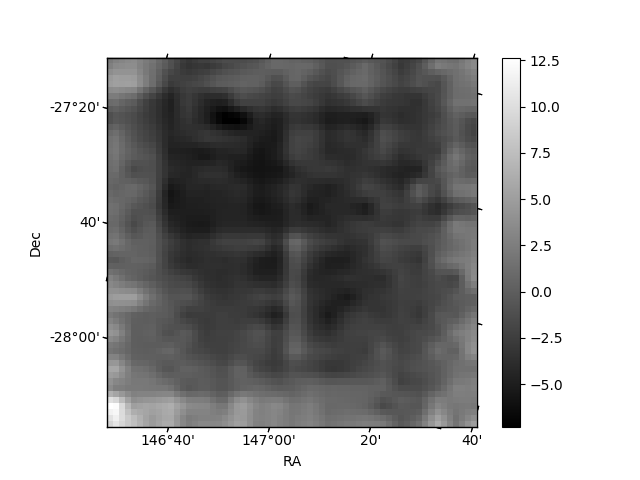
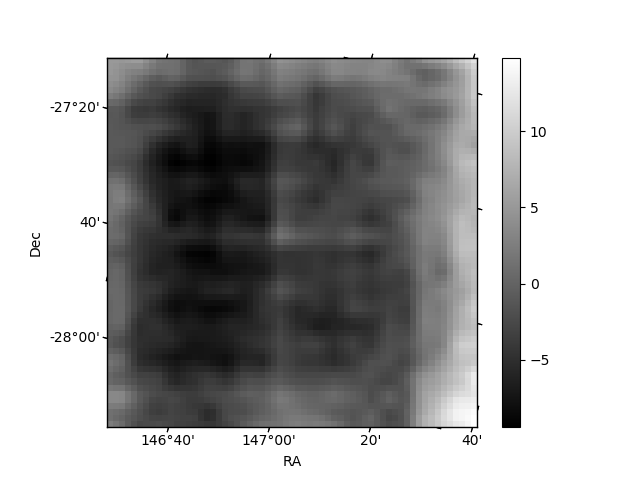
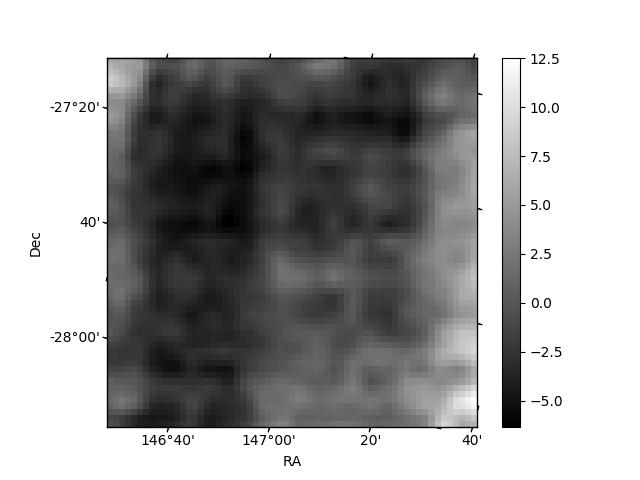
Histogram calculated using DETX and DETY for each event in the final _common_clean file
| Quadrant A | 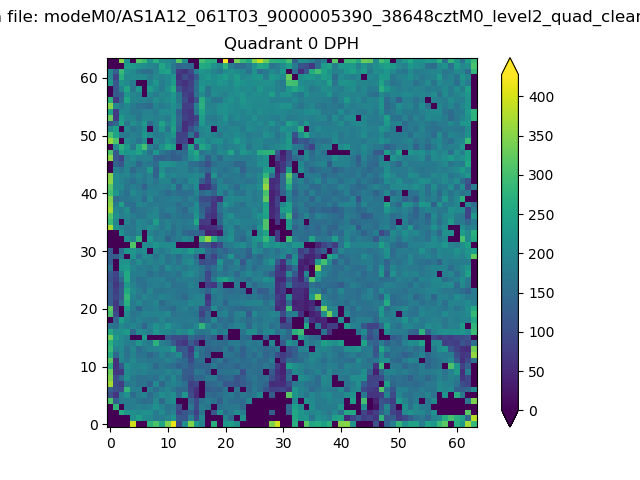 |
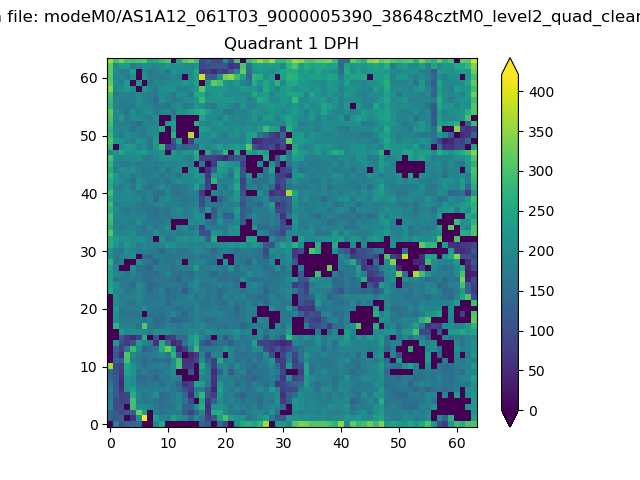 |
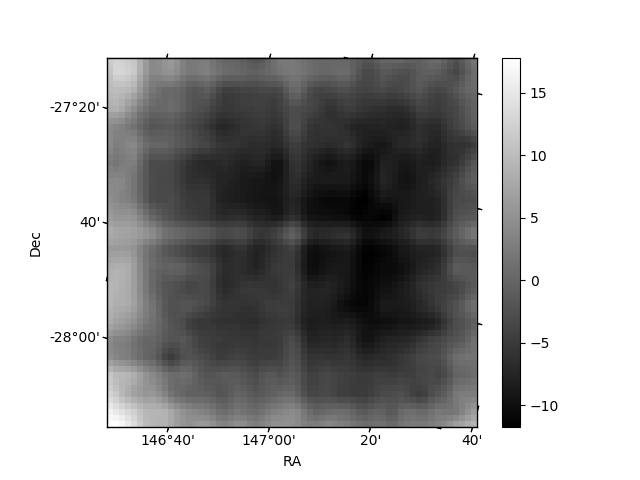
Quadrant B |
|---|---|---|---|
| Quadrant D | 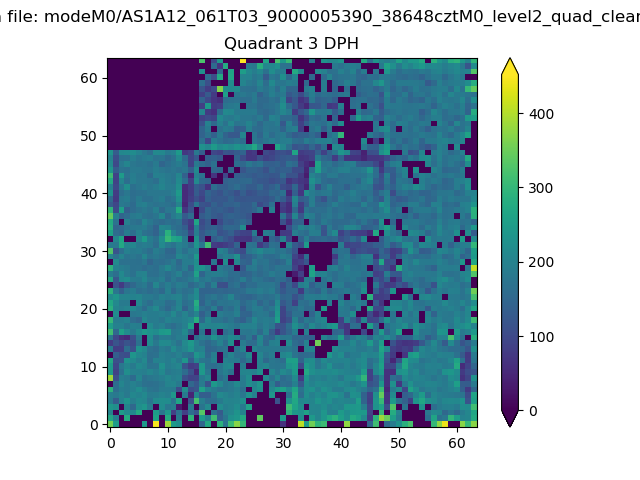 |
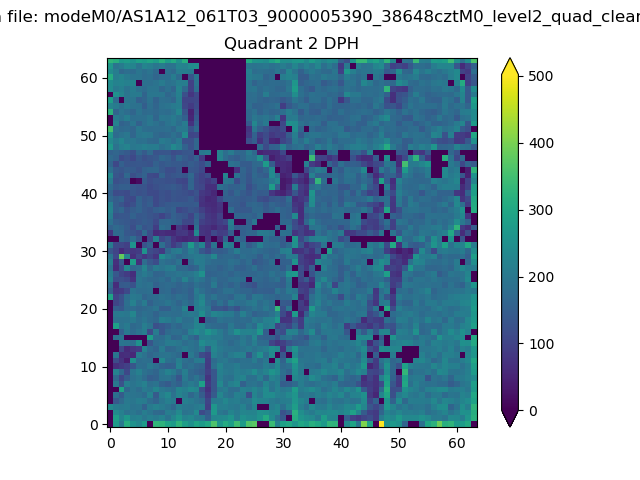 |
Quadrant C |
| Plot type | Count rate plots | Images |
|---|---|---|
| Comparison with Poisson distribution Blue bars denote a histogram of data divided into 1 sec bins. Red curve is a Poisson curve with rate = median count rate of data. |
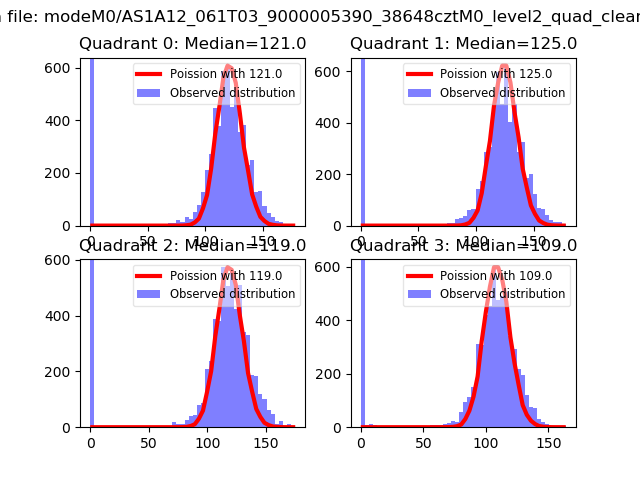 |
 |
| Quadrant-wise count rates Data is divided into 100 sec bins |
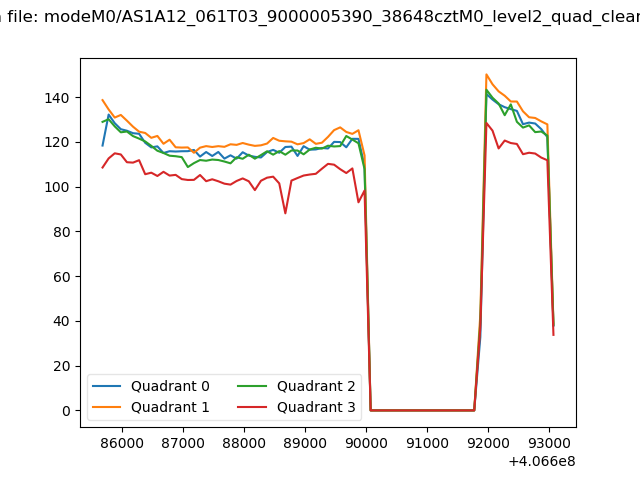 |
|
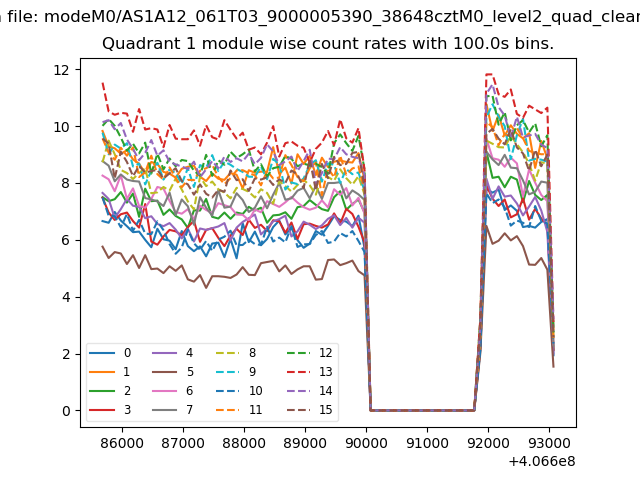
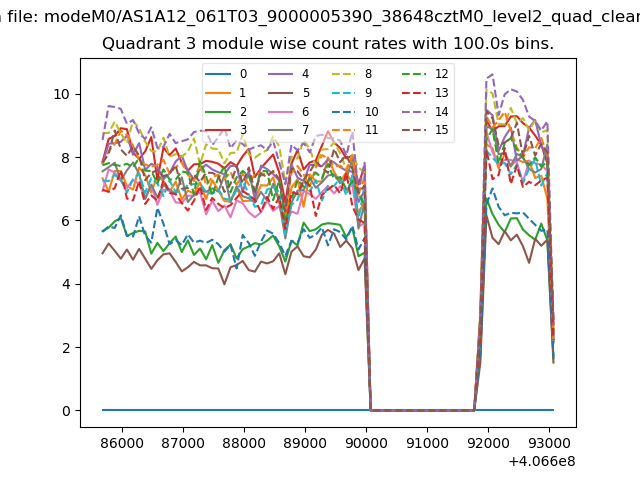
| Module-wise count rates for Quadrant A Data is divided into 100 sec bins |
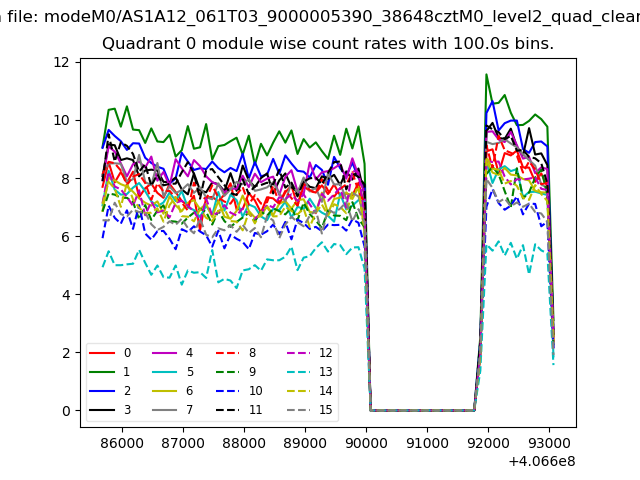 |
 |
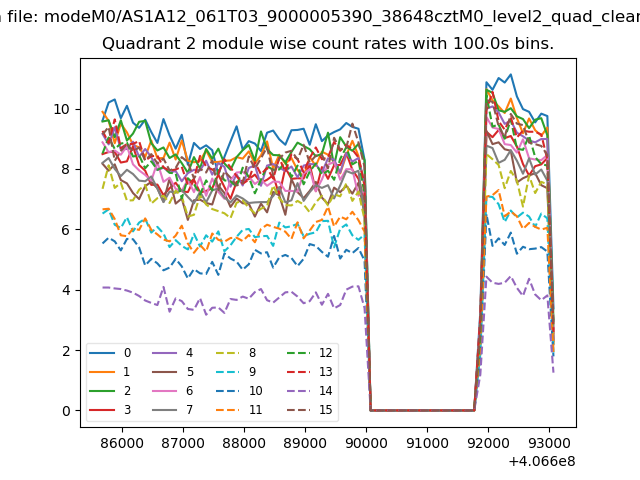
| Module-wise count rates for Quadrant B Data is divided into 100 sec bins |
 |
 |
| Module-wise count rates for Quadrant C Data is divided into 100 sec bins |
 |
 |
| Module-wise count rates for Quadrant D Data is divided into 100 sec bins |
 |
 |
| Parameter | Plot |
|---|---|
| CZT HV Monitor | 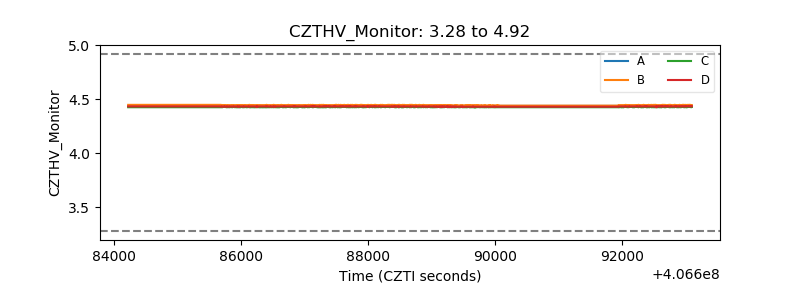 |
| D_VDD | 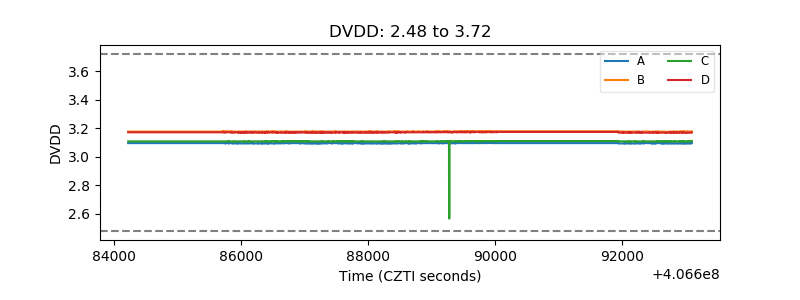 |
| Temperature 1 | 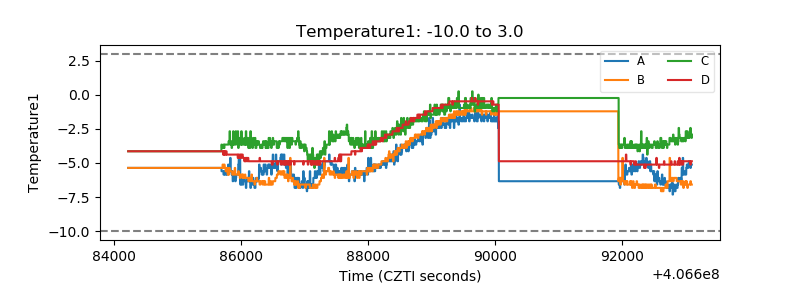 |
| Veto HV Monitor | 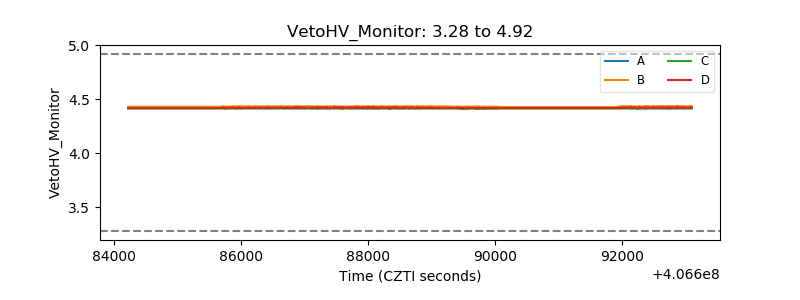 |
| Veto LLD | 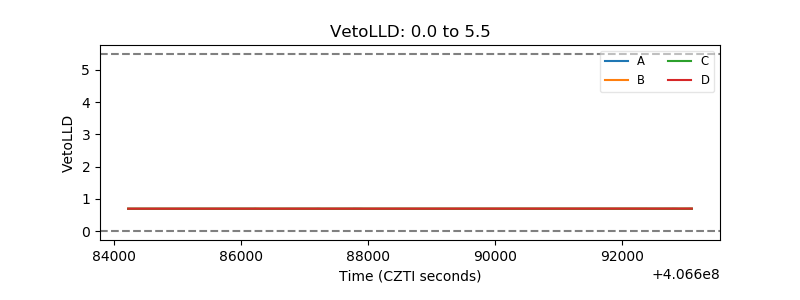 |
| Alpha Counter | 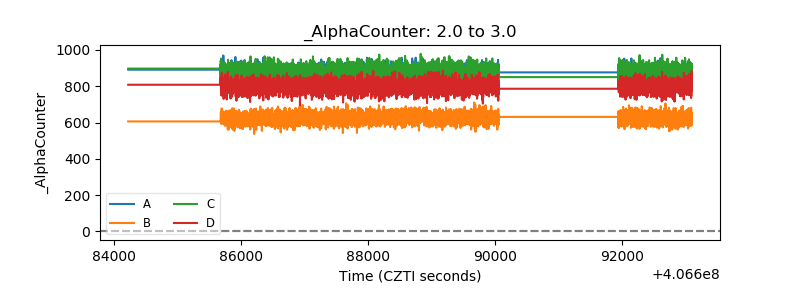 |
| _CPM_Rate | 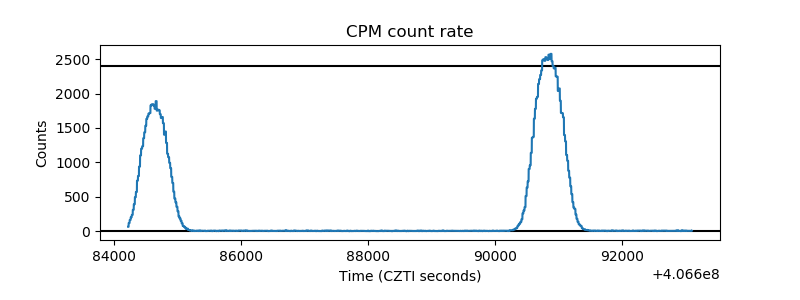 |
| CZT Counter | 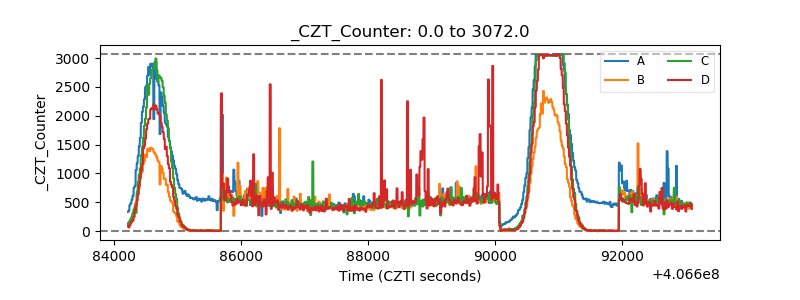 |
| +2.5 Volts monitor | 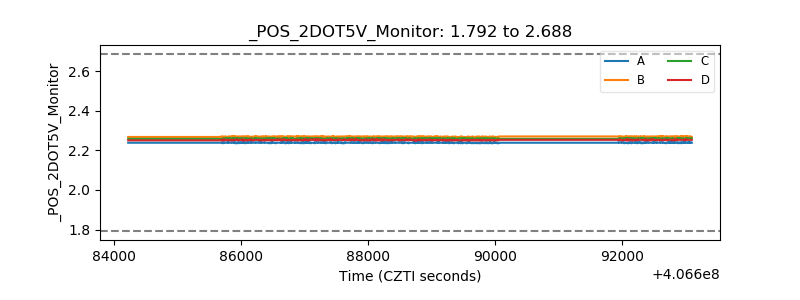 |
| +5 Volts monitor | 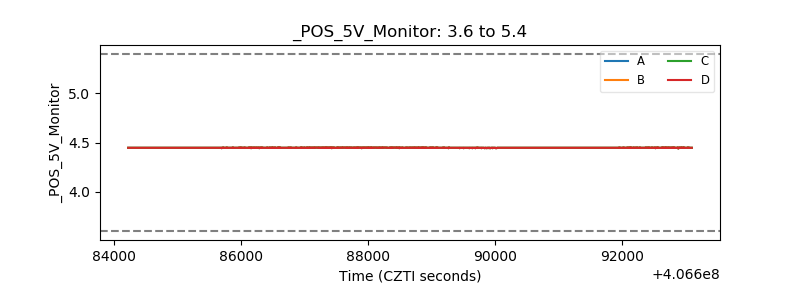 |
| _ROLL_ROT | 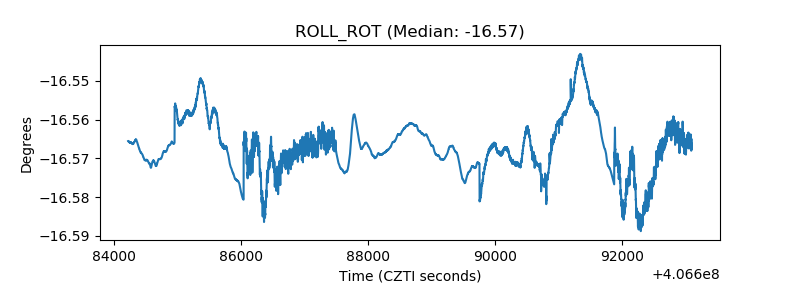 |
| _Roll_DEC | 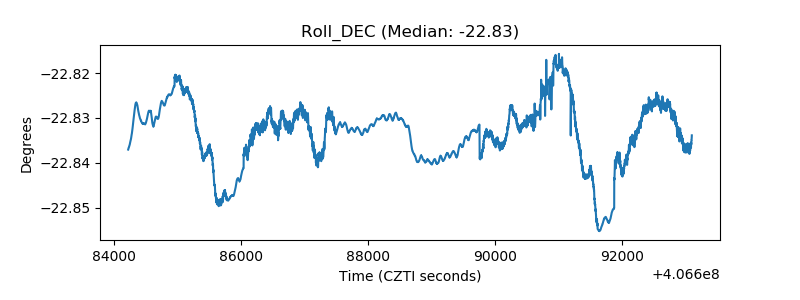 |
| _Roll_RA | 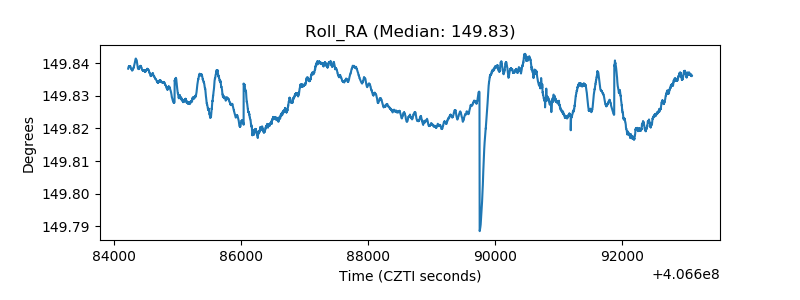 |
| Veto Counter | 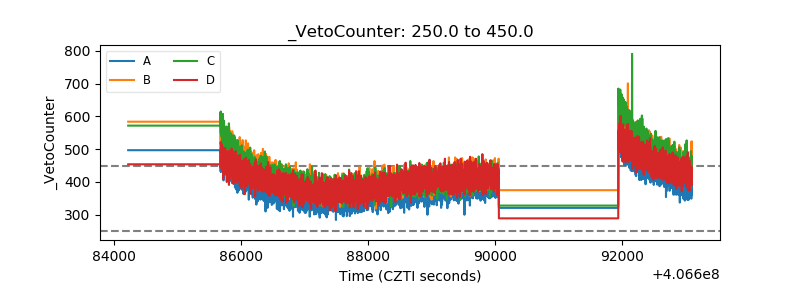 |