| Param | Original file | Final file |
|---|---|---|
| Filename | modeM0/AS1A12_061T03_9000005390_38649cztM0_level2.fits | modeM0/AS1A12_061T03_9000005390_38649cztM0_level2_quad_clean.evt |
| Size (bytes) | 331,231,680 | 99,982,080 |
| Size | 315.9 MB | 95.4 MB |
| Events in quadrant A | 3,132,769 | 675,580 |
| Events in quadrant B | 2,688,612 | 702,938 |
| Events in quadrant C | 2,992,787 | 664,138 |
| Events in quadrant D | 3,030,164 | 610,613 |
| Mode SS | |||
|---|---|---|---|
| Quadrant | BADHDUFLAG | Total packets | Discarded packets |
| A | 0 | 108 | 0 |
| B | 0 | 108 | 0 |
| C | 0 | 108 | 0 |
| D | 0 | 108 | 0 |
| Mode M9 | |||
|---|---|---|---|
| Quadrant | BADHDUFLAG | Total packets | Discarded packets |
| A | 0 | 26 | 0 |
| B | 0 | 26 | 0 |
| C | 0 | 26 | 0 |
| D | 0 | 27 | 0 |
| Mode M0 | |||
|---|---|---|---|
| Quadrant | BADHDUFLAG | Total packets | Discarded packets |
| A | 0 | 12599 | 3 |
| B | 0 | 11179 | 2 |
| C | 0 | 11857 | 2 |
| D | 0 | 12508 | 2 |
| Quadrant | Total seconds | Saturated seconds | Saturation percentage |
|---|---|---|---|
| A | 5353 | 36 | 0.672520% |
| B | 5353 | 15 | 0.280217% |
| C | 5353 | 100 | 1.868111% |
| D | 5353 | 71 | 1.326359% |
Noise dominated data is calculated using 1-second bins in cleaned event files. If a bin has >2000 counts, and if more than 50% of those come from <1% of pixels, then it is considered to be noise-dominated and hence unusable.
| Quadrant | # 1 sec bins | Bins with >0 counts | Bins with >2000 counts | High rate bins dominated by noise | Noise dominated (total time) | Noise dominated (detector-on time) | Marked lightcurve |
|---|---|---|---|---|---|---|---|
| A | 7356 | 5353 | 26 | 26 | 0.35% | 0.49% | 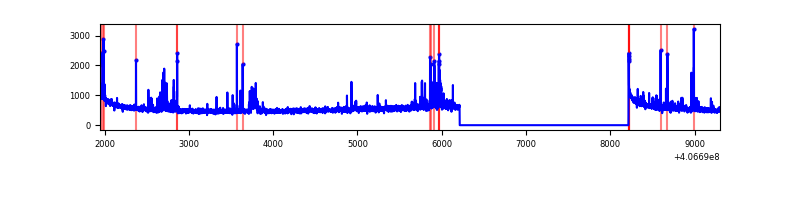 |
| B | 7356 | 5353 | 5 | 5 | 0.07% | 0.09% | 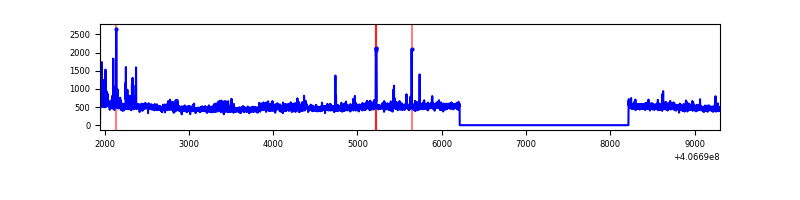 |
| C | 7356 | 5353 | 92 | 92 | 1.25% | 1.72% | 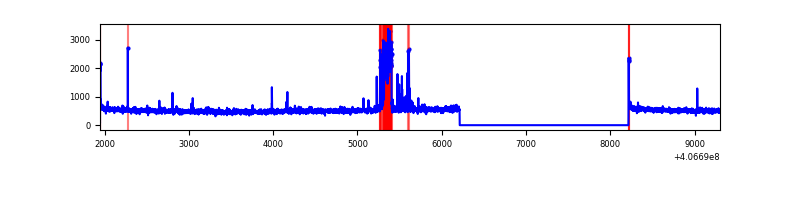 |
| D | 7356 | 5353 | 56 | 56 | 0.76% | 1.05% | 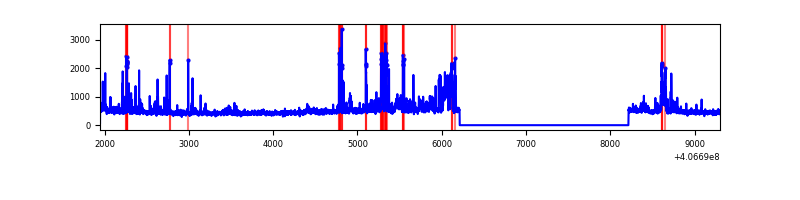 |
Top three noisy pixels from each quadrant. If the there are fewer than three noisy pixels in the level2.evt file, extra rows are filled as -1
| Pixel properties | Quadrant properties | ||||||
|---|---|---|---|---|---|---|---|
| Quadrant | DetID | PixID | Counts | Sigma | Mean | Median | Sigma |
| A | 10 | 83 | 409380 | 3187.31 | 635 | 622 | 128.2 |
| A | 7 | 3 | 119536 | 927.24 | 635 | 622 | 128.2 |
| A | 9 | 143 | 82365 | 637.39 | 635 | 622 | 128.2 |
| B | 0 | 155 | 75010 | 618.79 | 640 | 623 | 120.2 |
| B | 4 | 171 | 45819 | 375.96 | 640 | 623 | 120.2 |
| B | 15 | 85 | 15383 | 122.78 | 640 | 623 | 120.2 |
| C | 14 | 254 | 255991 | 1735.78 | 631 | 636 | 147.1 |
| C | 15 | 214 | 215209 | 1458.56 | 631 | 636 | 147.1 |
| C | 3 | 110 | 24392 | 161.48 | 631 | 636 | 147.1 |
| D | 5 | 222 | 247339 | 1626.79 | 626 | 611 | 151.7 |
| D | 13 | 249 | 106304 | 696.88 | 626 | 611 | 151.7 |
| D | 2 | 249 | 97632 | 639.7 | 626 | 611 | 151.7 |
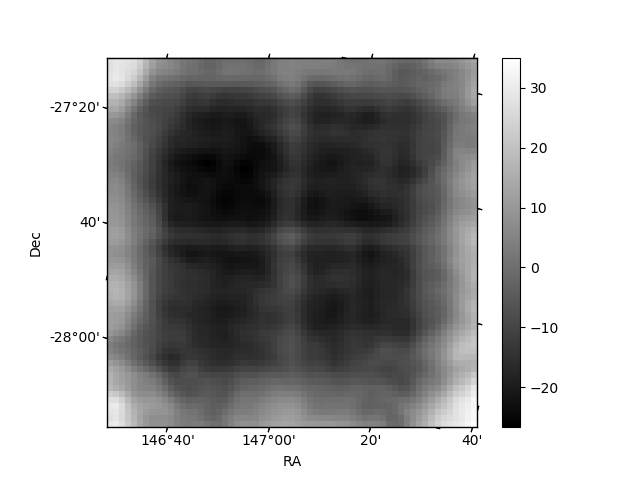
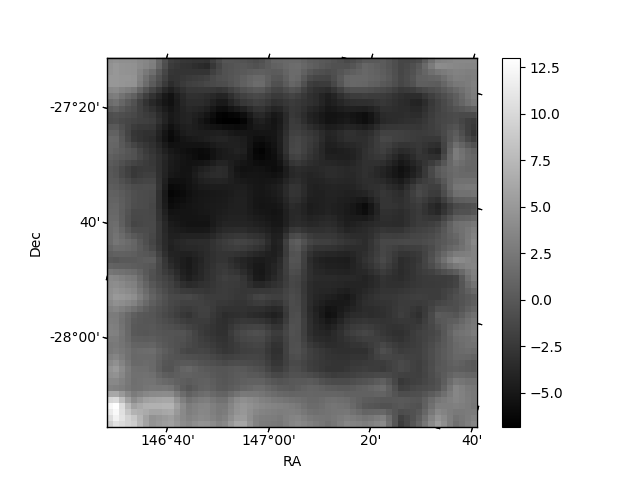
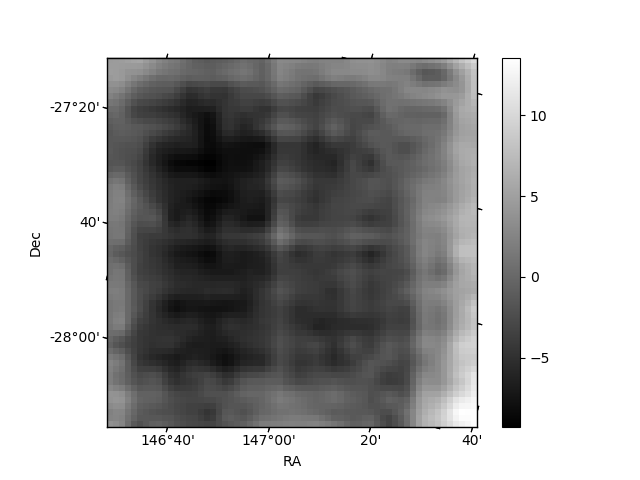
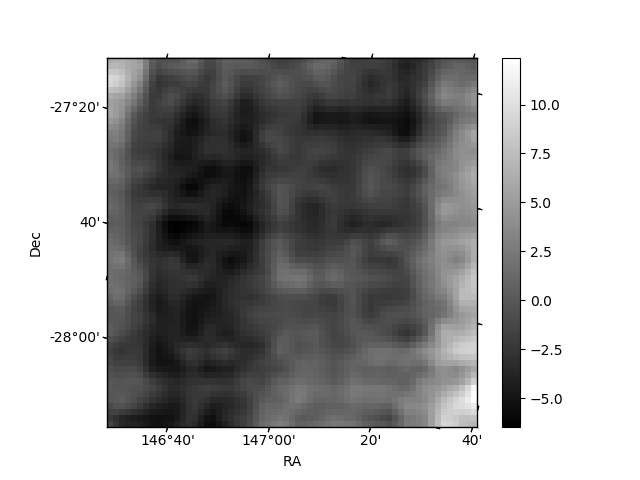
Histogram calculated using DETX and DETY for each event in the final _common_clean file
| Quadrant A | 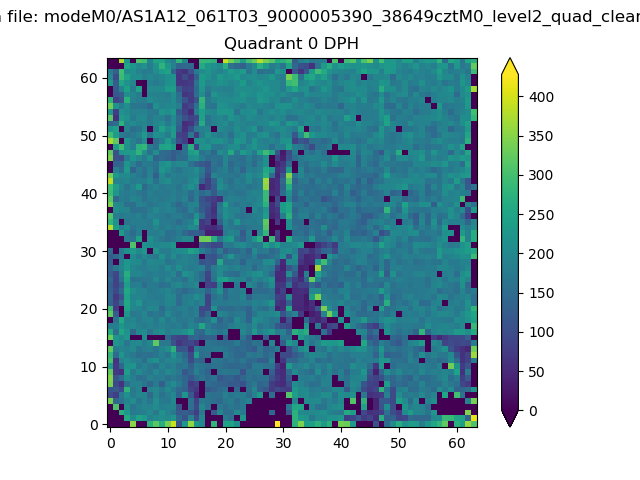 |
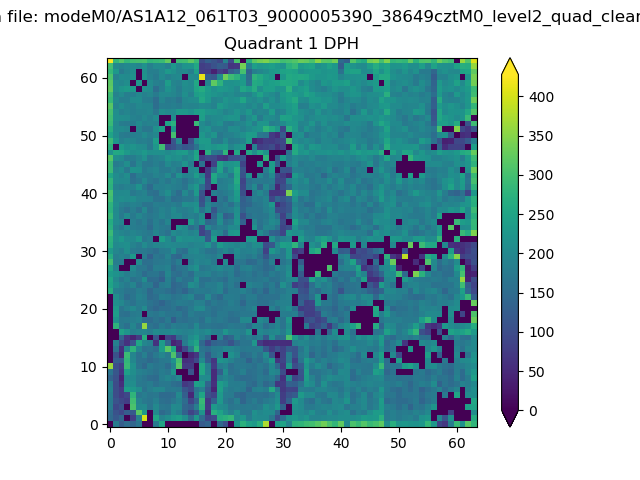 |
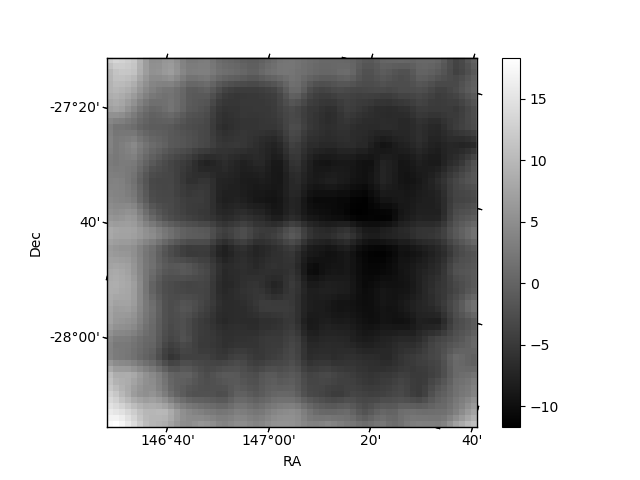
Quadrant B |
|---|---|---|---|
| Quadrant D | 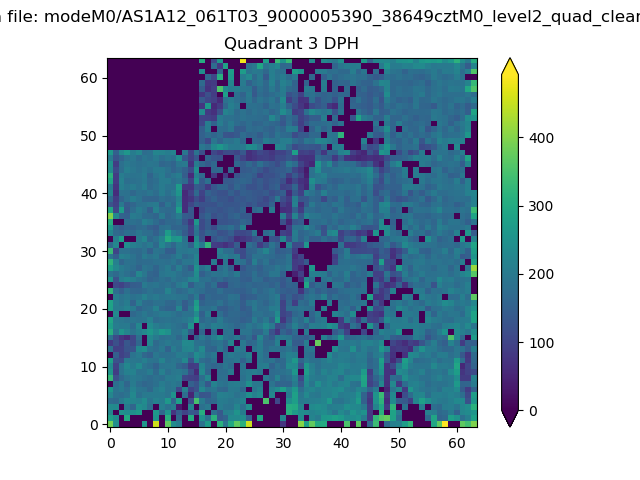 |
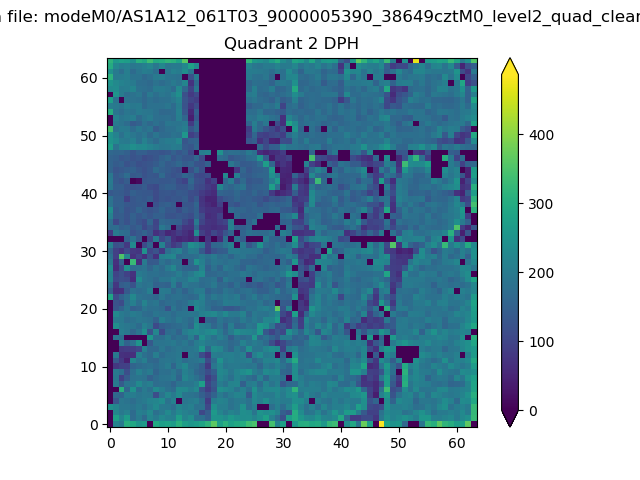 |
Quadrant C |
| Plot type | Count rate plots | Images |
|---|---|---|
| Comparison with Poisson distribution Blue bars denote a histogram of data divided into 1 sec bins. Red curve is a Poisson curve with rate = median count rate of data. |
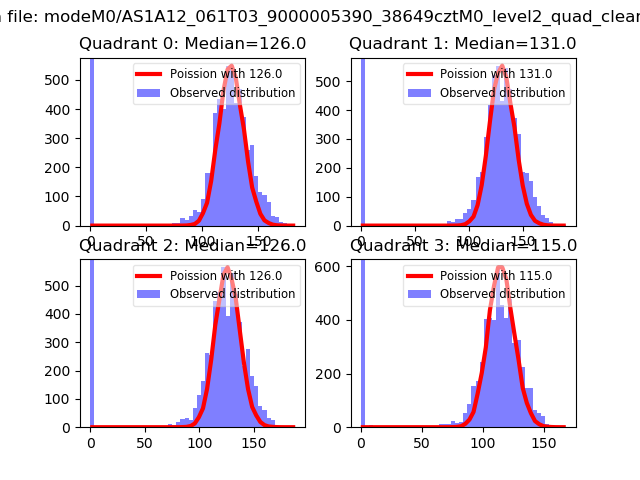 |
 |
| Quadrant-wise count rates Data is divided into 100 sec bins |
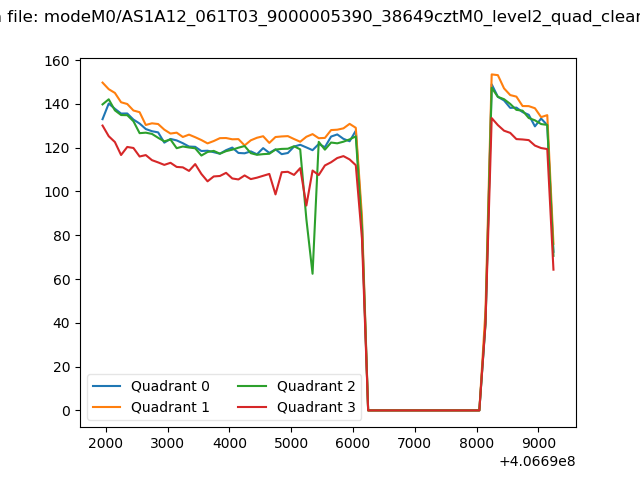 |
|
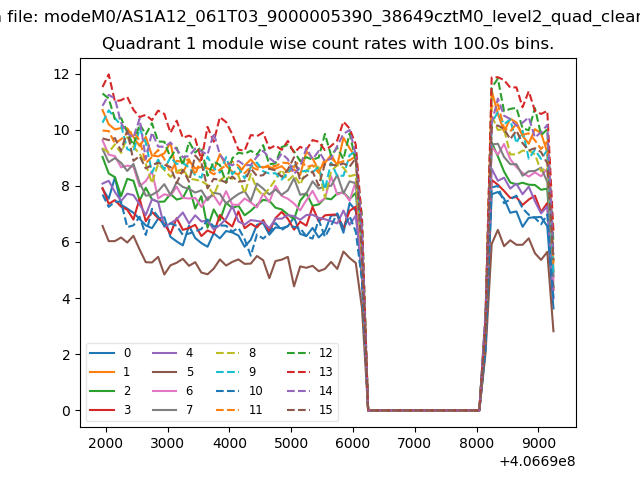
| Module-wise count rates for Quadrant A Data is divided into 100 sec bins |
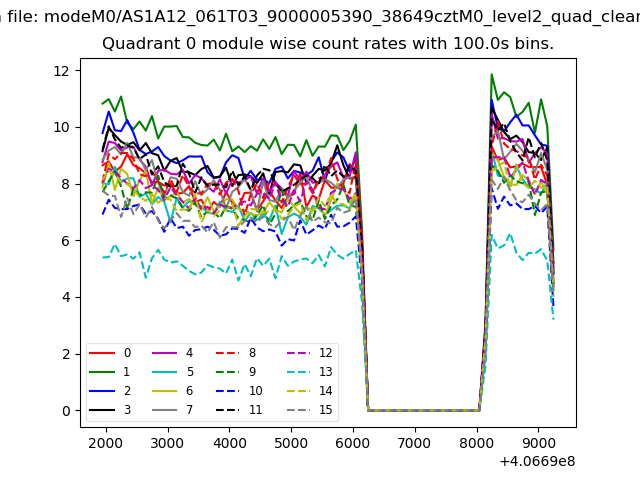 |
 |
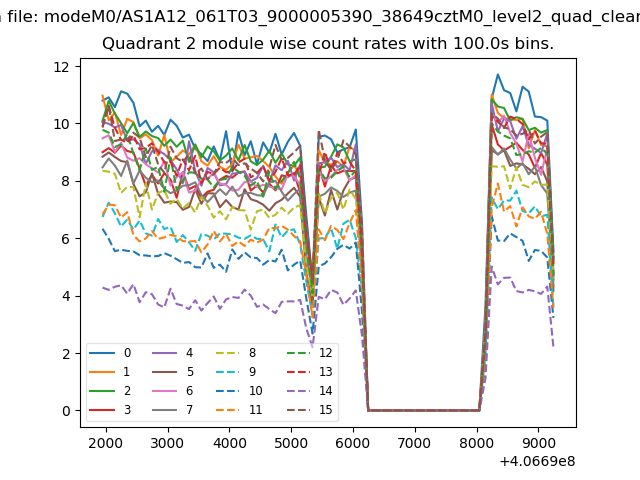
| Module-wise count rates for Quadrant B Data is divided into 100 sec bins |
 |
 |
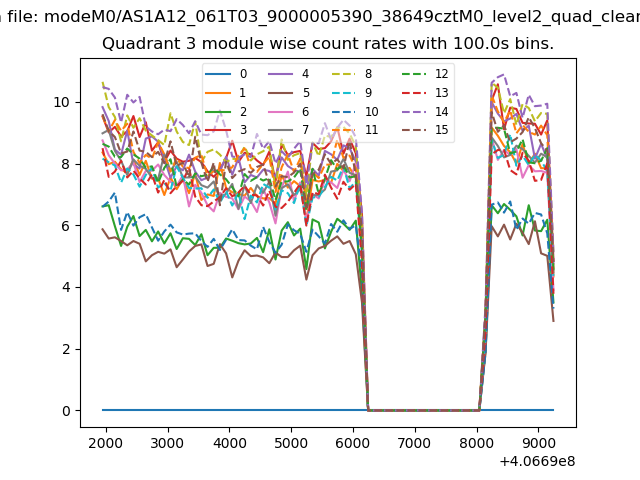
| Module-wise count rates for Quadrant C Data is divided into 100 sec bins |
 |
 |
| Module-wise count rates for Quadrant D Data is divided into 100 sec bins |
 |
 |
| Parameter | Plot |
|---|---|
| CZT HV Monitor | 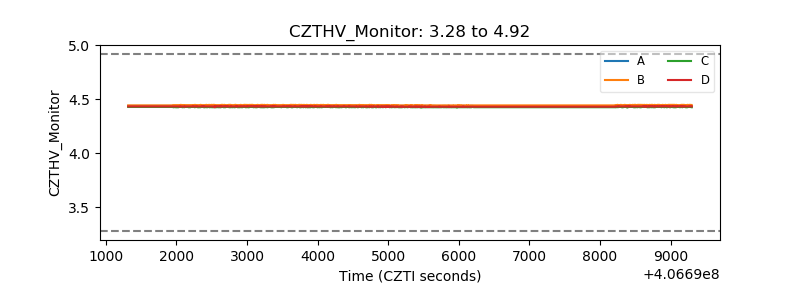 |
| D_VDD | 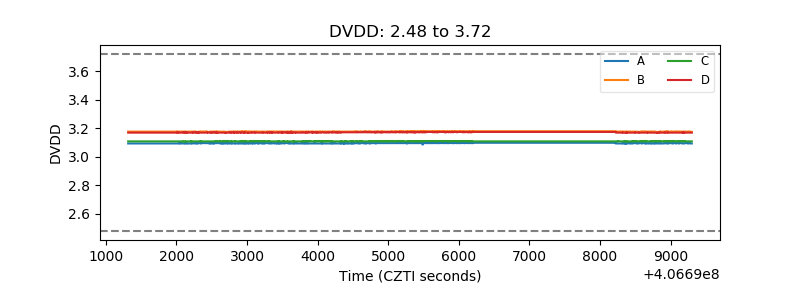 |
| Temperature 1 | 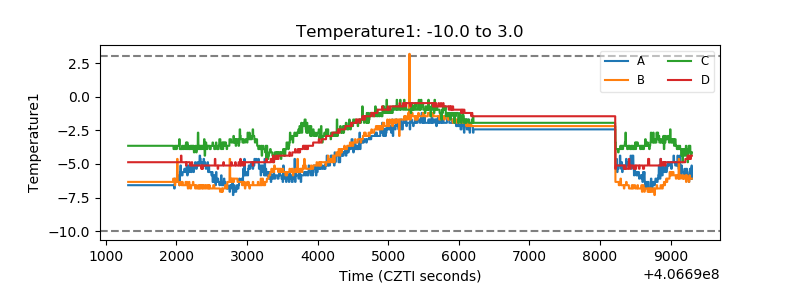 |
| Veto HV Monitor | 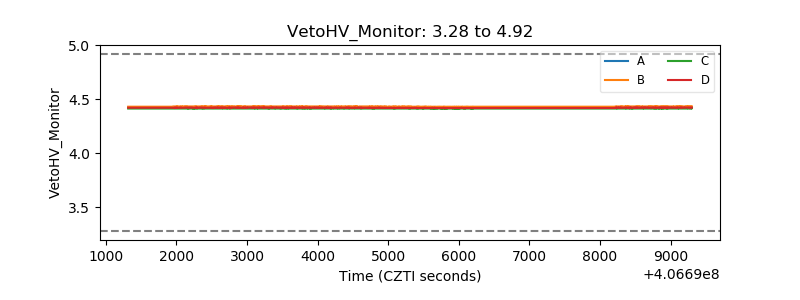 |
| Veto LLD | 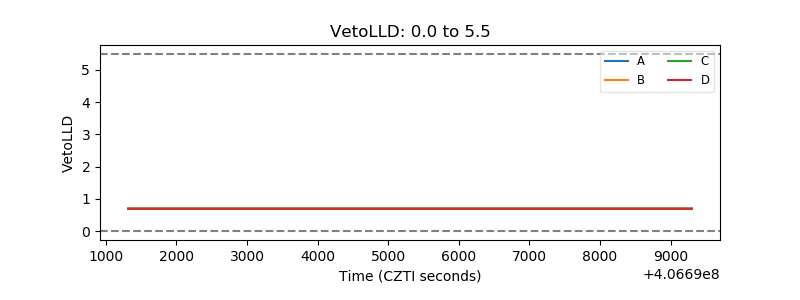 |
| Alpha Counter | 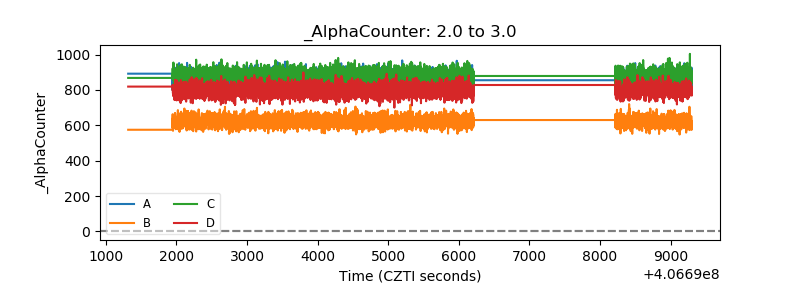 |
| _CPM_Rate | 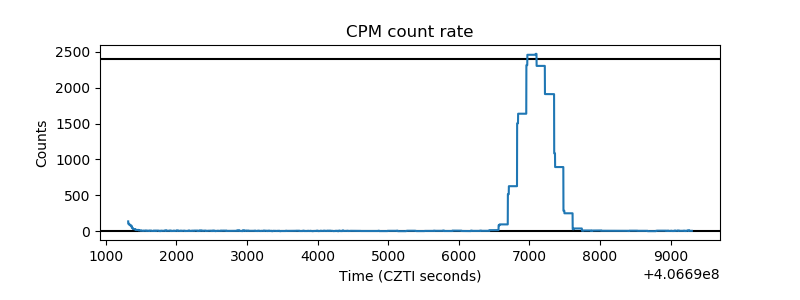 |
| CZT Counter | 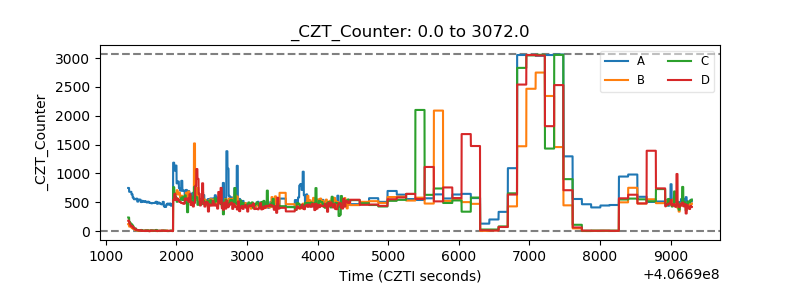 |
| +2.5 Volts monitor | 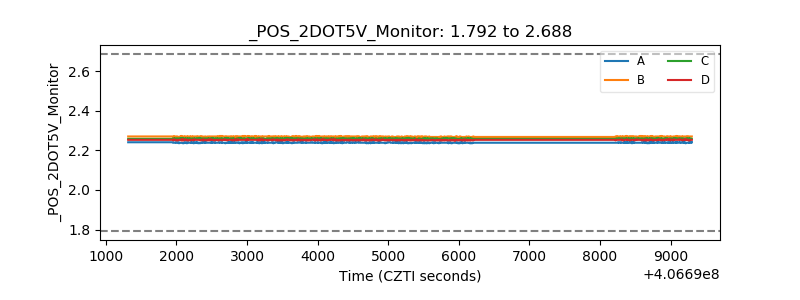 |
| +5 Volts monitor | 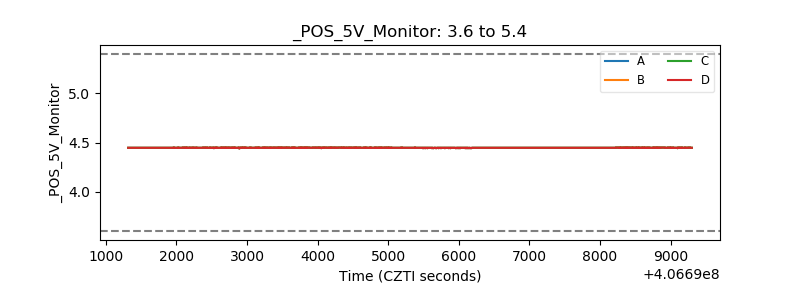 |
| _ROLL_ROT | 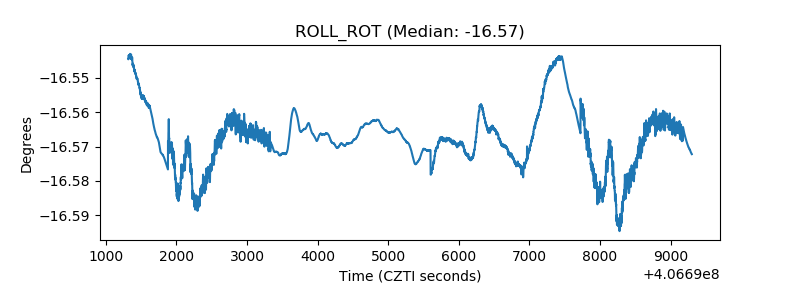 |
| _Roll_DEC | 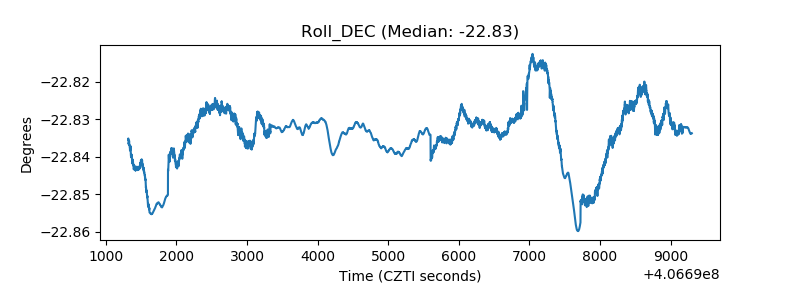 |
| _Roll_RA | 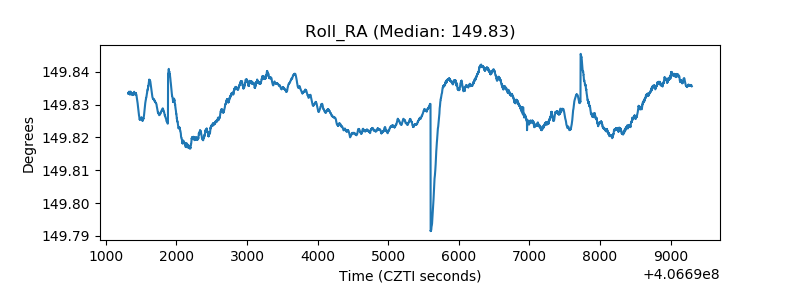 |
| Veto Counter | 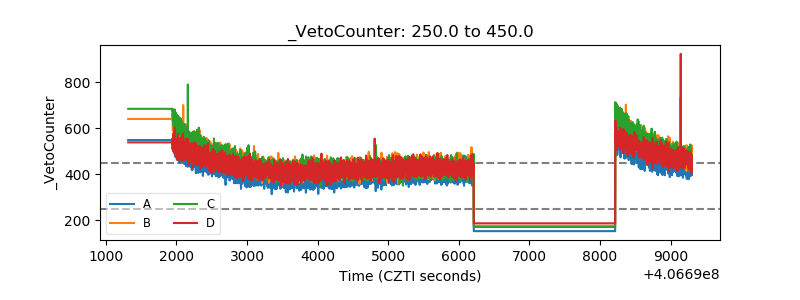 |