| Param | Original file | Final file |
|---|---|---|
| Filename | modeM0/AS1A12_061T03_9000005390_38650cztM0_level2.fits | modeM0/AS1A12_061T03_9000005390_38650cztM0_level2_quad_clean.evt |
| Size (bytes) | 363,971,520 | 97,796,160 |
| Size | 347.1 MB | 93.3 MB |
| Events in quadrant A | 3,750,879 | 638,499 |
| Events in quadrant B | 2,784,732 | 695,420 |
| Events in quadrant C | 3,249,849 | 659,385 |
| Events in quadrant D | 3,282,507 | 603,524 |
| Mode SS | |||
|---|---|---|---|
| Quadrant | BADHDUFLAG | Total packets | Discarded packets |
| A | 0 | 106 | 0 |
| B | 0 | 106 | 0 |
| C | 0 | 106 | 0 |
| D | 0 | 106 | 0 |
| Mode M9 | |||
|---|---|---|---|
| Quadrant | BADHDUFLAG | Total packets | Discarded packets |
| A | 0 | 30 | 0 |
| B | 0 | 30 | 0 |
| C | 0 | 30 | 0 |
| D | 0 | 31 | 0 |
| Mode M0 | |||
|---|---|---|---|
| Quadrant | BADHDUFLAG | Total packets | Discarded packets |
| A | 0 | 14460 | 3 |
| B | 0 | 11344 | 2 |
| C | 0 | 12640 | 2 |
| D | 0 | 13030 | 2 |
| Quadrant | Total seconds | Saturated seconds | Saturation percentage |
|---|---|---|---|
| A | 5207 | 310 | 5.953524% |
| B | 5207 | 12 | 0.230459% |
| C | 5207 | 125 | 2.400615% |
| D | 5207 | 111 | 2.131746% |
Noise dominated data is calculated using 1-second bins in cleaned event files. If a bin has >2000 counts, and if more than 50% of those come from <1% of pixels, then it is considered to be noise-dominated and hence unusable.
| Quadrant | # 1 sec bins | Bins with >0 counts | Bins with >2000 counts | High rate bins dominated by noise | Noise dominated (total time) | Noise dominated (detector-on time) | Marked lightcurve |
|---|---|---|---|---|---|---|---|
| A | 7299 | 5207 | 192 | 192 | 2.63% | 3.69% | 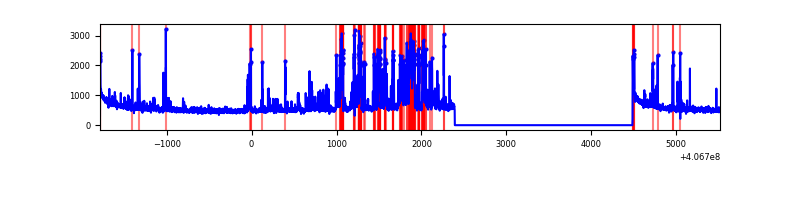 |
| B | 7299 | 5207 | 4 | 4 | 0.05% | 0.08% | 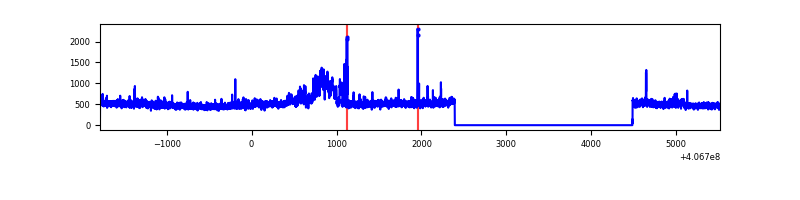 |
| C | 7299 | 5207 | 117 | 117 | 1.60% | 2.25% | 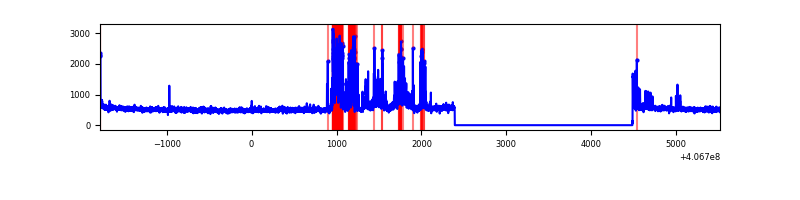 |
| D | 7299 | 5207 | 93 | 93 | 1.27% | 1.79% | 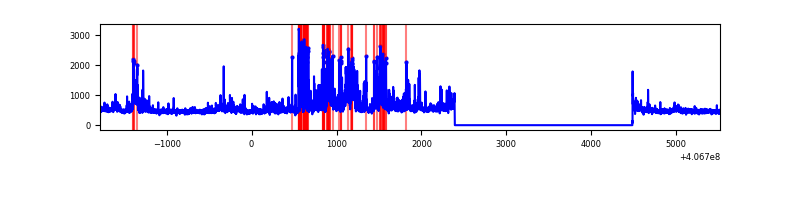 |
Top three noisy pixels from each quadrant. If the there are fewer than three noisy pixels in the level2.evt file, extra rows are filled as -1
| Pixel properties | Quadrant properties | ||||||
|---|---|---|---|---|---|---|---|
| Quadrant | DetID | PixID | Counts | Sigma | Mean | Median | Sigma |
| A | 9 | 143 | 870518 | 7055.59 | 613 | 602 | 123.3 |
| A | 10 | 83 | 403053 | 3264.14 | 613 | 602 | 123.3 |
| A | 7 | 3 | 56955 | 457.06 | 613 | 602 | 123.3 |
| B | 5 | 184 | 235764 | 1986.59 | 628 | 613 | 118.4 |
| B | 0 | 155 | 29398 | 243.18 | 628 | 613 | 118.4 |
| B | 15 | 85 | 16848 | 137.16 | 628 | 613 | 118.4 |
| C | 14 | 254 | 577306 | 4002.86 | 622 | 628 | 144.1 |
| C | 15 | 214 | 210109 | 1454.06 | 622 | 628 | 144.1 |
| C | 0 | 10 | 16728 | 111.75 | 622 | 628 | 144.1 |
| D | 14 | 52 | 327427 | 2157.57 | 621 | 606 | 151.5 |
| D | 2 | 249 | 231283 | 1522.86 | 621 | 606 | 151.5 |
| D | 5 | 222 | 121133 | 795.68 | 621 | 606 | 151.5 |
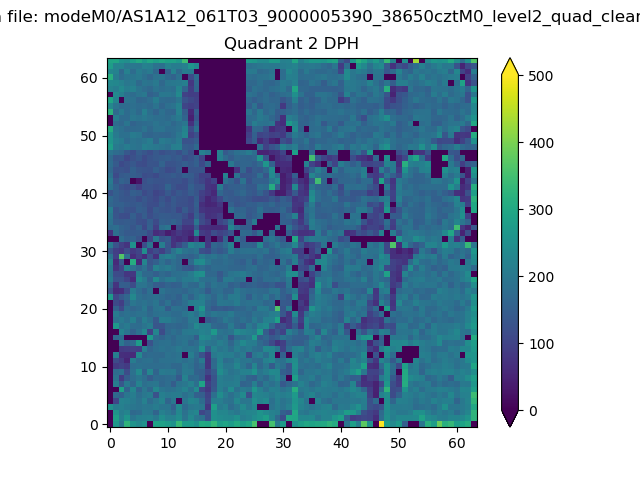
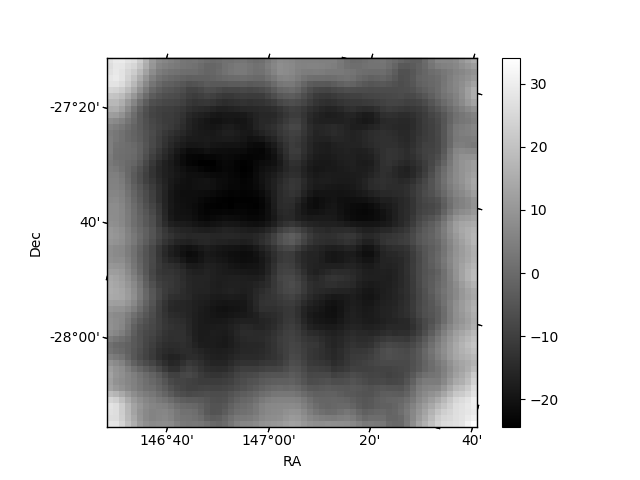
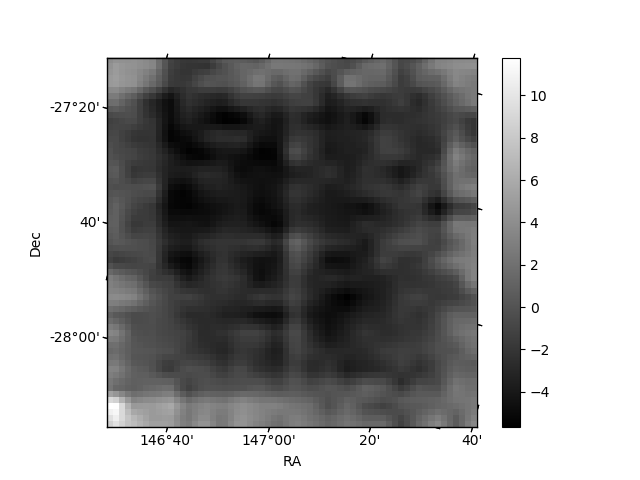
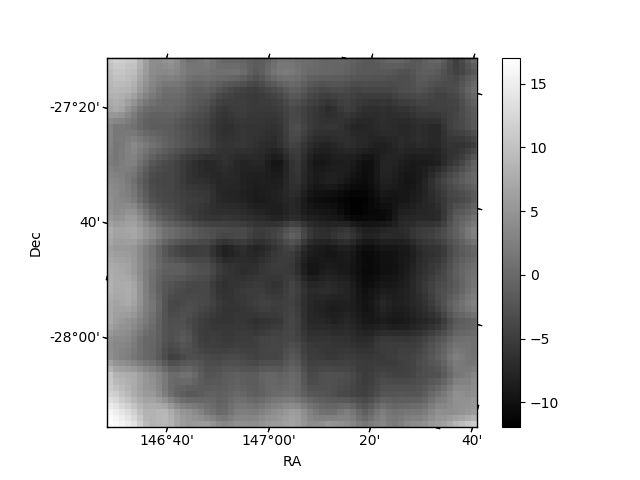
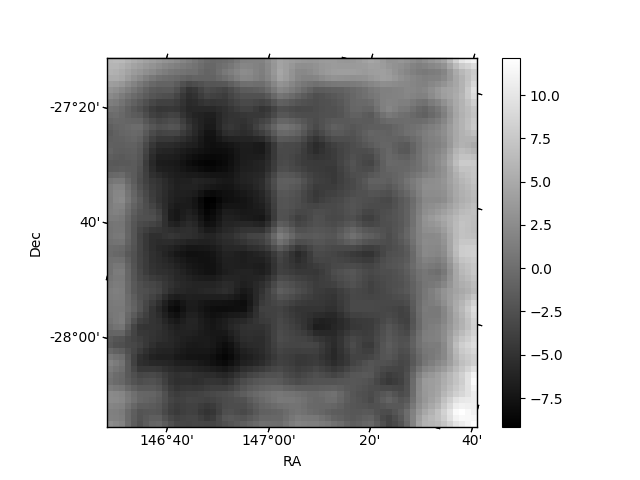
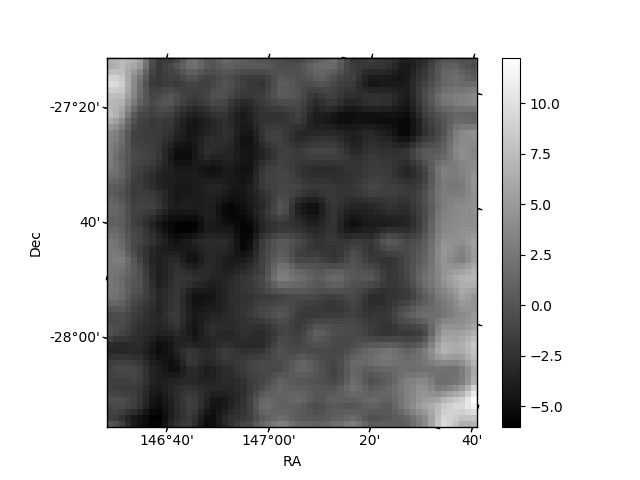
Histogram calculated using DETX and DETY for each event in the final _common_clean file
| Quadrant A | 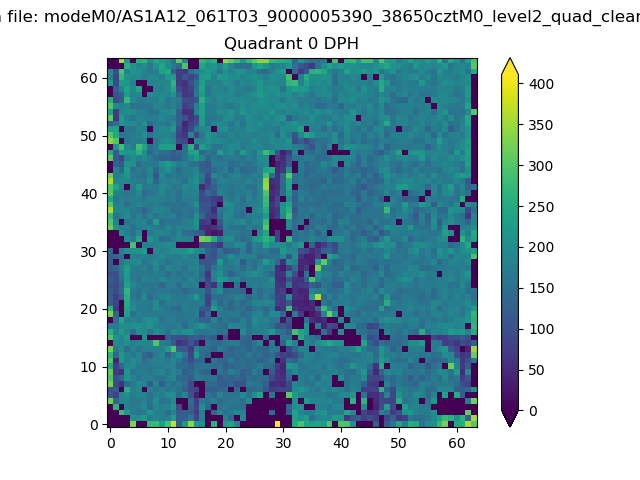 |
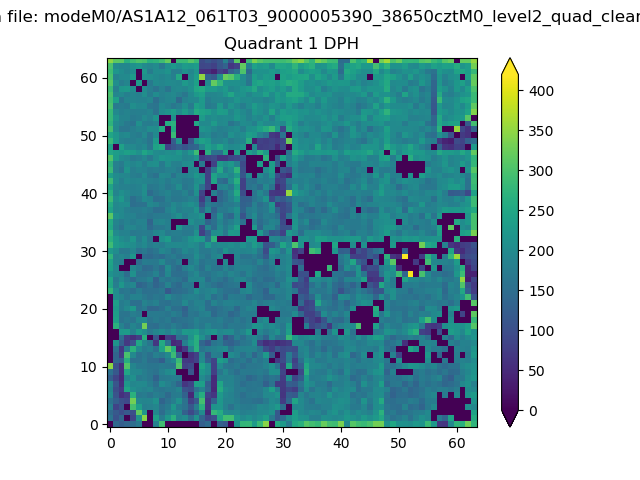 |
Quadrant B |
|---|---|---|---|
| Quadrant D | 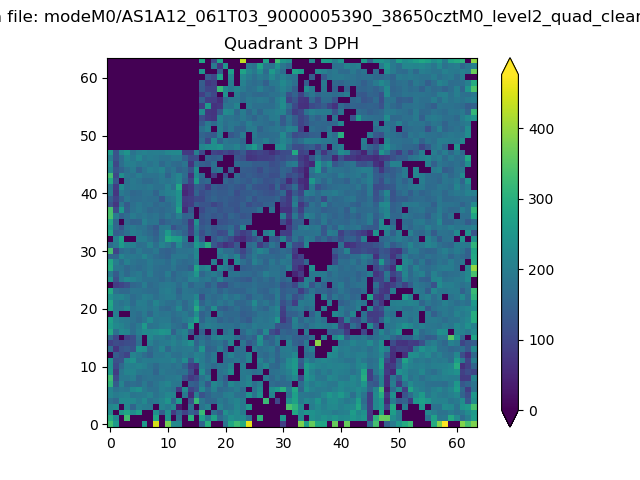 |
 |
Quadrant C |
| Plot type | Count rate plots | Images |
|---|---|---|
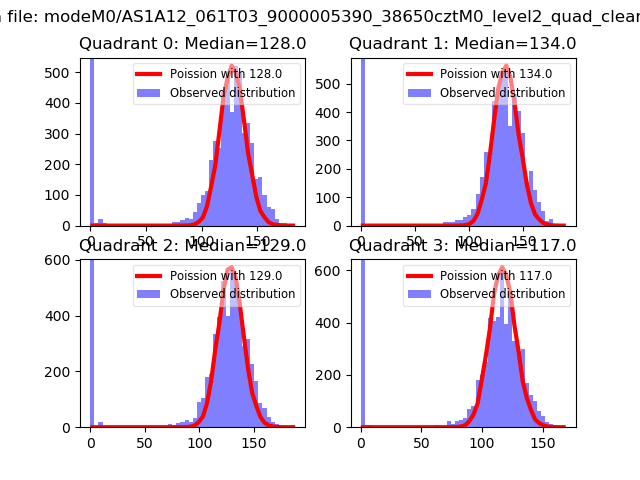
| Comparison with Poisson distribution Blue bars denote a histogram of data divided into 1 sec bins. Red curve is a Poisson curve with rate = median count rate of data. |
 |
 |
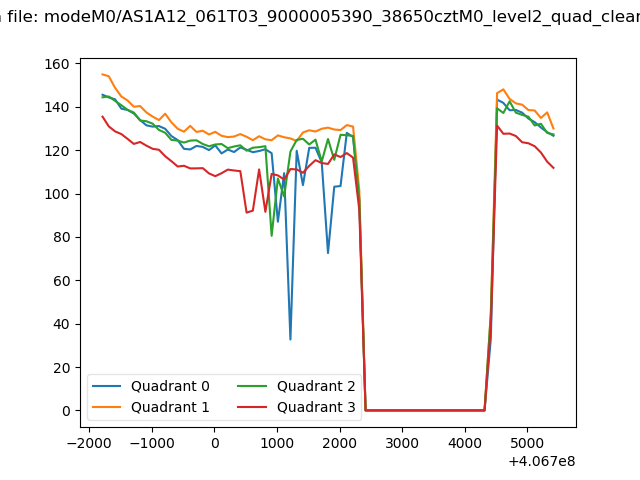
| Quadrant-wise count rates Data is divided into 100 sec bins |
 |
|
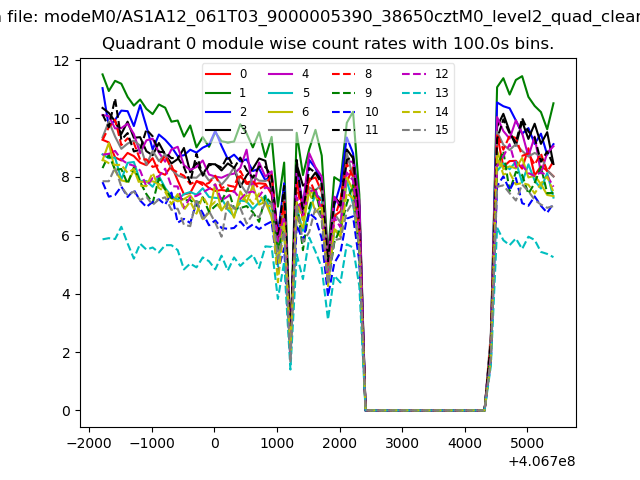
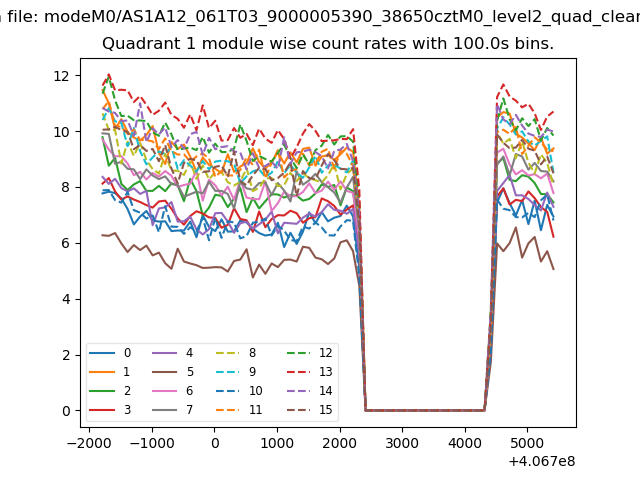
| Module-wise count rates for Quadrant A Data is divided into 100 sec bins |
 |
 |
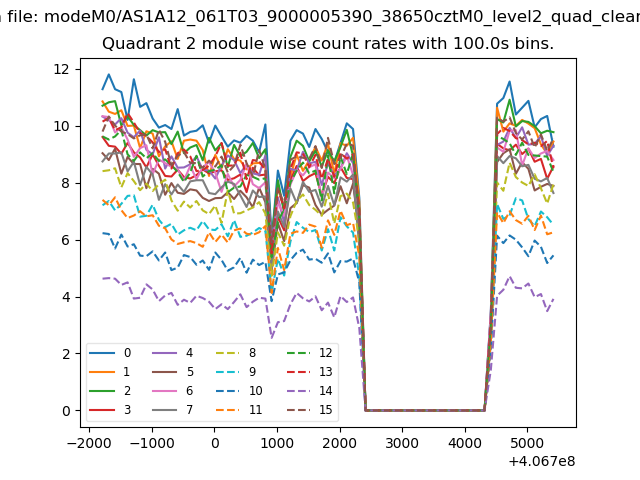
| Module-wise count rates for Quadrant B Data is divided into 100 sec bins |
 |
 |
| Module-wise count rates for Quadrant C Data is divided into 100 sec bins |
 |
 |
| Module-wise count rates for Quadrant D Data is divided into 100 sec bins |
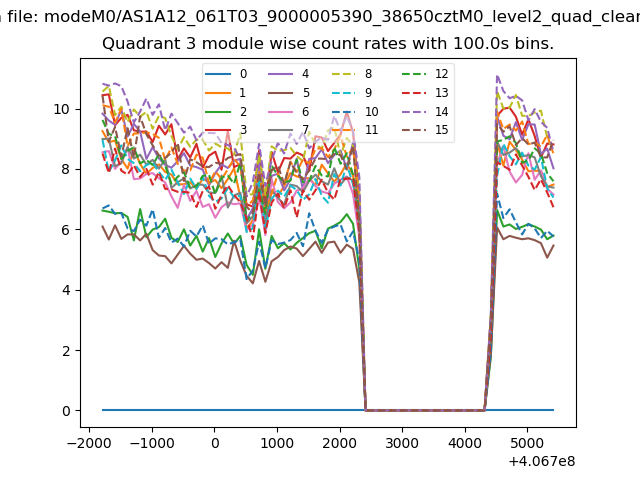 |
 |
| Parameter | Plot |
|---|---|
| CZT HV Monitor | 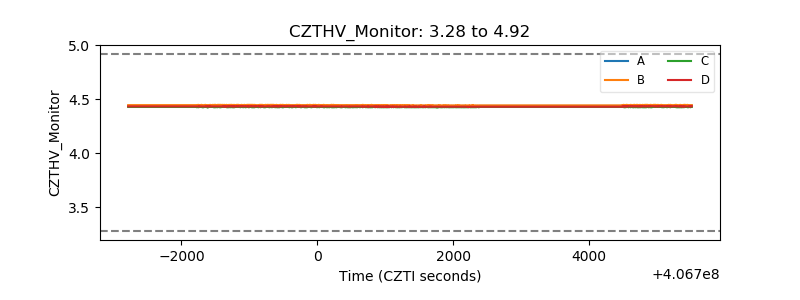 |
| D_VDD | 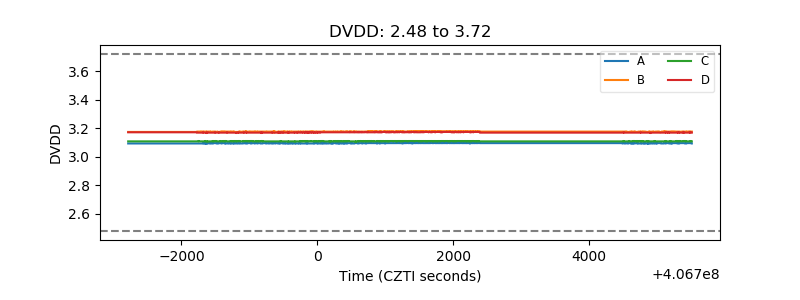 |
| Temperature 1 | 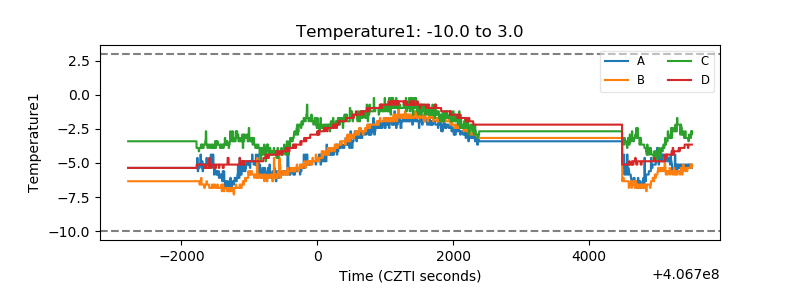 |
| Veto HV Monitor | 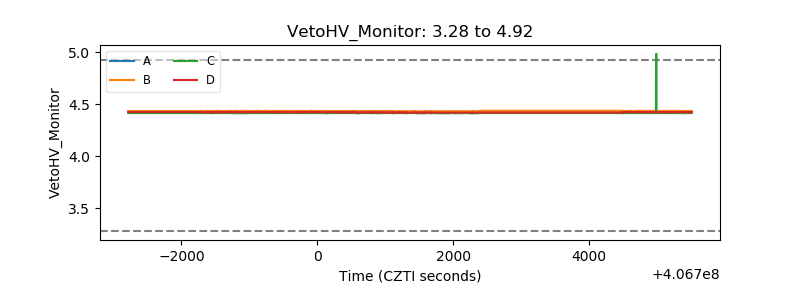 |
| Veto LLD | 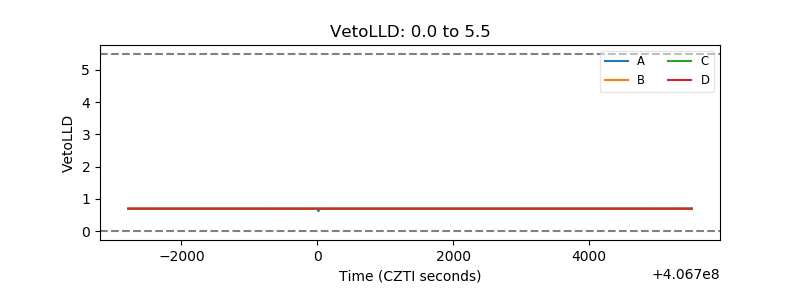 |
| Alpha Counter | 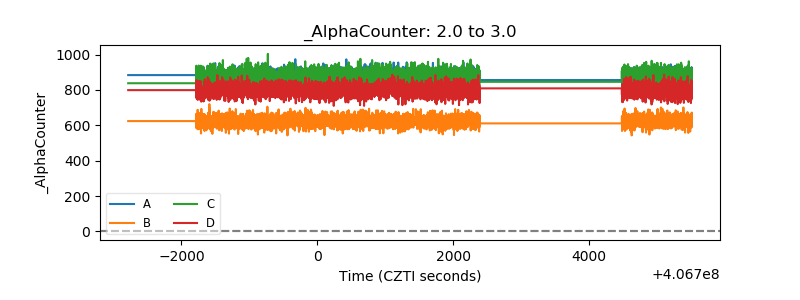 |
| _CPM_Rate | 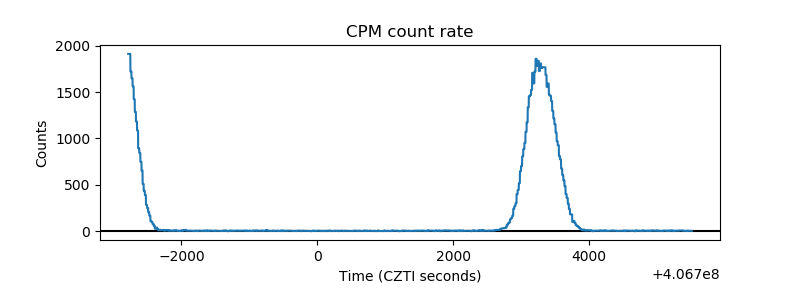 |
| CZT Counter | 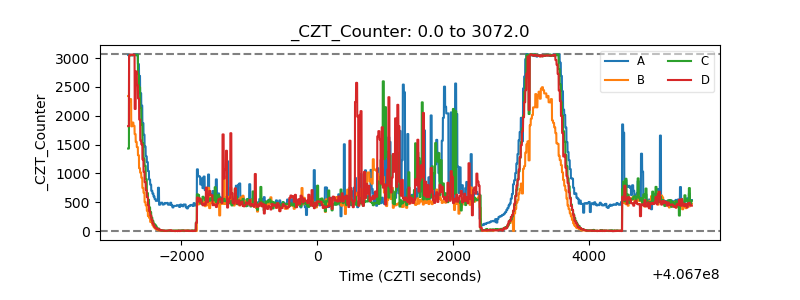 |
| +2.5 Volts monitor | 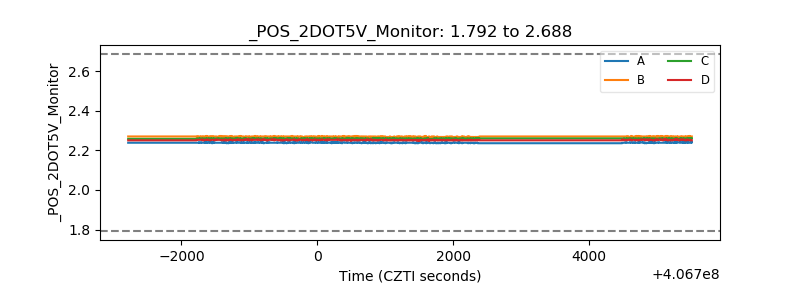 |
| +5 Volts monitor | 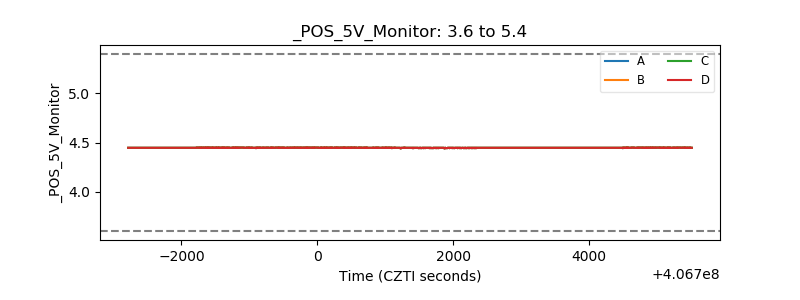 |
| _ROLL_ROT | 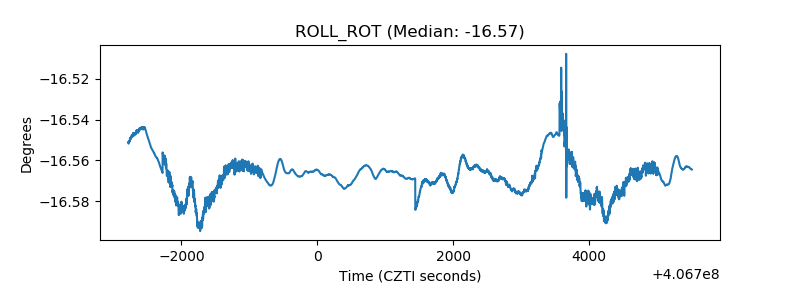 |
| _Roll_DEC | 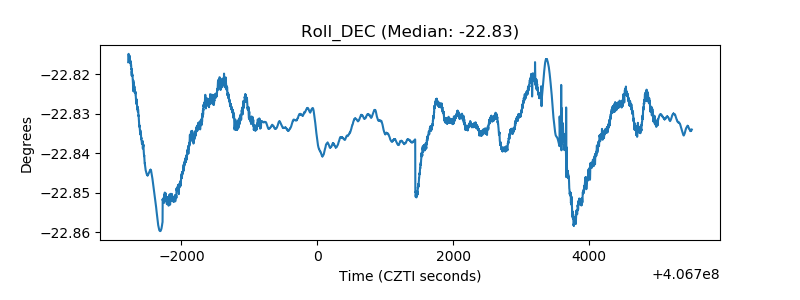 |
| _Roll_RA | 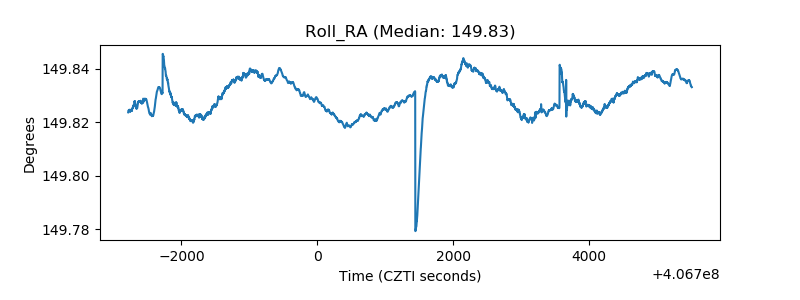 |
| Veto Counter | 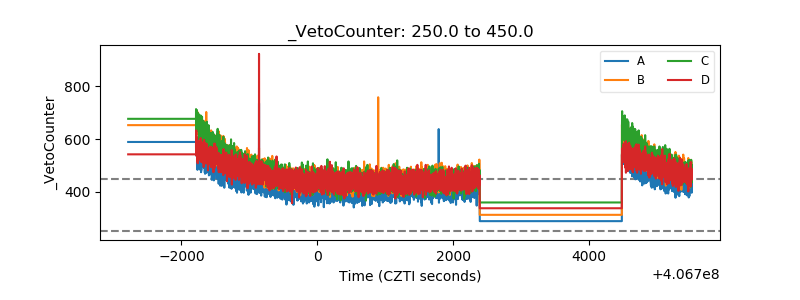 |