| Param | Original file | Final file |
|---|---|---|
| Filename | modeM0/AS1A12_061T03_9000005390_38651cztM0_level2.fits | modeM0/AS1A12_061T03_9000005390_38651cztM0_level2_quad_clean.evt |
| Size (bytes) | 298,825,920 | 92,635,200 |
| Size | 285.0 MB | 88.3 MB |
| Events in quadrant A | 3,068,618 | 623,450 |
| Events in quadrant B | 2,482,136 | 643,717 |
| Events in quadrant C | 2,592,548 | 620,315 |
| Events in quadrant D | 2,532,891 | 571,393 |
| Mode SS | |||
|---|---|---|---|
| Quadrant | BADHDUFLAG | Total packets | Discarded packets |
| A | 0 | 100 | 0 |
| B | 0 | 100 | 0 |
| C | 0 | 100 | 0 |
| D | 0 | 100 | 0 |
| Mode M9 | |||
|---|---|---|---|
| Quadrant | BADHDUFLAG | Total packets | Discarded packets |
| A | 0 | 22 | 0 |
| B | 0 | 22 | 0 |
| C | 0 | 22 | 0 |
| D | 0 | 22 | 0 |
| Mode M0 | |||
|---|---|---|---|
| Quadrant | BADHDUFLAG | Total packets | Discarded packets |
| A | 0 | 12126 | 3 |
| B | 0 | 10381 | 2 |
| C | 0 | 10373 | 2 |
| D | 0 | 10520 | 2 |
| Quadrant | Total seconds | Saturated seconds | Saturation percentage |
|---|---|---|---|
| A | 4943 | 59 | 1.193607% |
| B | 4943 | 25 | 0.505766% |
| C | 4943 | 6 | 0.121384% |
| D | 4944 | 14 | 0.283172% |
Noise dominated data is calculated using 1-second bins in cleaned event files. If a bin has >2000 counts, and if more than 50% of those come from <1% of pixels, then it is considered to be noise-dominated and hence unusable.
| Quadrant | # 1 sec bins | Bins with >0 counts | Bins with >2000 counts | High rate bins dominated by noise | Noise dominated (total time) | Noise dominated (detector-on time) | Marked lightcurve |
|---|---|---|---|---|---|---|---|
| A | 7096 | 4944 | 37 | 37 | 0.52% | 0.75% | 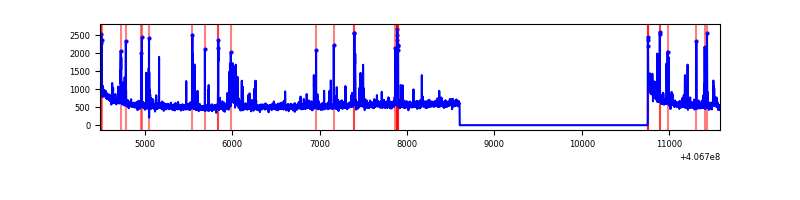 |
| B | 7096 | 4944 | 17 | 17 | 0.24% | 0.34% | 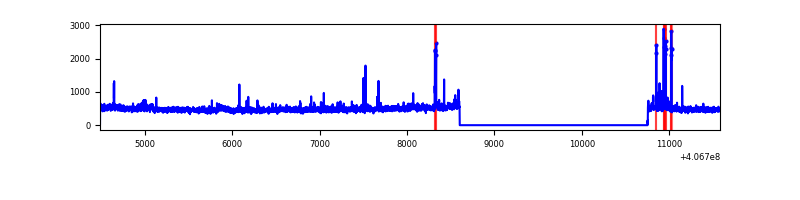 |
| C | 7096 | 4944 | 4 | 4 | 0.06% | 0.08% | 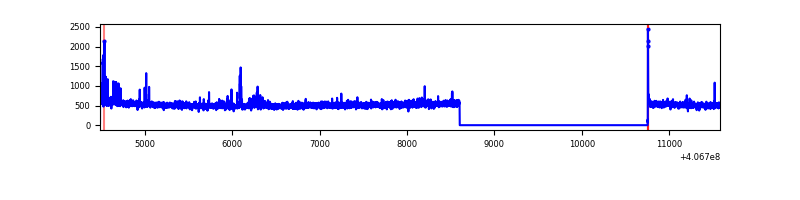 |
| D | 7097 | 4945 | 8 | 8 | 0.11% | 0.16% | 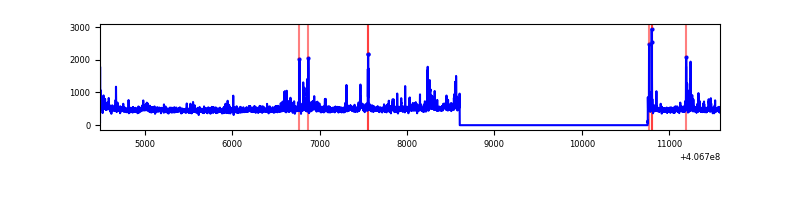 |
Top three noisy pixels from each quadrant. If the there are fewer than three noisy pixels in the level2.evt file, extra rows are filled as -1
| Pixel properties | Quadrant properties | ||||||
|---|---|---|---|---|---|---|---|
| Quadrant | DetID | PixID | Counts | Sigma | Mean | Median | Sigma |
| A | 10 | 83 | 404083 | 3359.55 | 596 | 585 | 120.1 |
| A | 9 | 143 | 233719 | 1941.09 | 596 | 585 | 120.1 |
| A | 13 | 248 | 75437 | 623.22 | 596 | 585 | 120.1 |
| B | 5 | 184 | 37673 | 327.4 | 591 | 575 | 113.3 |
| B | 5 | 200 | 34369 | 298.24 | 591 | 575 | 113.3 |
| B | 0 | 186 | 28095 | 242.87 | 591 | 575 | 113.3 |
| C | 15 | 214 | 203392 | 1487.81 | 588 | 594 | 136.3 |
| C | 14 | 254 | 43530 | 315.0 | 588 | 594 | 136.3 |
| C | 3 | 110 | 21719 | 154.98 | 588 | 594 | 136.3 |
| D | 5 | 222 | 76480 | 532.2 | 589 | 576 | 142.6 |
| D | 2 | 234 | 28736 | 197.44 | 589 | 576 | 142.6 |
| D | 12 | 233 | 27024 | 185.44 | 589 | 576 | 142.6 |
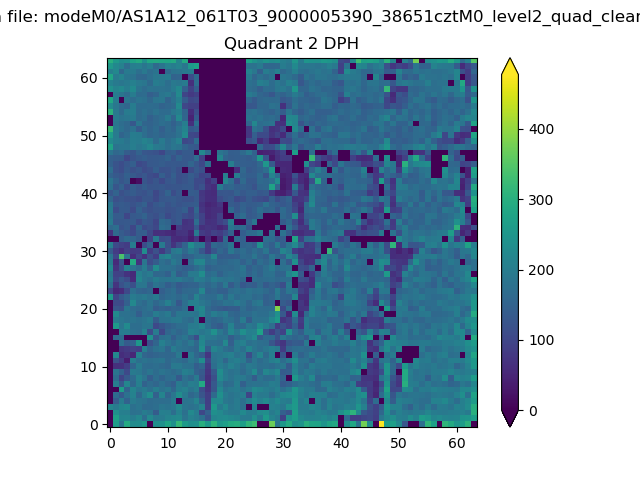
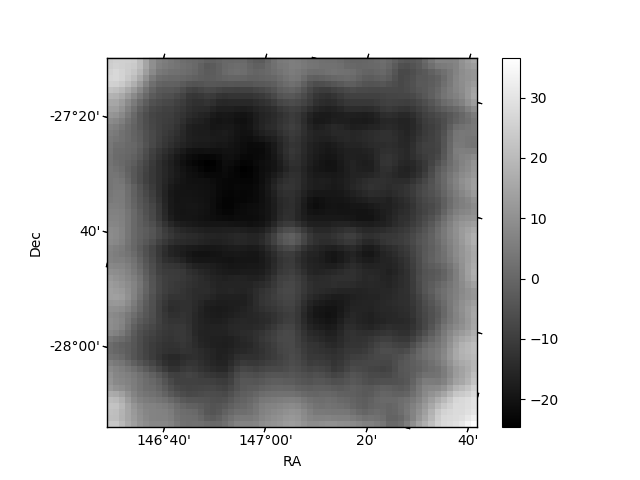
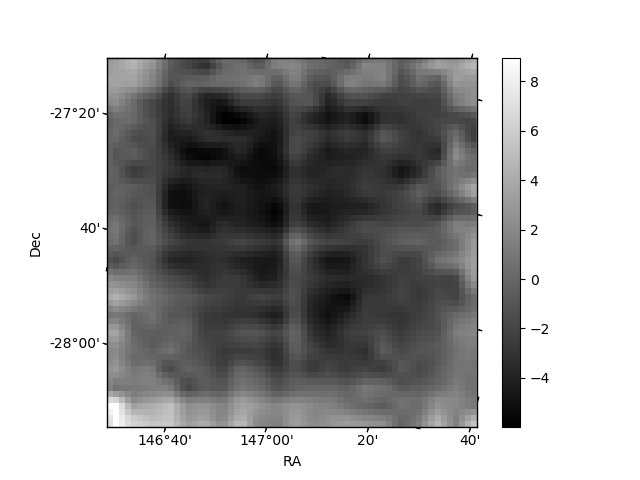
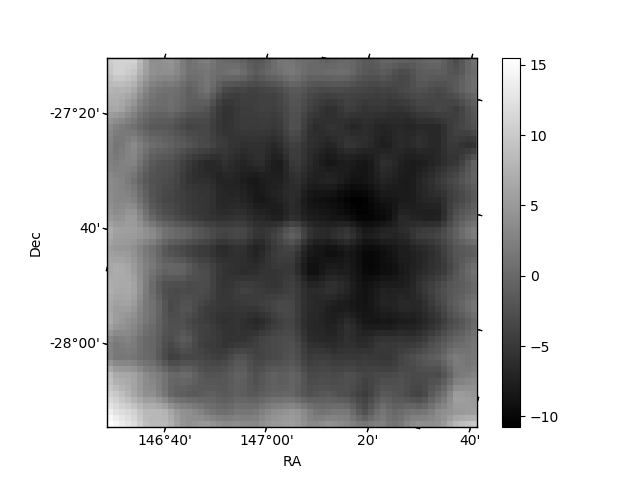
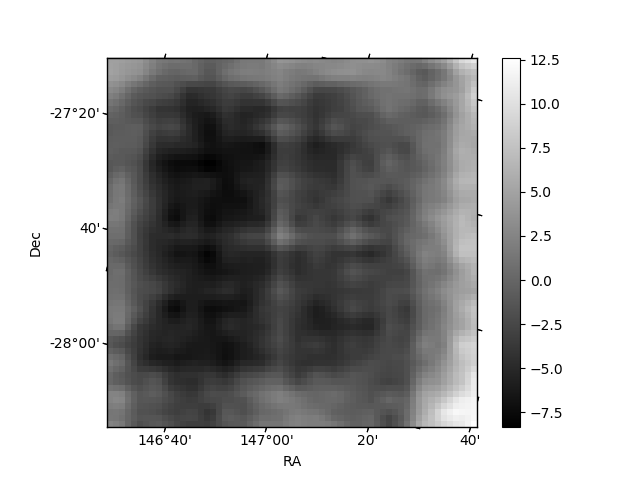
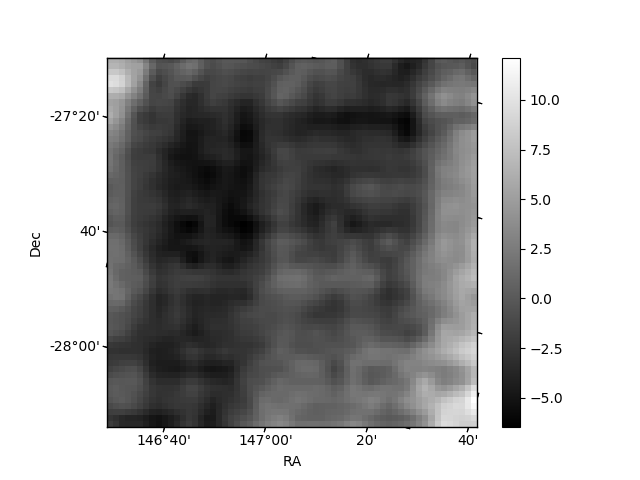
Histogram calculated using DETX and DETY for each event in the final _common_clean file
| Quadrant A | 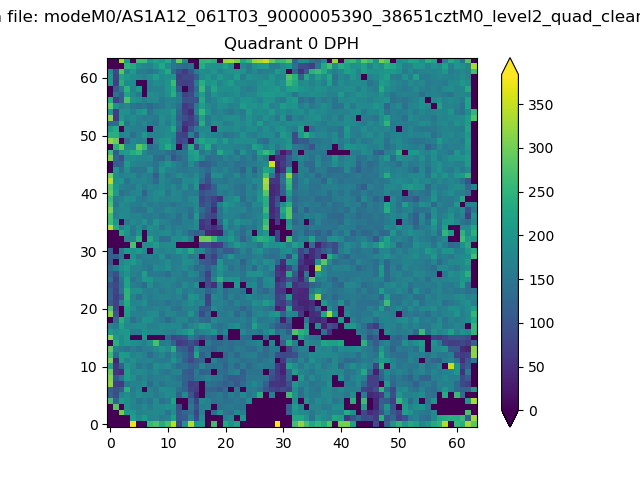 |
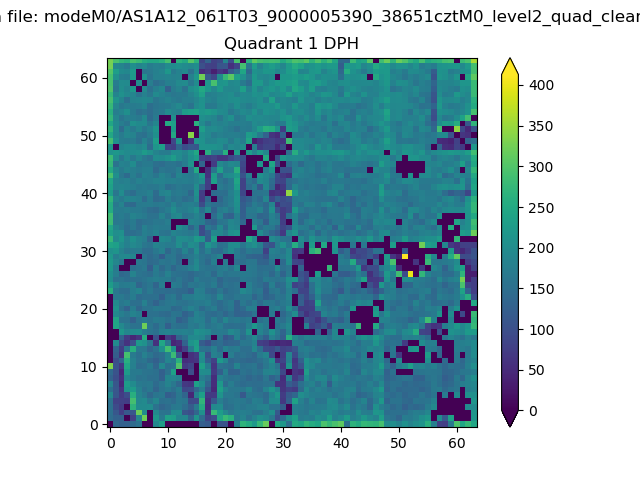 |
Quadrant B |
|---|---|---|---|
| Quadrant D | 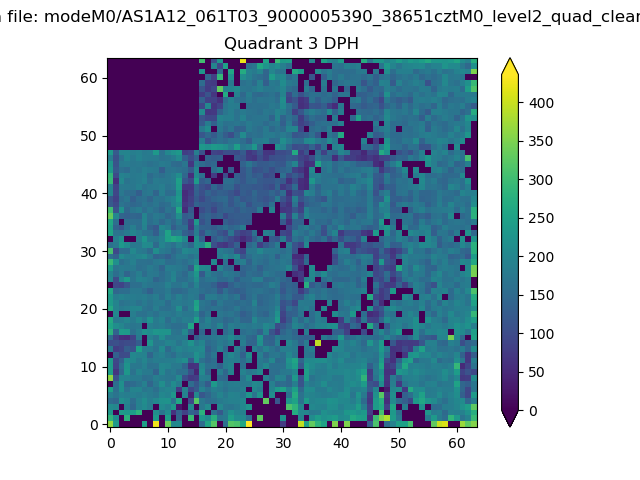 |
 |
Quadrant C |
| Plot type | Count rate plots | Images |
|---|---|---|
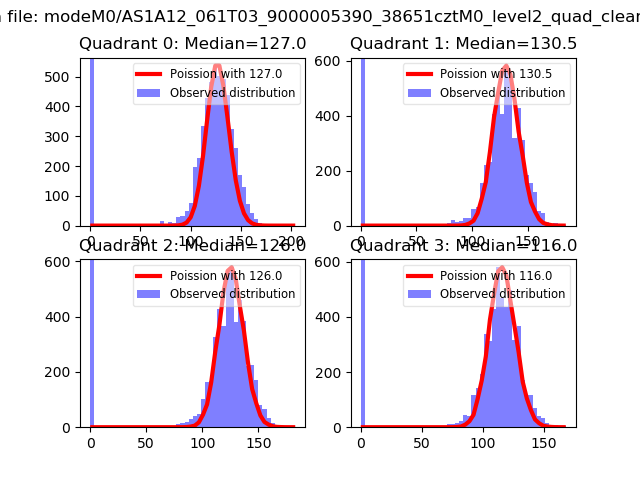
| Comparison with Poisson distribution Blue bars denote a histogram of data divided into 1 sec bins. Red curve is a Poisson curve with rate = median count rate of data. |
 |
 |
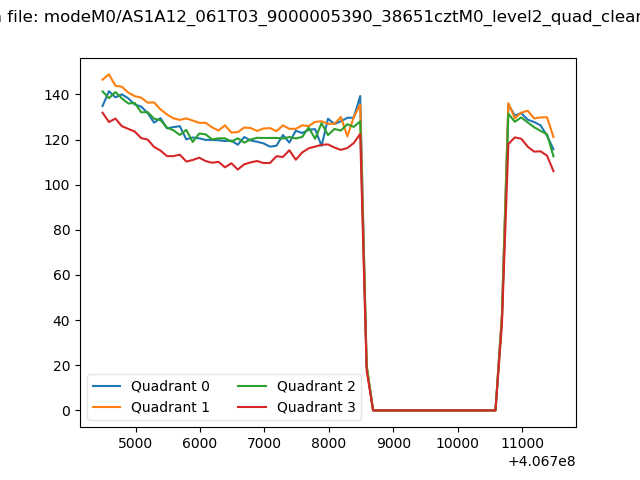
| Quadrant-wise count rates Data is divided into 100 sec bins |
 |
|
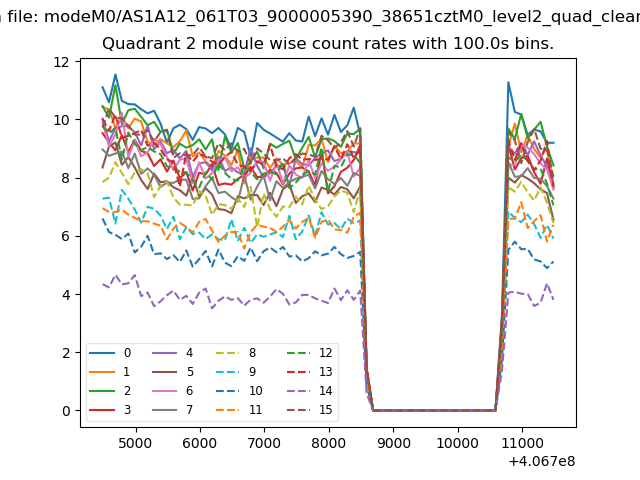
| Module-wise count rates for Quadrant A Data is divided into 100 sec bins |
 |
 |
| Module-wise count rates for Quadrant B Data is divided into 100 sec bins |
 |
 |
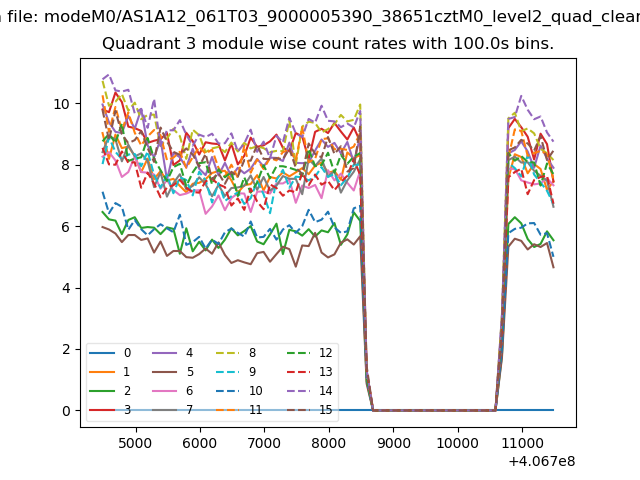
| Module-wise count rates for Quadrant C Data is divided into 100 sec bins |
 |
 |
| Module-wise count rates for Quadrant D Data is divided into 100 sec bins |
 |
 |
| Parameter | Plot |
|---|---|
| CZT HV Monitor | 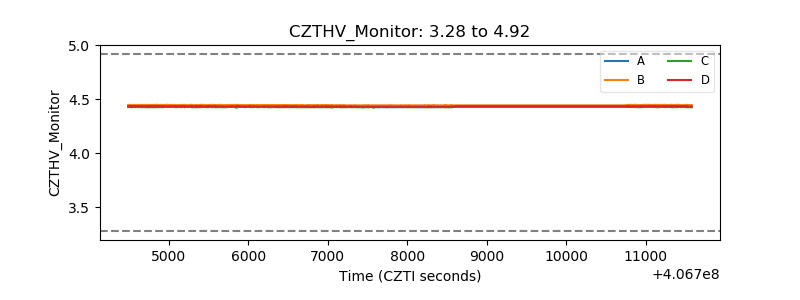 |
| D_VDD | 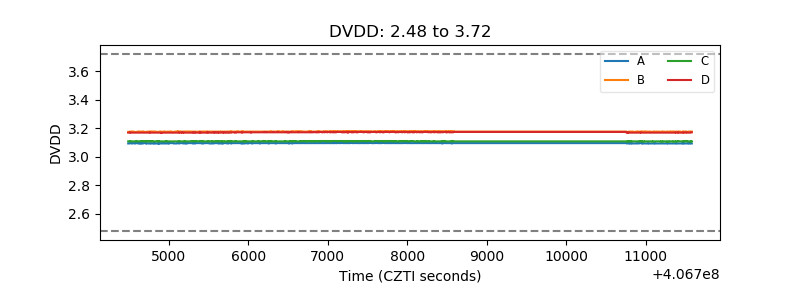 |
| Temperature 1 | 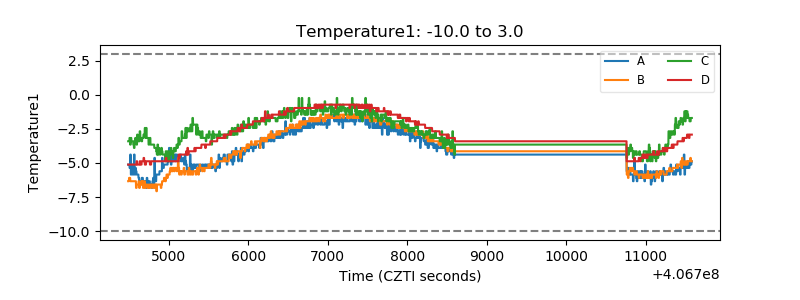 |
| Veto HV Monitor | 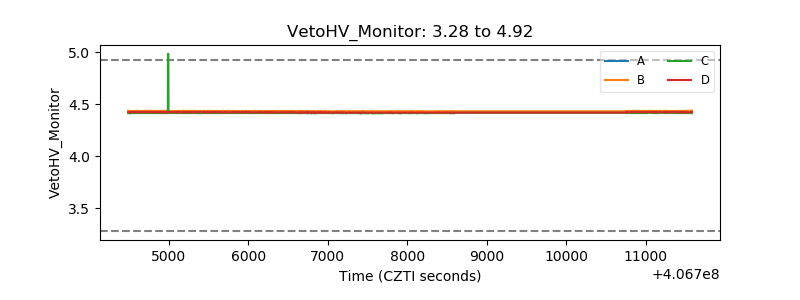 |
| Veto LLD | 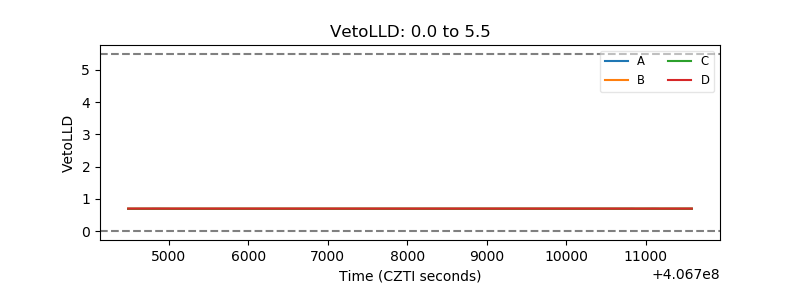 |
| Alpha Counter | 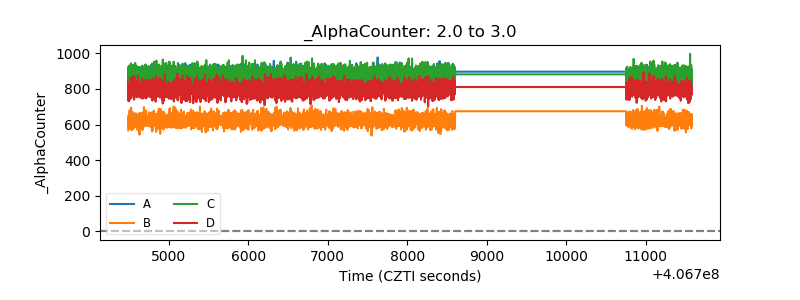 |
| _CPM_Rate | 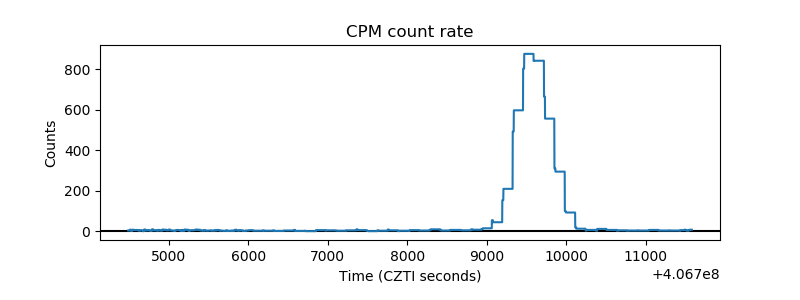 |
| CZT Counter | 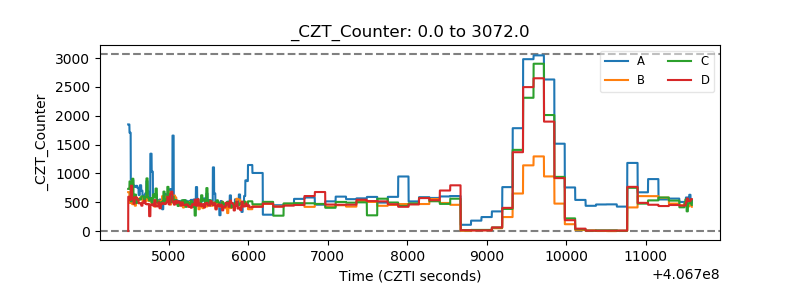 |
| +2.5 Volts monitor | 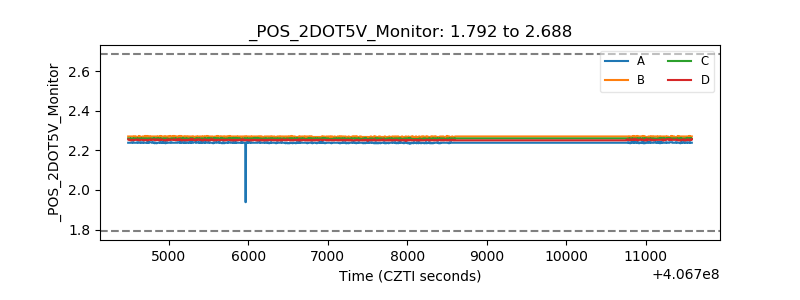 |
| +5 Volts monitor | 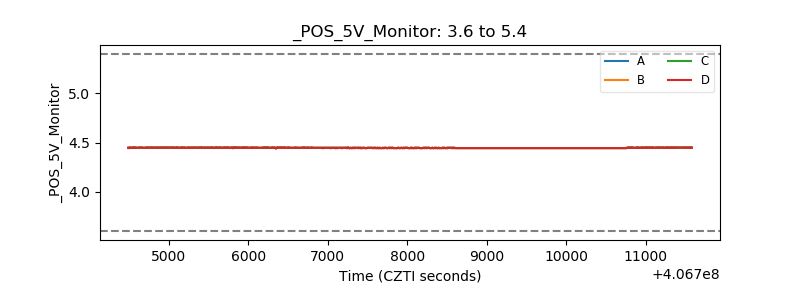 |
| _ROLL_ROT | 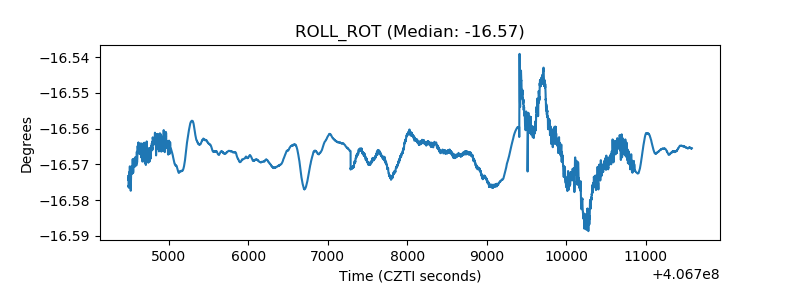 |
| _Roll_DEC |  |
| _Roll_RA | 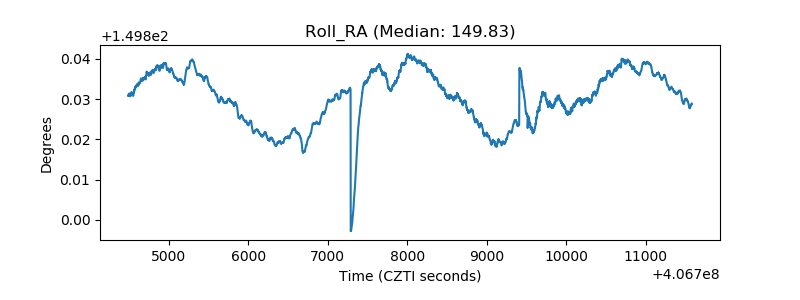 |
| Veto Counter | 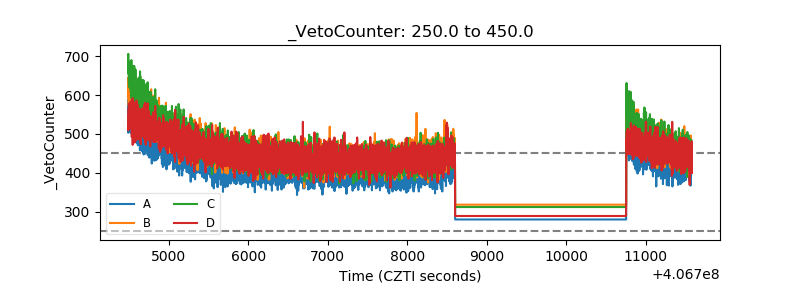 |