| Param | Original file | Final file |
|---|---|---|
| Filename | modeM0/AS1A12_061T03_9000005390_38652cztM0_level2.fits | modeM0/AS1A12_061T03_9000005390_38652cztM0_level2_quad_clean.evt |
| Size (bytes) | 309,144,960 | 89,101,440 |
| Size | 294.8 MB | 85.0 MB |
| Events in quadrant A | 3,121,036 | 593,891 |
| Events in quadrant B | 2,494,230 | 615,532 |
| Events in quadrant C | 2,513,169 | 594,652 |
| Events in quadrant D | 2,928,419 | 546,157 |
| Mode SS | |||
|---|---|---|---|
| Quadrant | BADHDUFLAG | Total packets | Discarded packets |
| A | 0 | 100 | 0 |
| B | 0 | 100 | 0 |
| C | 0 | 100 | 0 |
| D | 0 | 100 | 0 |
| Mode M9 | |||
|---|---|---|---|
| Quadrant | BADHDUFLAG | Total packets | Discarded packets |
| A | 0 | 24 | 0 |
| B | 0 | 24 | 0 |
| C | 0 | 24 | 0 |
| D | 0 | 25 | 0 |
| Mode M0 | |||
|---|---|---|---|
| Quadrant | BADHDUFLAG | Total packets | Discarded packets |
| A | 0 | 12216 | 3 |
| B | 0 | 10444 | 2 |
| C | 0 | 10166 | 2 |
| D | 0 | 11839 | 2 |
| Quadrant | Total seconds | Saturated seconds | Saturation percentage |
|---|---|---|---|
| A | 4963 | 81 | 1.632077% |
| B | 4963 | 24 | 0.483578% |
| C | 4963 | 9 | 0.181342% |
| D | 4963 | 33 | 0.664920% |
Noise dominated data is calculated using 1-second bins in cleaned event files. If a bin has >2000 counts, and if more than 50% of those come from <1% of pixels, then it is considered to be noise-dominated and hence unusable.
| Quadrant | # 1 sec bins | Bins with >0 counts | Bins with >2000 counts | High rate bins dominated by noise | Noise dominated (total time) | Noise dominated (detector-on time) | Marked lightcurve |
|---|---|---|---|---|---|---|---|
| A | 7055 | 4964 | 74 | 74 | 1.05% | 1.49% | 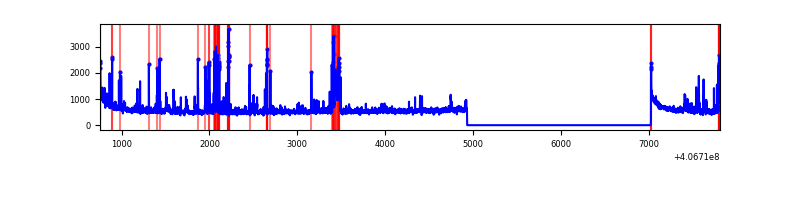 |
| B | 7055 | 4964 | 19 | 19 | 0.27% | 0.38% | 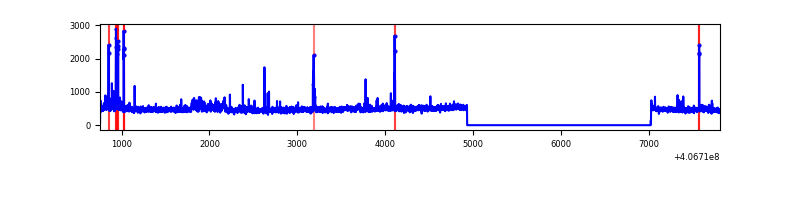 |
| C | 7055 | 4964 | 4 | 4 | 0.06% | 0.08% | 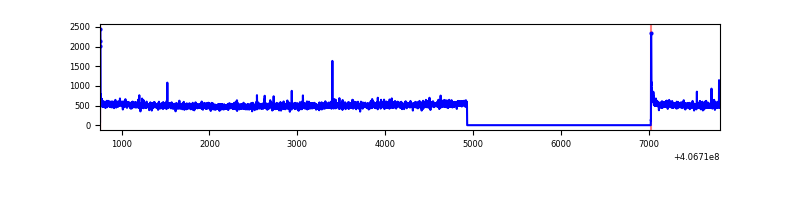 |
| D | 7055 | 4964 | 29 | 29 | 0.41% | 0.58% | 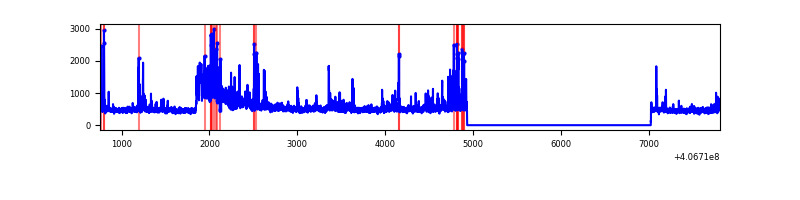 |
Top three noisy pixels from each quadrant. If the there are fewer than three noisy pixels in the level2.evt file, extra rows are filled as -1
| Pixel properties | Quadrant properties | ||||||
|---|---|---|---|---|---|---|---|
| Quadrant | DetID | PixID | Counts | Sigma | Mean | Median | Sigma |
| A | 10 | 83 | 405699 | 3450.11 | 583 | 572 | 117.4 |
| A | 9 | 143 | 312960 | 2660.33 | 583 | 572 | 117.4 |
| A | 15 | 174 | 64170 | 541.61 | 583 | 572 | 117.4 |
| B | 5 | 184 | 70740 | 632.16 | 580 | 566 | 111.0 |
| B | 0 | 186 | 30494 | 269.6 | 580 | 566 | 111.0 |
| B | 5 | 200 | 25374 | 223.48 | 580 | 566 | 111.0 |
| C | 15 | 214 | 206711 | 1539.07 | 577 | 583 | 133.9 |
| C | 0 | 10 | 23857 | 173.78 | 577 | 583 | 133.9 |
| C | 15 | 159 | 9622 | 67.49 | 577 | 583 | 133.9 |
| D | 5 | 222 | 391751 | 2755.16 | 578 | 563 | 142.0 |
| D | 2 | 249 | 76241 | 533.01 | 578 | 563 | 142.0 |
| D | 12 | 233 | 38439 | 266.76 | 578 | 563 | 142.0 |
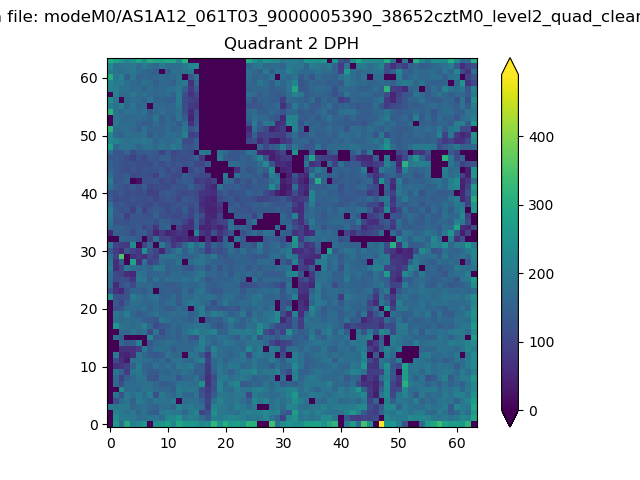
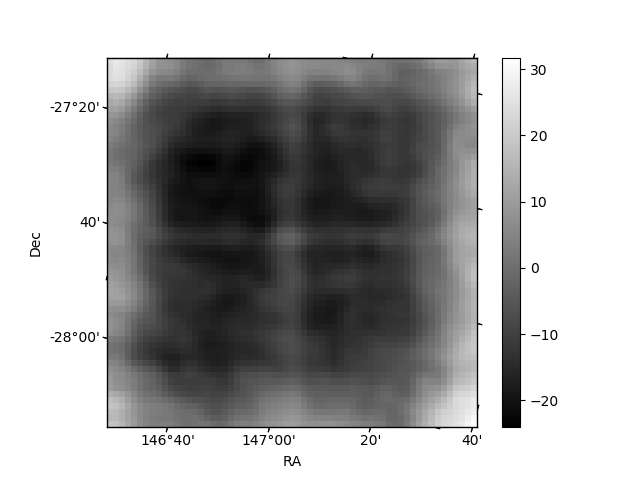
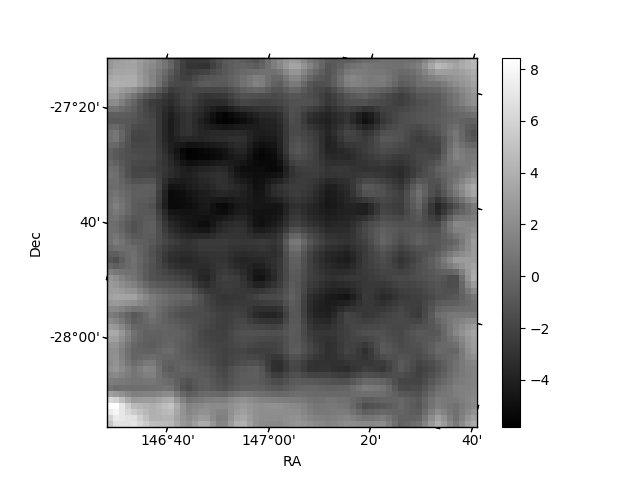
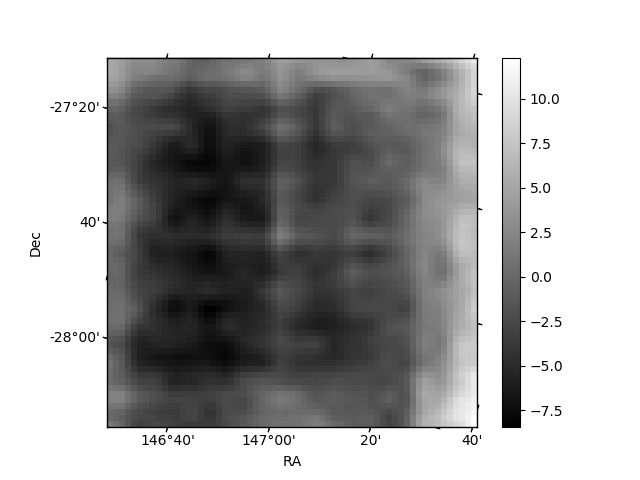
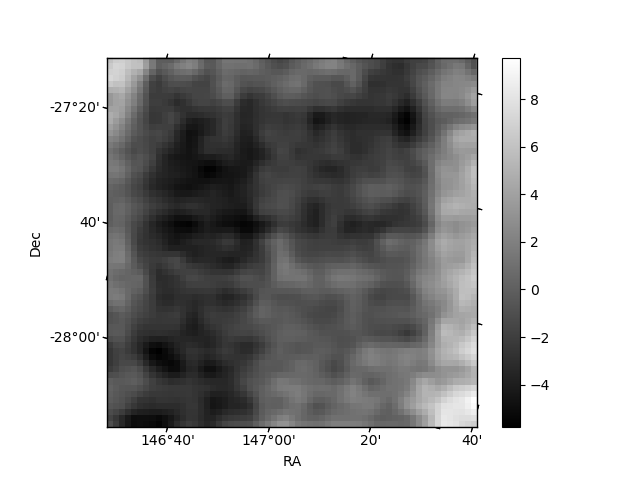
Histogram calculated using DETX and DETY for each event in the final _common_clean file
| Quadrant A | 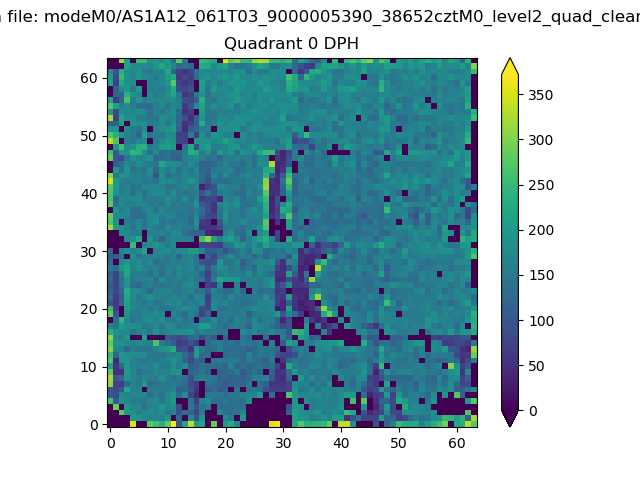 |
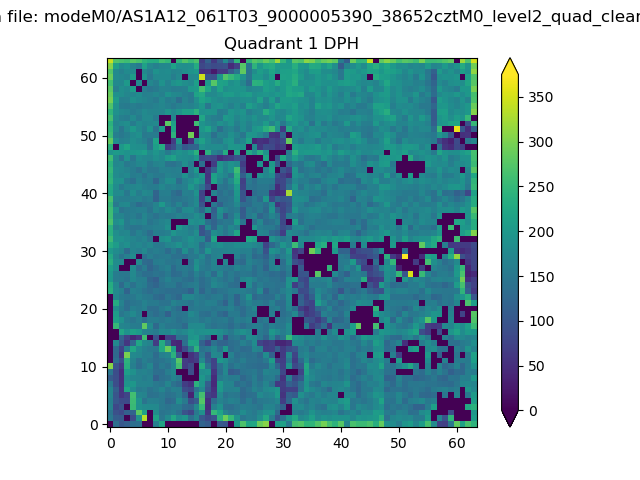 |
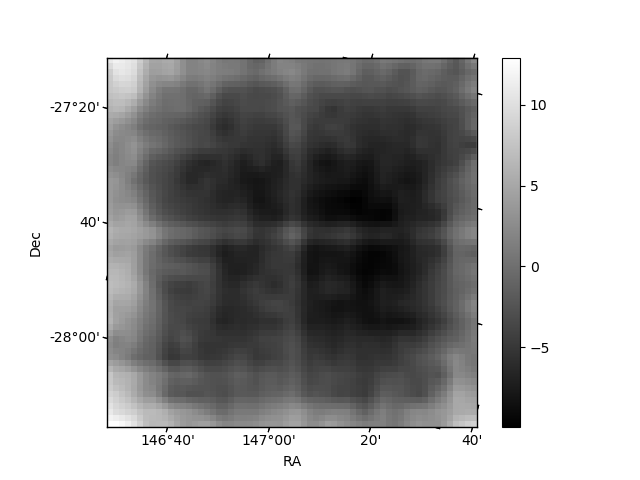
Quadrant B |
|---|---|---|---|
| Quadrant D | 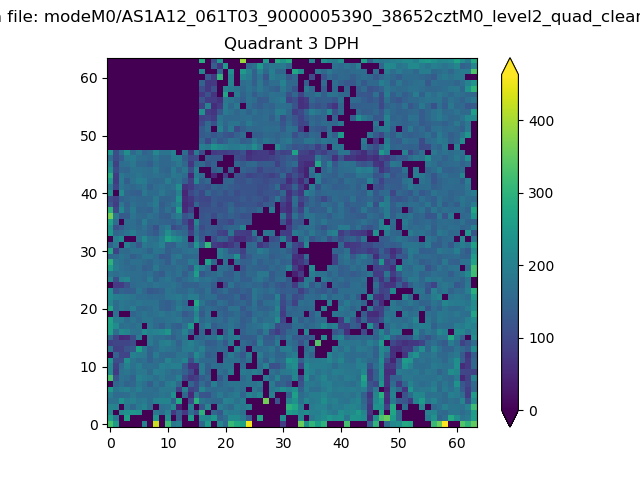 |
 |
Quadrant C |
| Plot type | Count rate plots | Images |
|---|---|---|
| Comparison with Poisson distribution Blue bars denote a histogram of data divided into 1 sec bins. Red curve is a Poisson curve with rate = median count rate of data. |
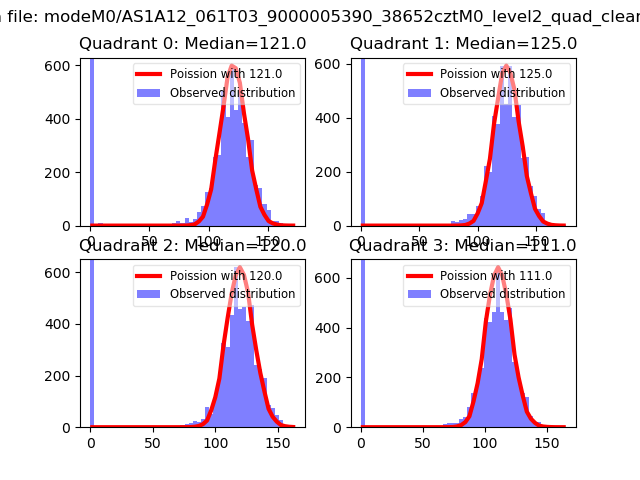 |
 |
| Quadrant-wise count rates Data is divided into 100 sec bins |
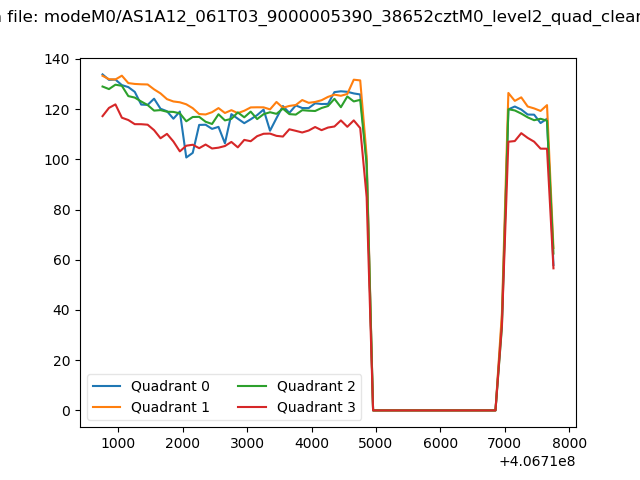 |
|
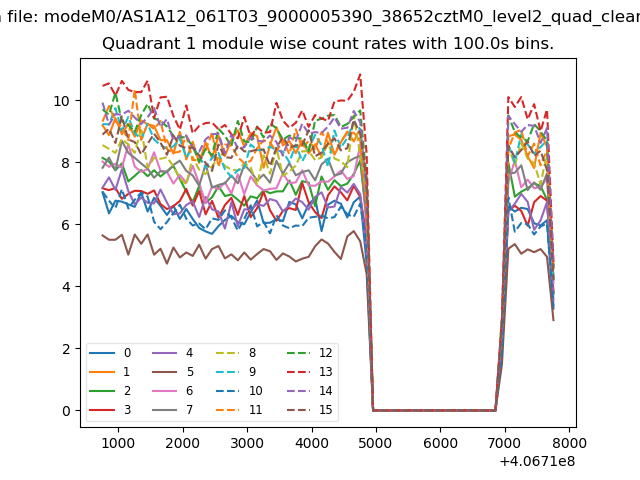
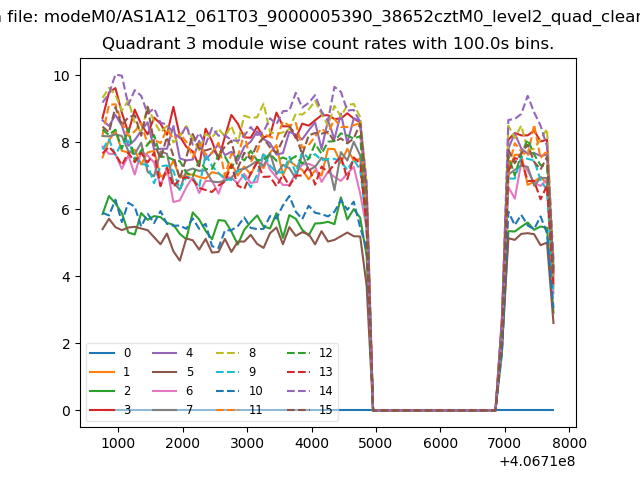
| Module-wise count rates for Quadrant A Data is divided into 100 sec bins |
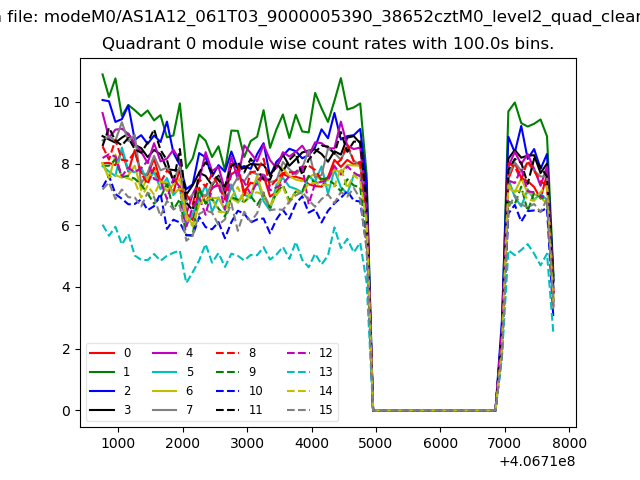 |
 |
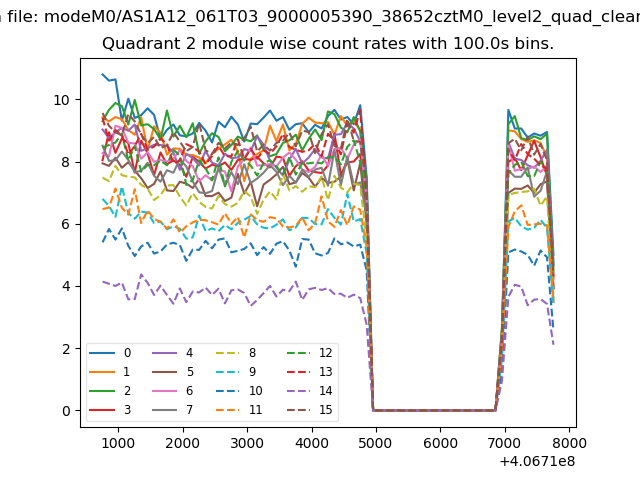
| Module-wise count rates for Quadrant B Data is divided into 100 sec bins |
 |
 |
| Module-wise count rates for Quadrant C Data is divided into 100 sec bins |
 |
 |
| Module-wise count rates for Quadrant D Data is divided into 100 sec bins |
 |
 |
| Parameter | Plot |
|---|---|
| CZT HV Monitor | 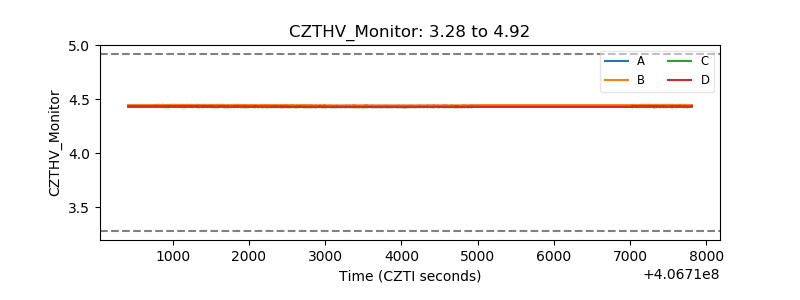 |
| D_VDD | 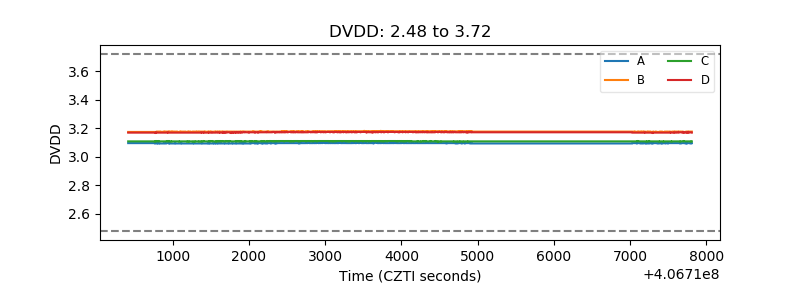 |
| Temperature 1 | 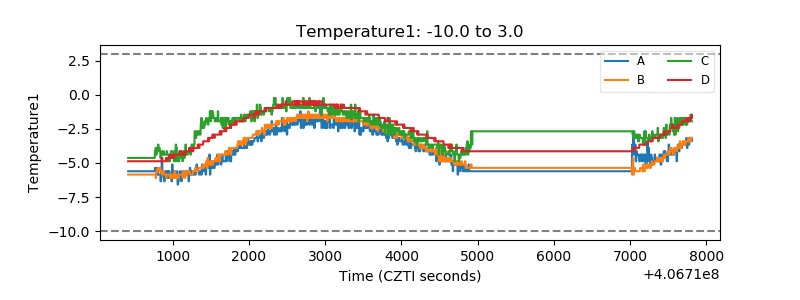 |
| Veto HV Monitor | 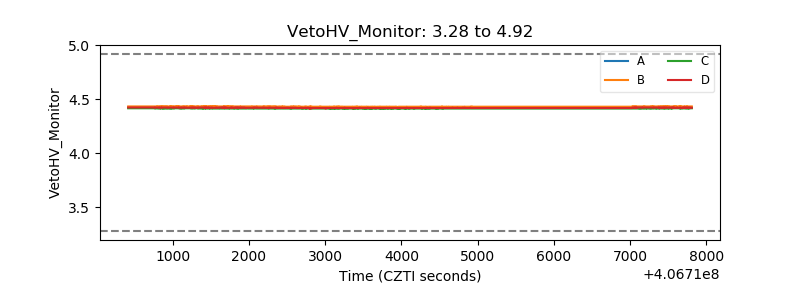 |
| Veto LLD | 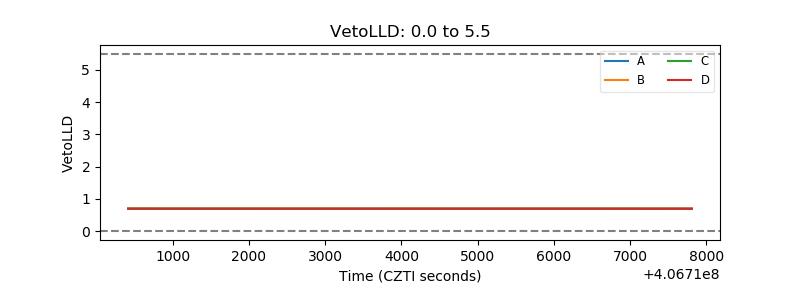 |
| Alpha Counter | 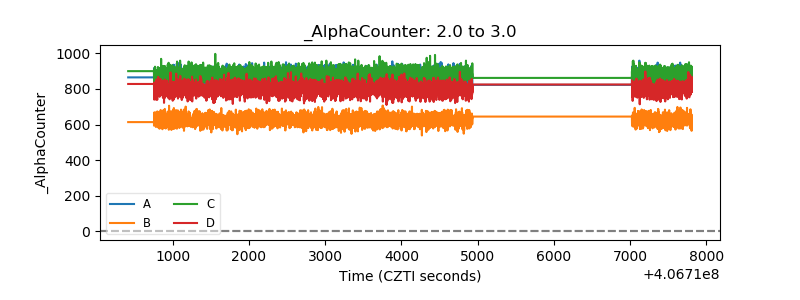 |
| _CPM_Rate | 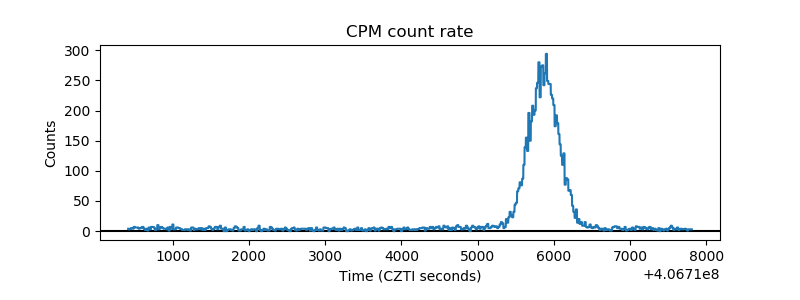 |
| CZT Counter | 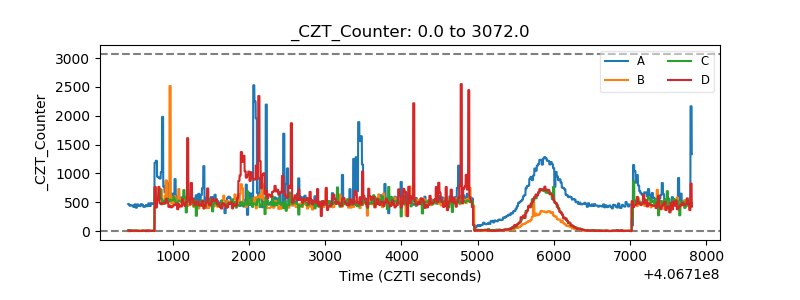 |
| +2.5 Volts monitor | 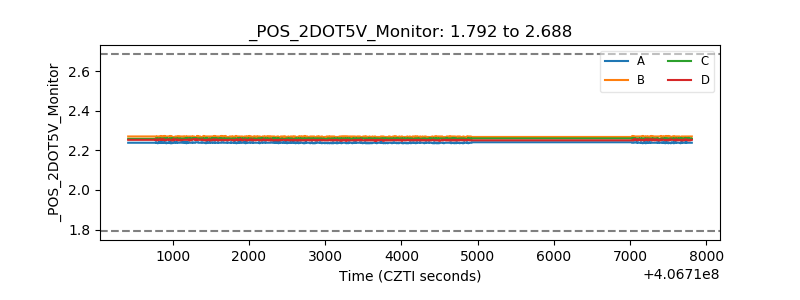 |
| +5 Volts monitor | 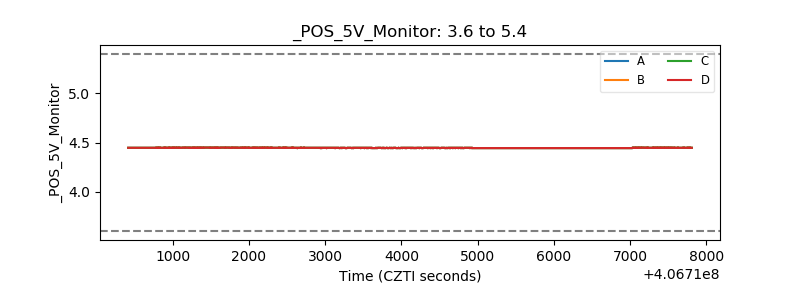 |
| _ROLL_ROT | 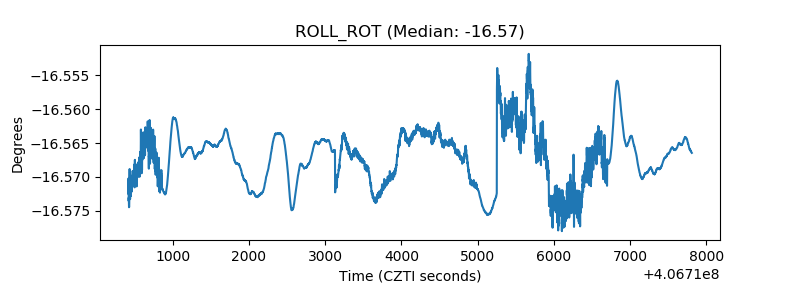 |
| _Roll_DEC | 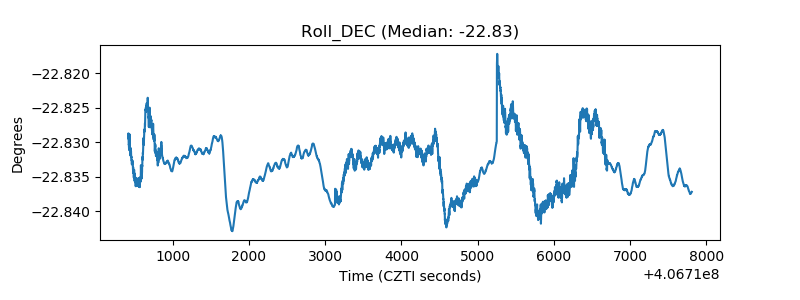 |
| _Roll_RA | 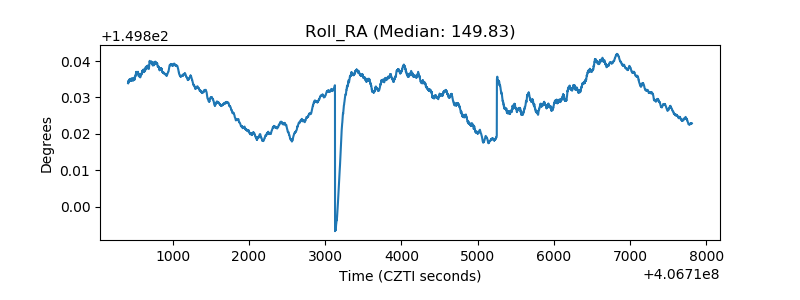 |
| Veto Counter | 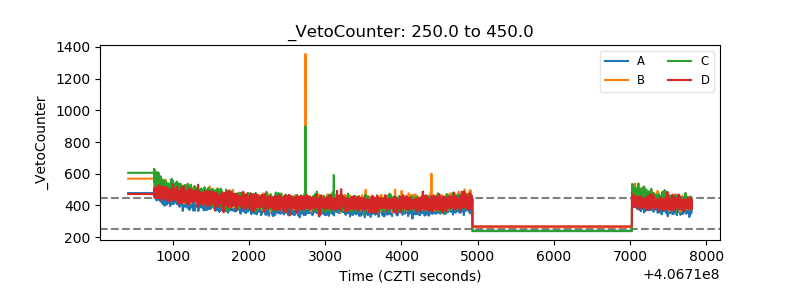 |