| Param | Original file | Final file |
|---|---|---|
| Filename | modeM0/AS1A12_061T03_9000005390_38653cztM0_level2.fits | modeM0/AS1A12_061T03_9000005390_38653cztM0_level2_quad_clean.evt |
| Size (bytes) | 318,110,400 | 89,856,000 |
| Size | 303.4 MB | 85.7 MB |
| Events in quadrant A | 2,966,371 | 599,959 |
| Events in quadrant B | 2,599,493 | 614,366 |
| Events in quadrant C | 2,618,493 | 597,329 |
| Events in quadrant D | 3,183,445 | 542,955 |
| Mode SS | |||
|---|---|---|---|
| Quadrant | BADHDUFLAG | Total packets | Discarded packets |
| A | 0 | 106 | 0 |
| B | 0 | 106 | 0 |
| C | 0 | 106 | 0 |
| D | 0 | 106 | 0 |
| Mode M9 | |||
|---|---|---|---|
| Quadrant | BADHDUFLAG | Total packets | Discarded packets |
| A | 0 | 23 | 0 |
| B | 0 | 23 | 0 |
| C | 0 | 23 | 0 |
| D | 0 | 24 | 0 |
| Mode M0 | |||
|---|---|---|---|
| Quadrant | BADHDUFLAG | Total packets | Discarded packets |
| A | 0 | 11805 | 3 |
| B | 0 | 11073 | 2 |
| C | 0 | 10763 | 2 |
| D | 0 | 12861 | 2 |
| Quadrant | Total seconds | Saturated seconds | Saturation percentage |
|---|---|---|---|
| A | 5231 | 24 | 0.458803% |
| B | 5231 | 47 | 0.898490% |
| C | 5231 | 6 | 0.114701% |
| D | 5231 | 121 | 2.313133% |
Noise dominated data is calculated using 1-second bins in cleaned event files. If a bin has >2000 counts, and if more than 50% of those come from <1% of pixels, then it is considered to be noise-dominated and hence unusable.
| Quadrant | # 1 sec bins | Bins with >0 counts | Bins with >2000 counts | High rate bins dominated by noise | Noise dominated (total time) | Noise dominated (detector-on time) | Marked lightcurve |
|---|---|---|---|---|---|---|---|
| A | 7114 | 5232 | 18 | 18 | 0.25% | 0.34% | 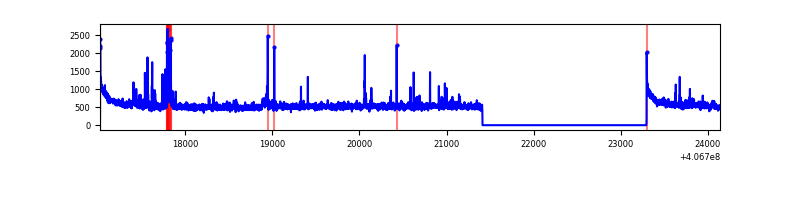 |
| B | 7114 | 5232 | 34 | 34 | 0.48% | 0.65% | 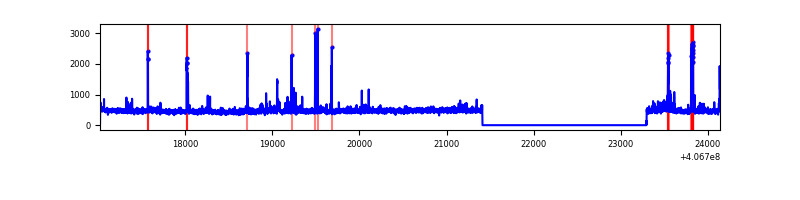 |
| C | 7114 | 5232 | 1 | 1 | 0.01% | 0.02% | 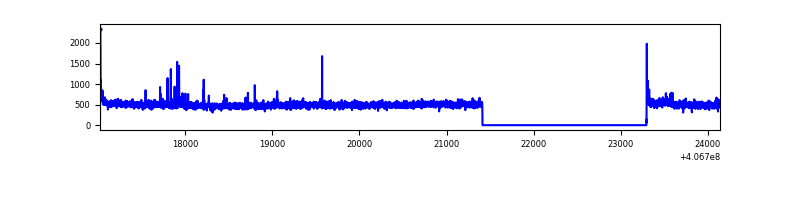 |
| D | 7114 | 5232 | 90 | 90 | 1.27% | 1.72% | 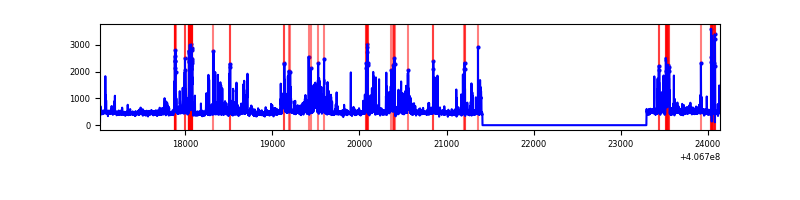 |
Top three noisy pixels from each quadrant. If the there are fewer than three noisy pixels in the level2.evt file, extra rows are filled as -1
| Pixel properties | Quadrant properties | ||||||
|---|---|---|---|---|---|---|---|
| Quadrant | DetID | PixID | Counts | Sigma | Mean | Median | Sigma |
| A | 10 | 83 | 429557 | 3465.14 | 602 | 589 | 123.8 |
| A | 15 | 174 | 74530 | 597.28 | 602 | 589 | 123.8 |
| A | 9 | 143 | 57310 | 458.18 | 602 | 589 | 123.8 |
| B | 5 | 172 | 56961 | 485.75 | 598 | 584 | 116.1 |
| B | 5 | 184 | 52768 | 449.62 | 598 | 584 | 116.1 |
| B | 5 | 200 | 31985 | 270.55 | 598 | 584 | 116.1 |
| C | 15 | 214 | 216631 | 1561.72 | 593 | 597 | 138.3 |
| C | 0 | 10 | 27062 | 191.32 | 593 | 597 | 138.3 |
| C | 3 | 110 | 26730 | 188.92 | 593 | 597 | 138.3 |
| D | 12 | 233 | 465294 | 3197.99 | 587 | 571 | 145.3 |
| D | 13 | 249 | 129321 | 885.99 | 587 | 571 | 145.3 |
| D | 2 | 249 | 103733 | 709.91 | 587 | 571 | 145.3 |
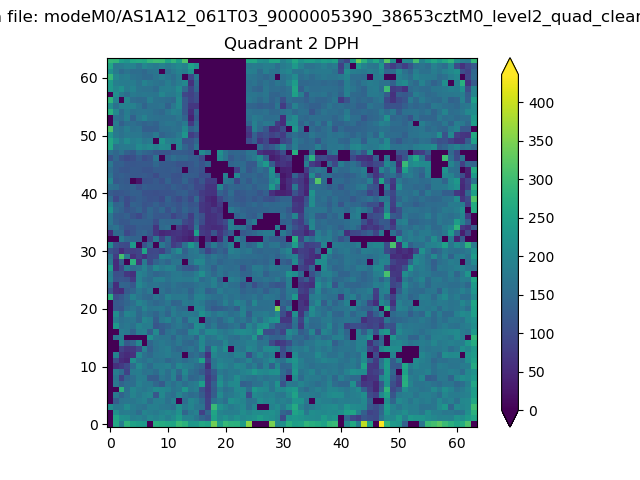
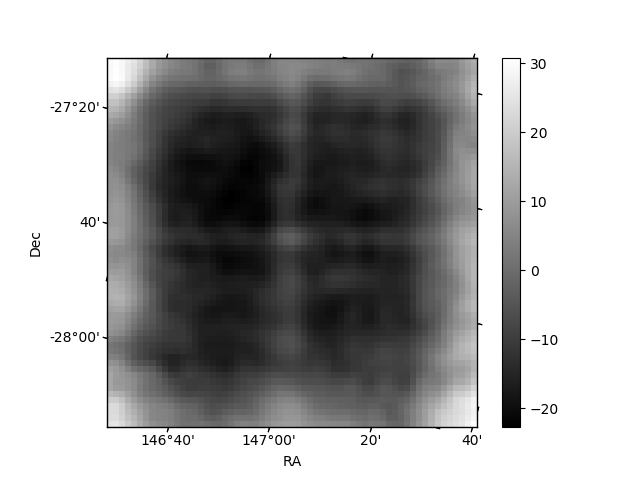
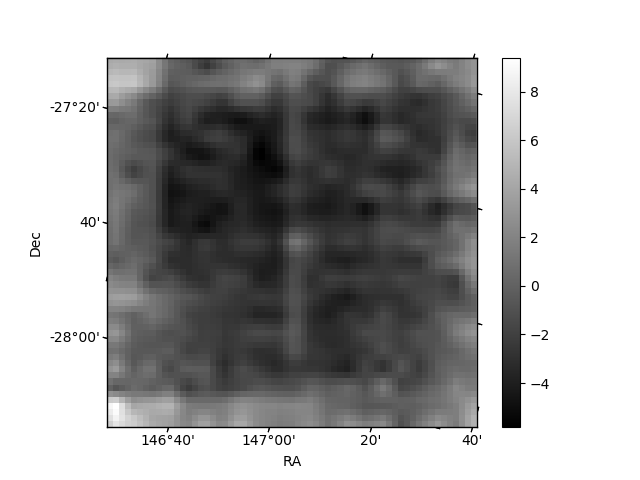
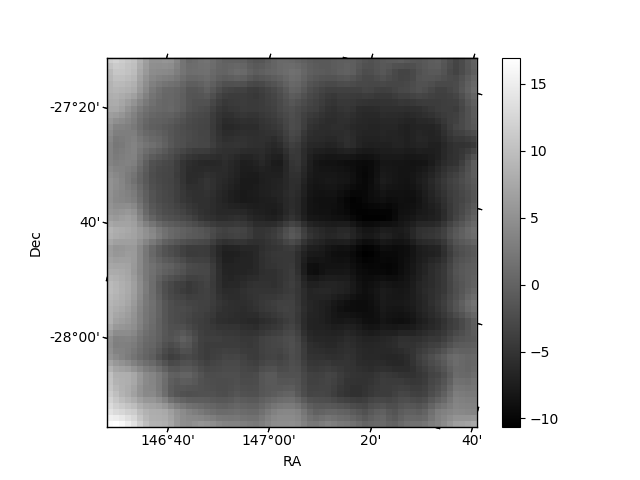
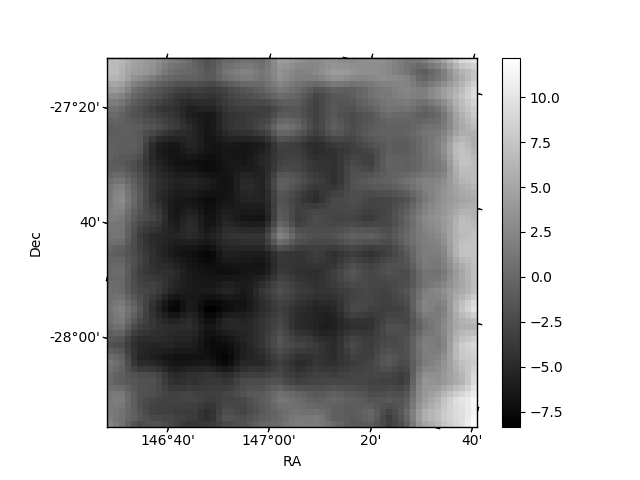
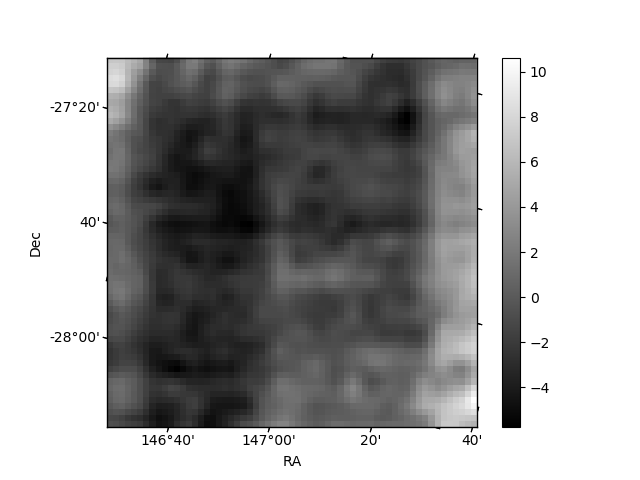
Histogram calculated using DETX and DETY for each event in the final _common_clean file
| Quadrant A | 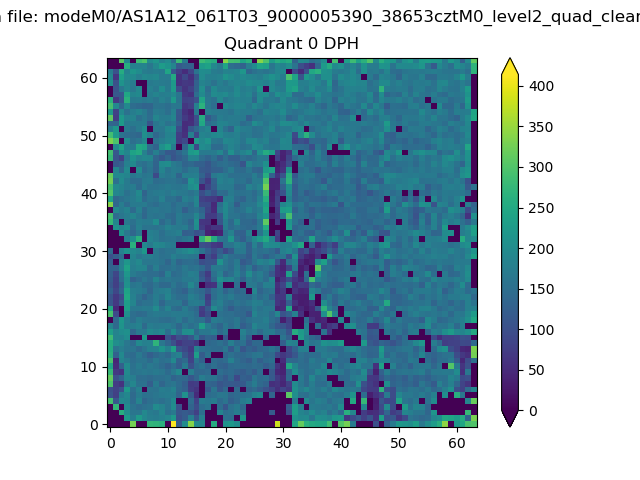 |
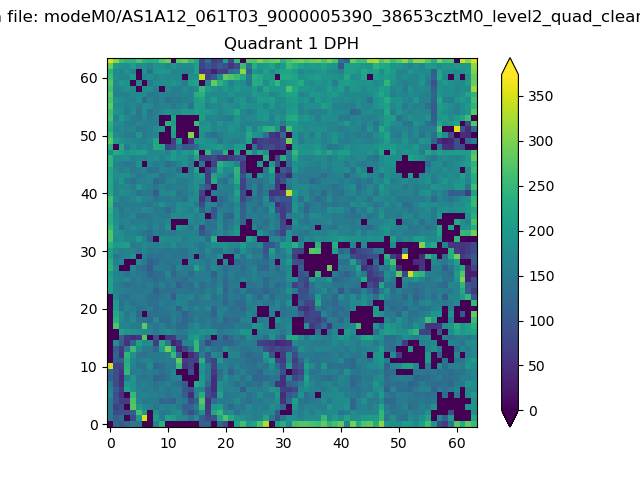 |
Quadrant B |
|---|---|---|---|
| Quadrant D | 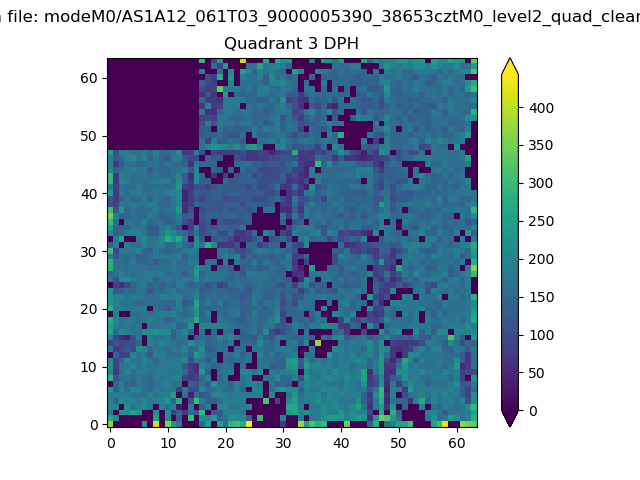 |
 |
Quadrant C |
| Plot type | Count rate plots | Images |
|---|---|---|
| Comparison with Poisson distribution Blue bars denote a histogram of data divided into 1 sec bins. Red curve is a Poisson curve with rate = median count rate of data. |
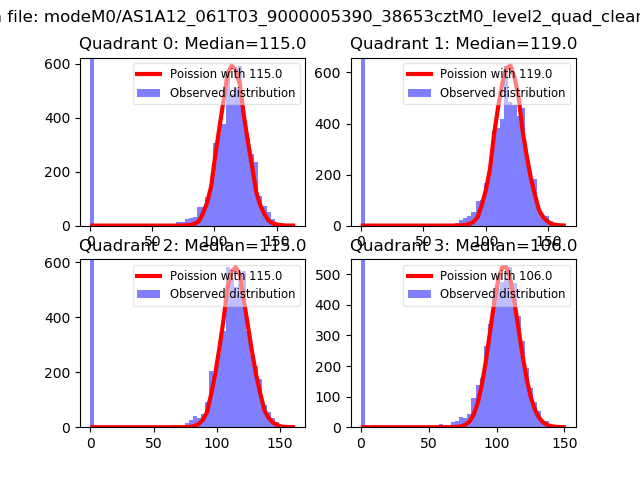 |
 |
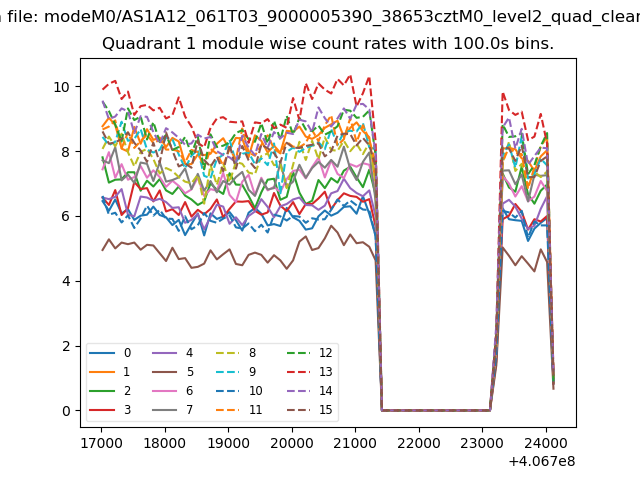
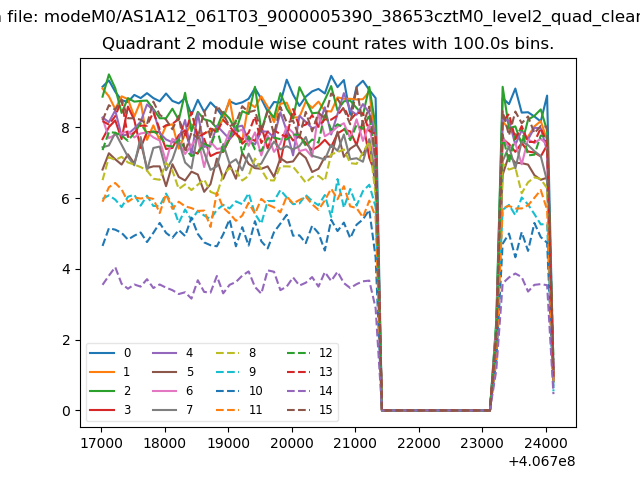
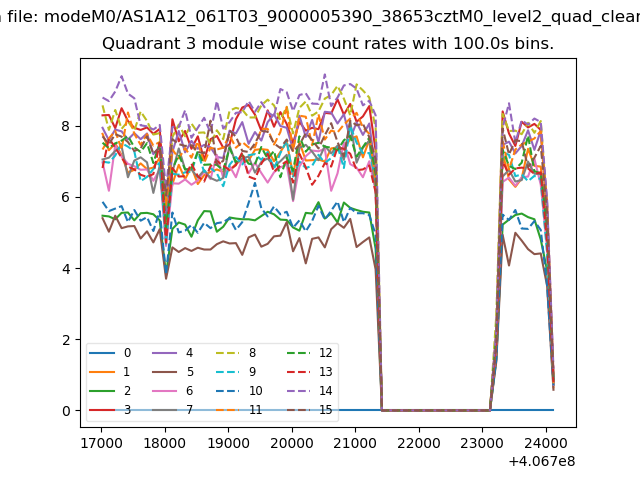
| Quadrant-wise count rates Data is divided into 100 sec bins |
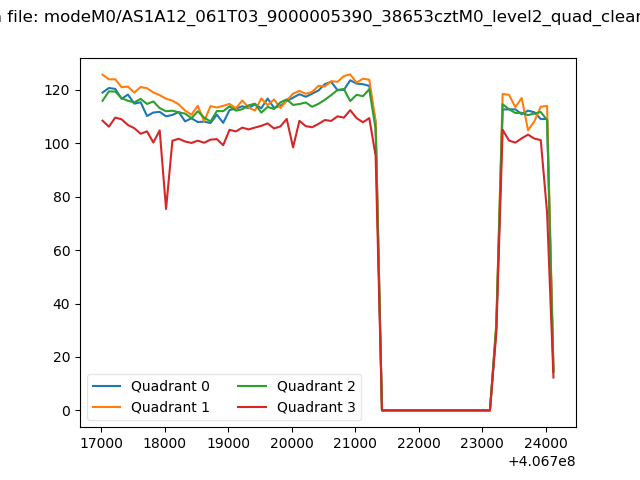 |
|
| Module-wise count rates for Quadrant A Data is divided into 100 sec bins |
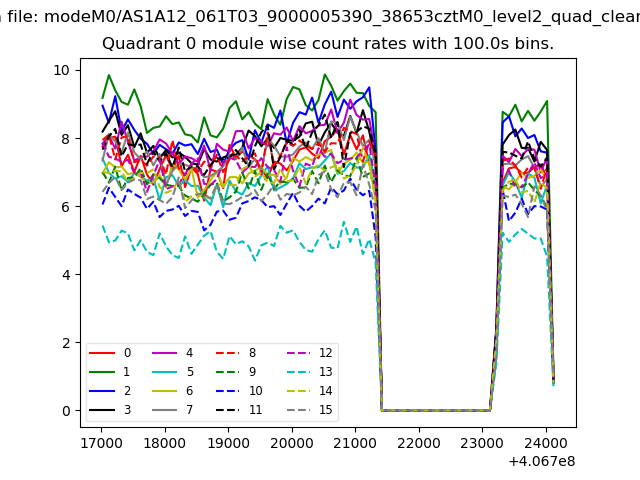 |
 |
| Module-wise count rates for Quadrant B Data is divided into 100 sec bins |
 |
 |
| Module-wise count rates for Quadrant C Data is divided into 100 sec bins |
 |
 |
| Module-wise count rates for Quadrant D Data is divided into 100 sec bins |
 |
 |
| Parameter | Plot |
|---|---|
| CZT HV Monitor | 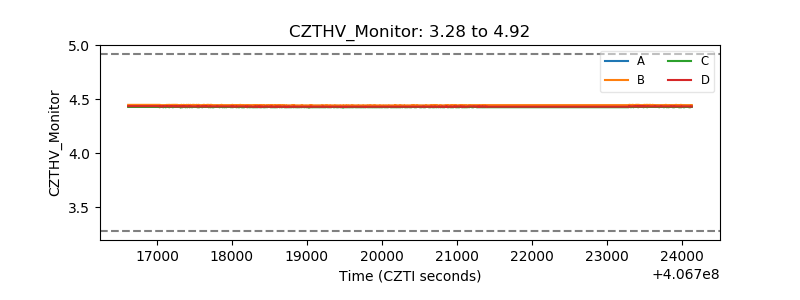 |
| D_VDD | 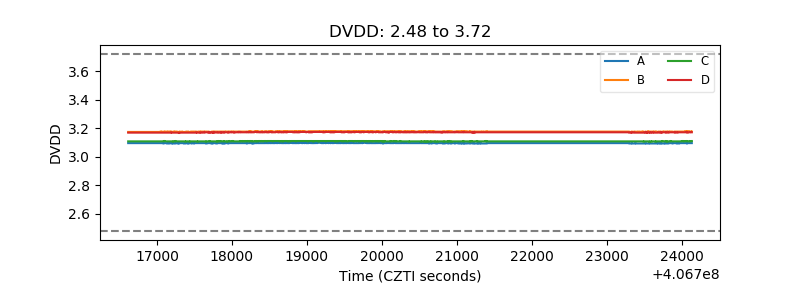 |
| Temperature 1 | 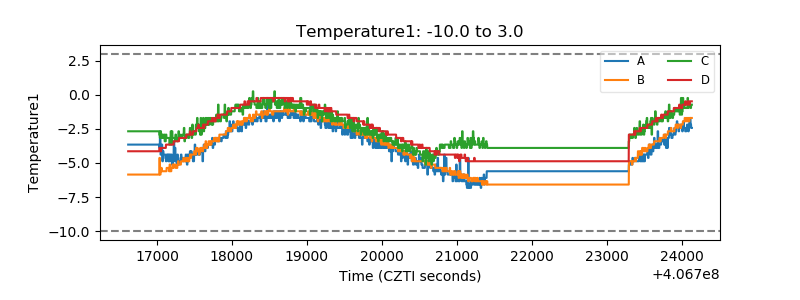 |
| Veto HV Monitor | 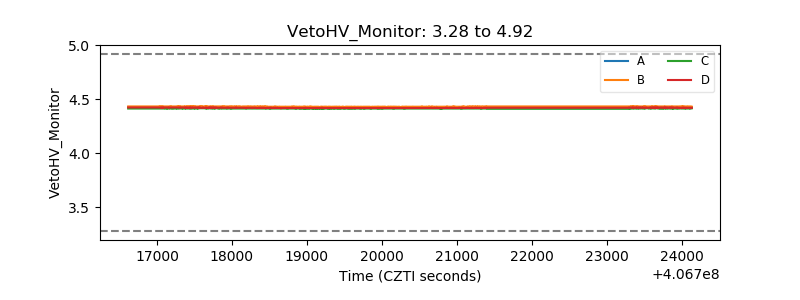 |
| Veto LLD | 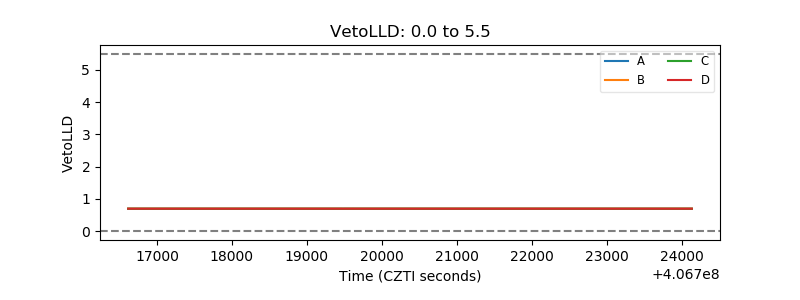 |
| Alpha Counter | 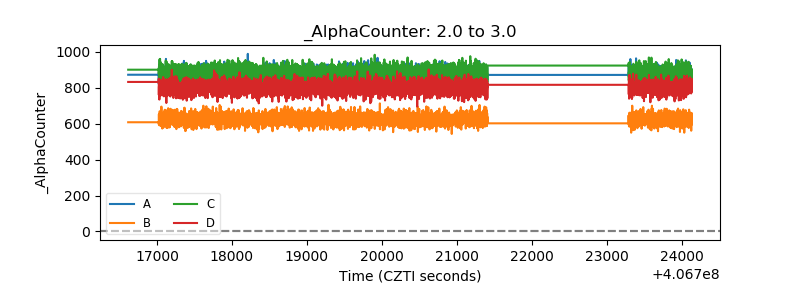 |
| _CPM_Rate | 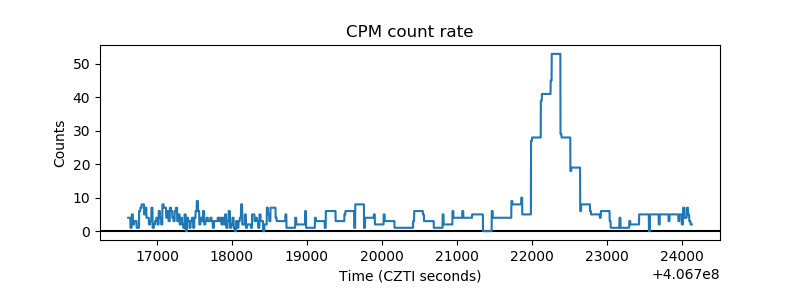 |
| CZT Counter | 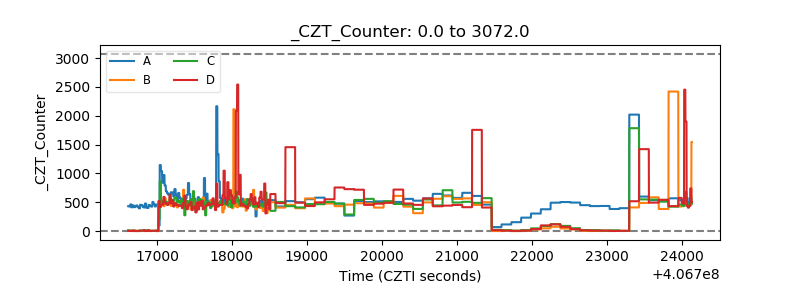 |
| +2.5 Volts monitor | 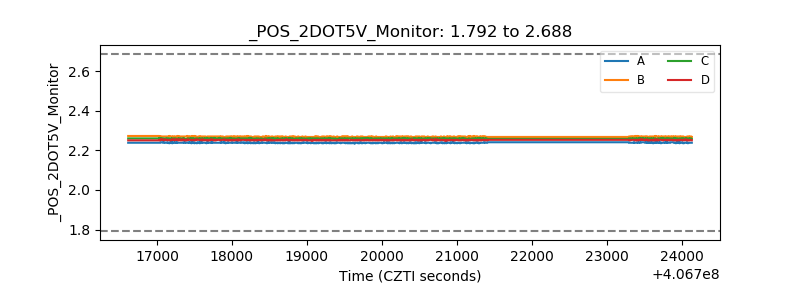 |
| +5 Volts monitor | 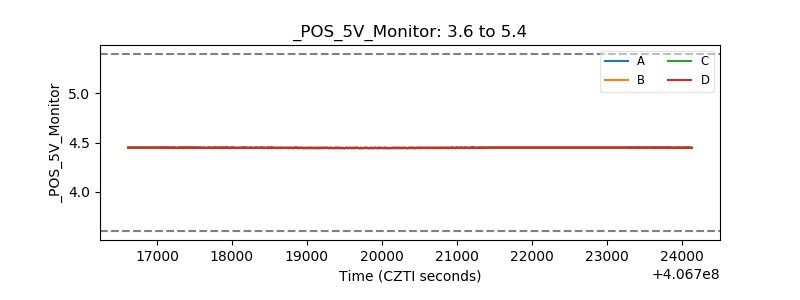 |
| _ROLL_ROT | 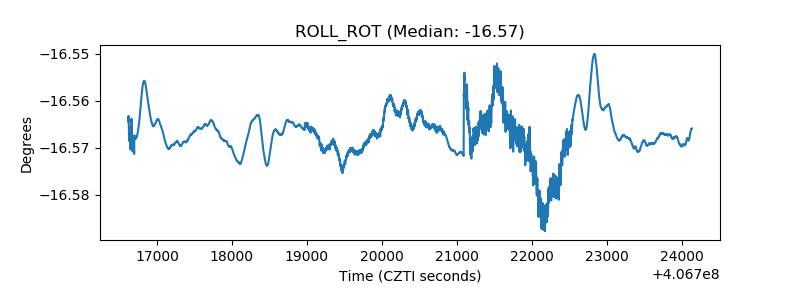 |
| _Roll_DEC | 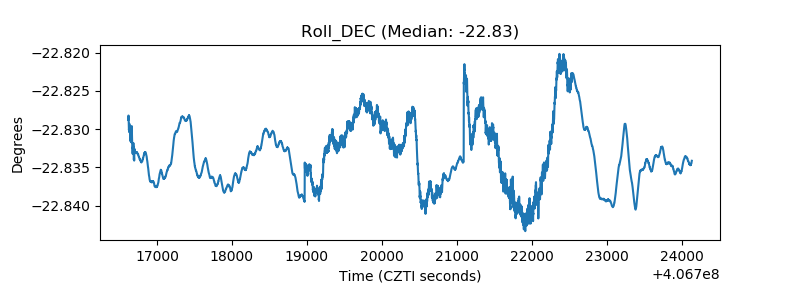 |
| _Roll_RA | 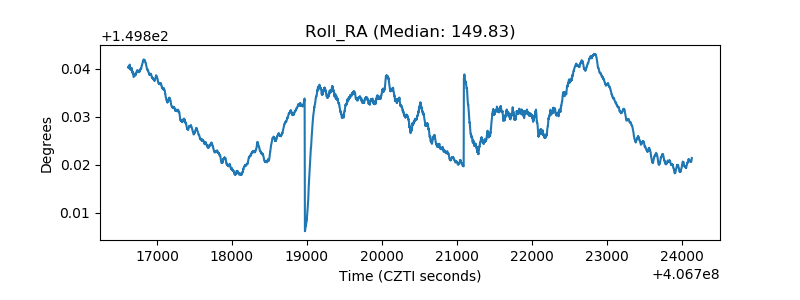 |
| Veto Counter | 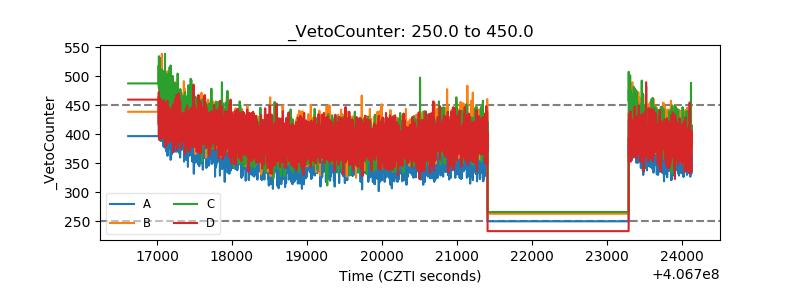 |