| Param | Original file | Final file |
|---|---|---|
| Filename | modeM0/AS1A12_061T03_9000005390_38654cztM0_level2.fits | modeM0/AS1A12_061T03_9000005390_38654cztM0_level2_quad_clean.evt |
| Size (bytes) | 361,552,320 | 93,582,720 |
| Size | 344.8 MB | 89.2 MB |
| Events in quadrant A | 3,296,978 | 622,987 |
| Events in quadrant B | 2,958,051 | 634,399 |
| Events in quadrant C | 3,013,191 | 621,842 |
| Events in quadrant D | 3,678,124 | 561,477 |
| Mode SS | |||
|---|---|---|---|
| Quadrant | BADHDUFLAG | Total packets | Discarded packets |
| A | 0 | 114 | 0 |
| B | 0 | 114 | 0 |
| C | 0 | 114 | 0 |
| D | 0 | 114 | 0 |
| Mode M9 | |||
|---|---|---|---|
| Quadrant | BADHDUFLAG | Total packets | Discarded packets |
| A | 0 | 20 | 0 |
| B | 0 | 20 | 0 |
| C | 0 | 20 | 0 |
| D | 0 | 21 | 0 |
| Mode M0 | |||
|---|---|---|---|
| Quadrant | BADHDUFLAG | Total packets | Discarded packets |
| A | 0 | 13087 | 3 |
| B | 0 | 12379 | 2 |
| C | 0 | 12299 | 2 |
| D | 0 | 14560 | 2 |
| Quadrant | Total seconds | Saturated seconds | Saturation percentage |
|---|---|---|---|
| A | 5617 | 69 | 1.228414% |
| B | 5617 | 115 | 2.047356% |
| C | 5617 | 57 | 1.014777% |
| D | 5617 | 214 | 3.809863% |
Noise dominated data is calculated using 1-second bins in cleaned event files. If a bin has >2000 counts, and if more than 50% of those come from <1% of pixels, then it is considered to be noise-dominated and hence unusable.
| Quadrant | # 1 sec bins | Bins with >0 counts | Bins with >2000 counts | High rate bins dominated by noise | Noise dominated (total time) | Noise dominated (detector-on time) | Marked lightcurve |
|---|---|---|---|---|---|---|---|
| A | 7170 | 5618 | 56 | 56 | 0.78% | 1.00% | 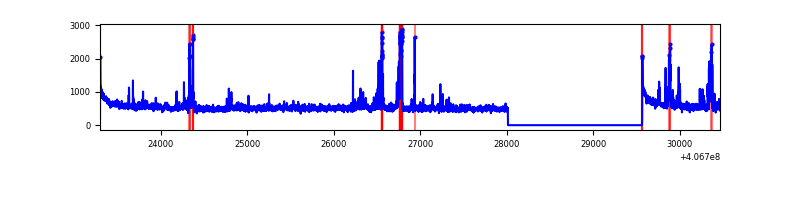 |
| B | 7170 | 5618 | 93 | 93 | 1.30% | 1.66% | 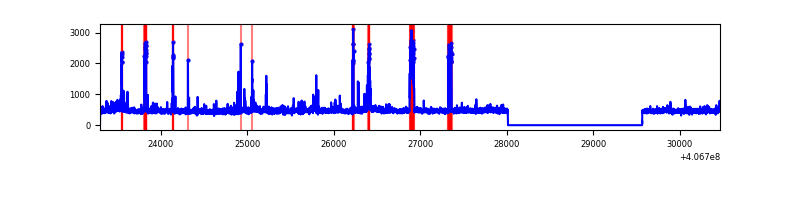 |
| C | 7170 | 5618 | 59 | 59 | 0.82% | 1.05% | 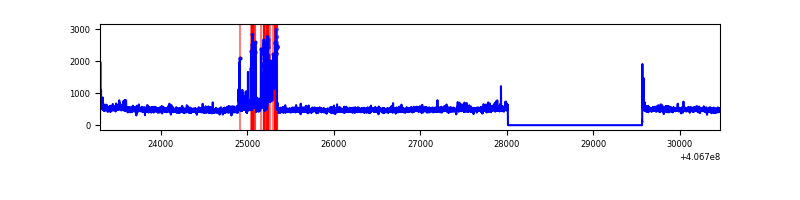 |
| D | 7170 | 5618 | 165 | 165 | 2.30% | 2.94% | 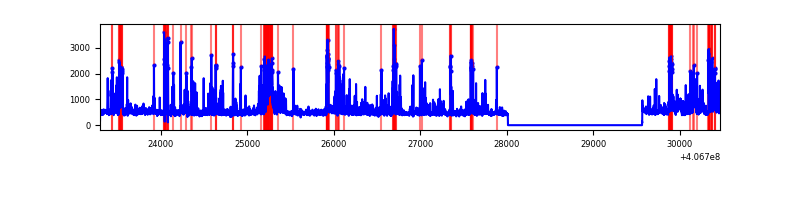 |
Top three noisy pixels from each quadrant. If the there are fewer than three noisy pixels in the level2.evt file, extra rows are filled as -1
| Pixel properties | Quadrant properties | ||||||
|---|---|---|---|---|---|---|---|
| Quadrant | DetID | PixID | Counts | Sigma | Mean | Median | Sigma |
| A | 10 | 83 | 441090 | 3405.77 | 635 | 621 | 129.3 |
| A | 9 | 143 | 267423 | 2062.95 | 635 | 621 | 129.3 |
| A | 13 | 248 | 68635 | 525.89 | 635 | 621 | 129.3 |
| B | 5 | 184 | 247706 | 2025.87 | 630 | 613 | 122.0 |
| B | 5 | 172 | 98235 | 800.38 | 630 | 613 | 122.0 |
| B | 0 | 155 | 46036 | 372.41 | 630 | 613 | 122.0 |
| C | 3 | 9 | 288997 | 1969.68 | 624 | 628 | 146.4 |
| C | 15 | 214 | 230332 | 1568.98 | 624 | 628 | 146.4 |
| C | 0 | 10 | 18414 | 121.49 | 624 | 628 | 146.4 |
| D | 5 | 222 | 497673 | 3242.08 | 617 | 600 | 153.3 |
| D | 13 | 249 | 262973 | 1711.29 | 617 | 600 | 153.3 |
| D | 12 | 233 | 142996 | 928.75 | 617 | 600 | 153.3 |
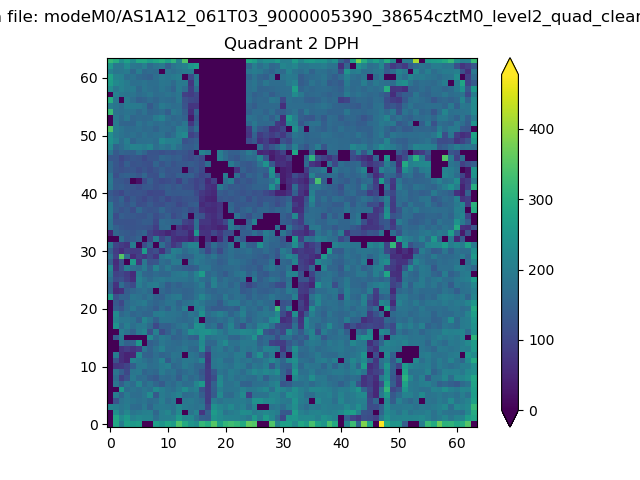
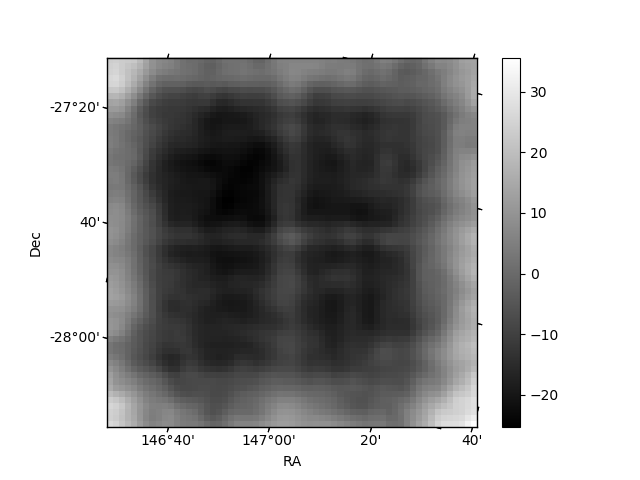
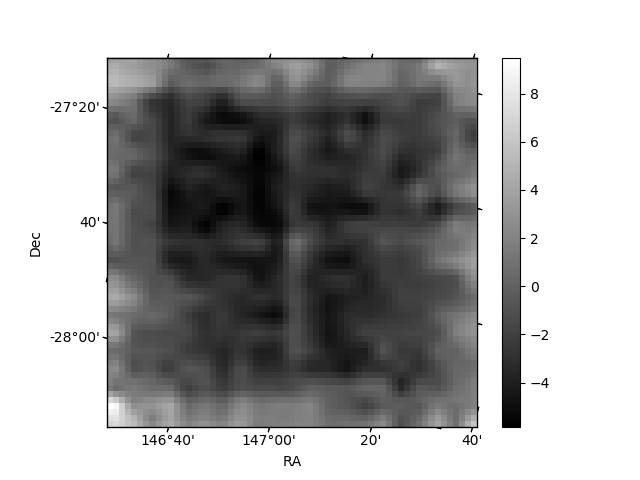
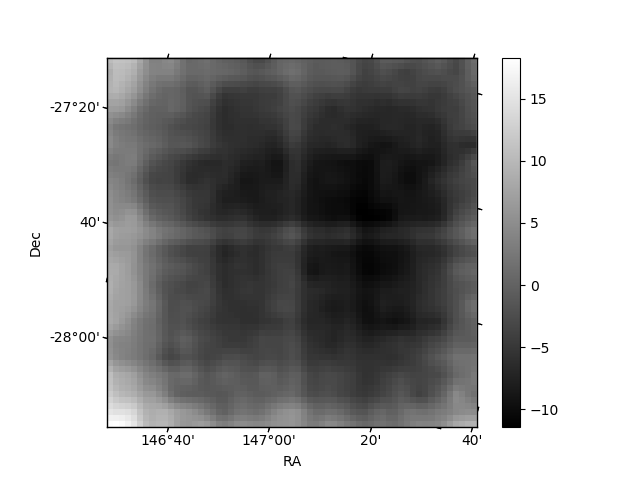
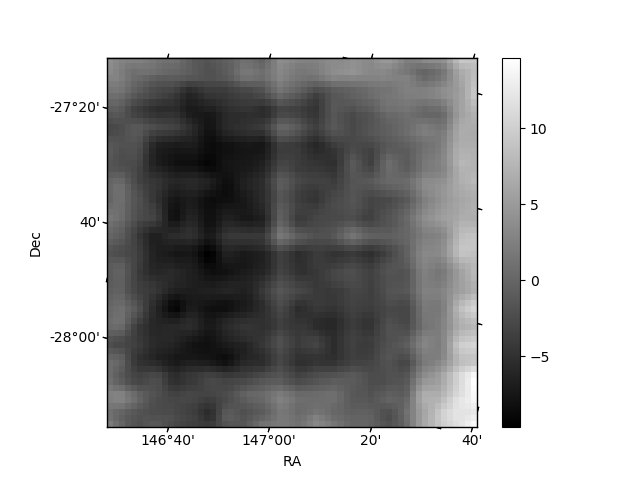
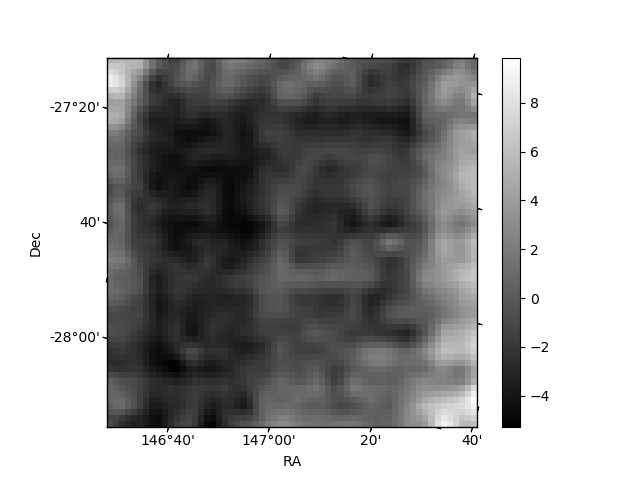
Histogram calculated using DETX and DETY for each event in the final _common_clean file
| Quadrant A | 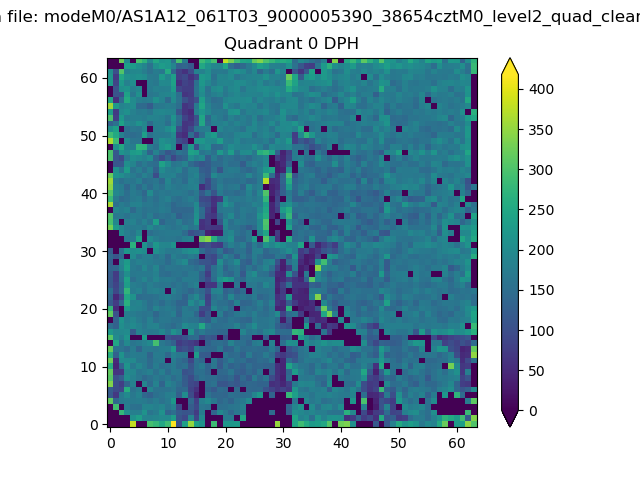 |
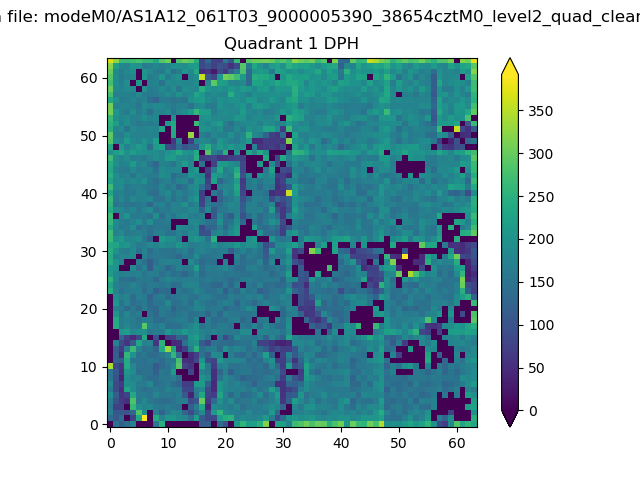 |
Quadrant B |
|---|---|---|---|
| Quadrant D | 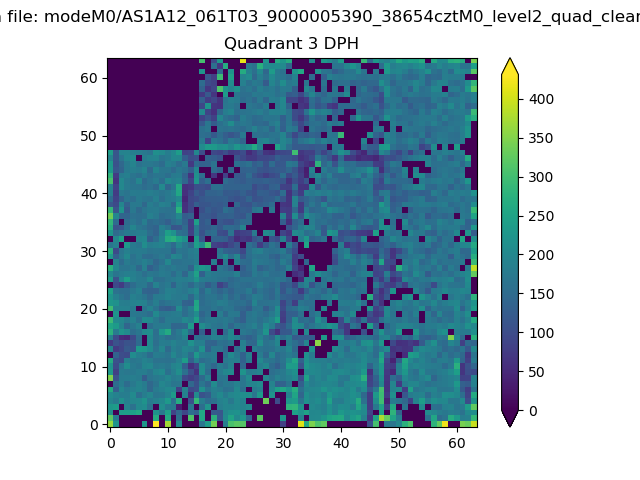 |
 |
Quadrant C |
| Plot type | Count rate plots | Images |
|---|---|---|
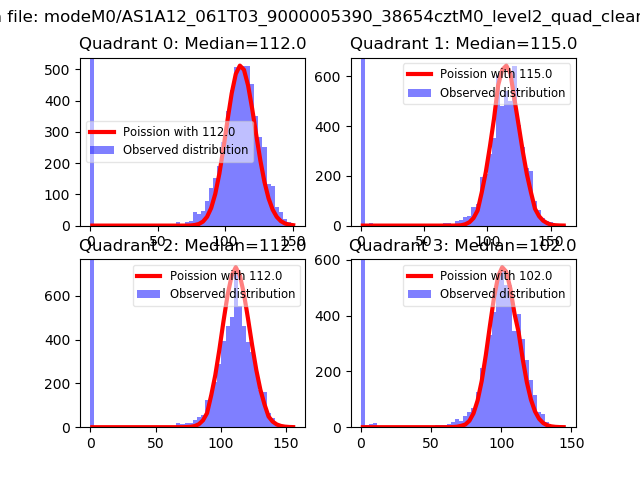
| Comparison with Poisson distribution Blue bars denote a histogram of data divided into 1 sec bins. Red curve is a Poisson curve with rate = median count rate of data. |
 |
 |
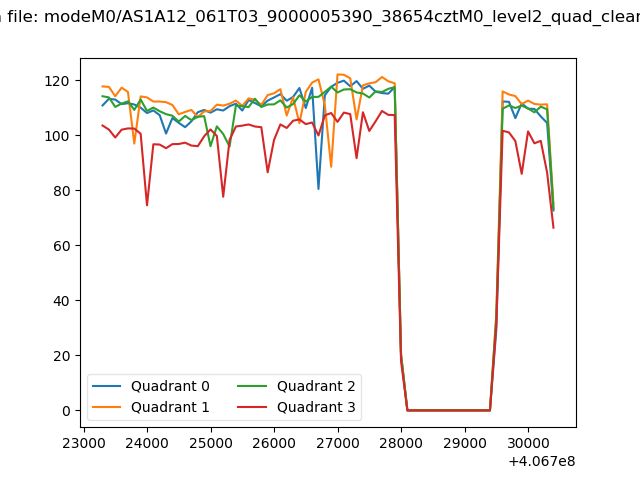
| Quadrant-wise count rates Data is divided into 100 sec bins |
 |
|
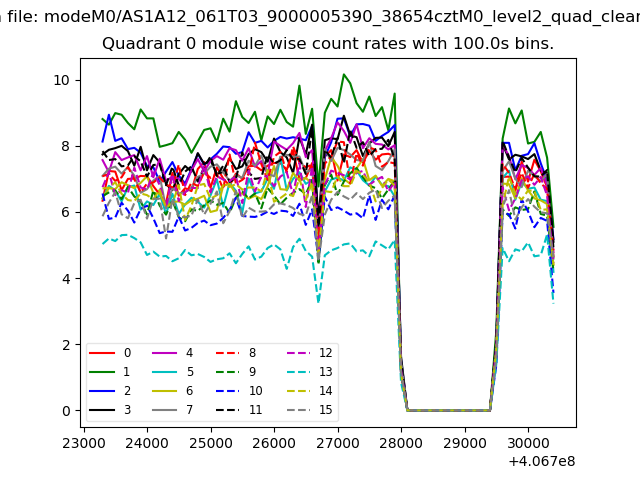
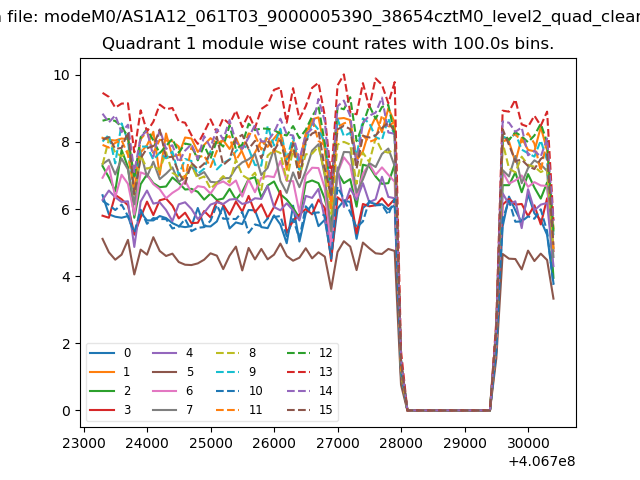
| Module-wise count rates for Quadrant A Data is divided into 100 sec bins |
 |
 |
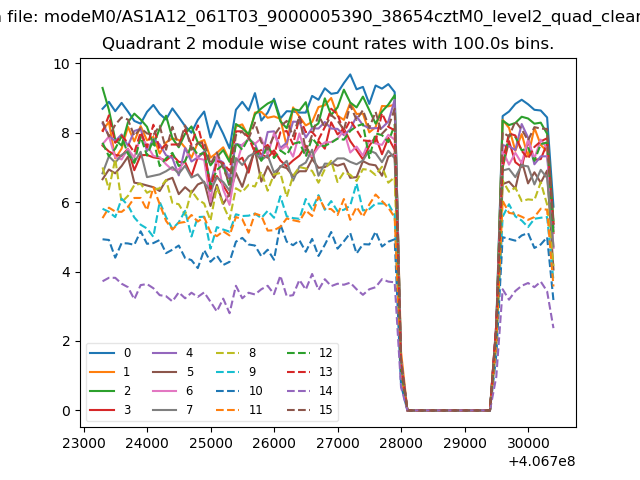
| Module-wise count rates for Quadrant B Data is divided into 100 sec bins |
 |
 |
| Module-wise count rates for Quadrant C Data is divided into 100 sec bins |
 |
 |
| Module-wise count rates for Quadrant D Data is divided into 100 sec bins |
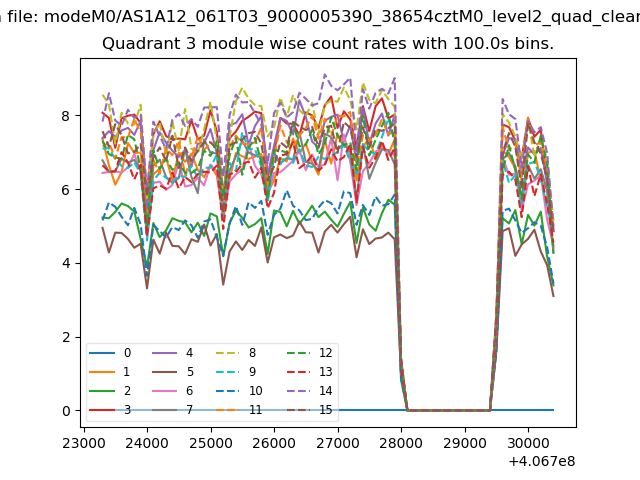 |
 |
| Parameter | Plot |
|---|---|
| CZT HV Monitor |  |
| D_VDD | 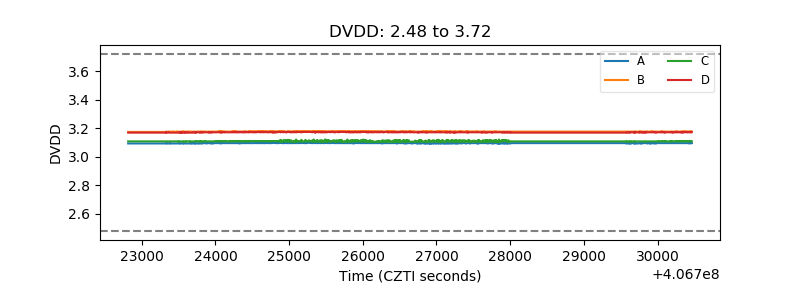 |
| Temperature 1 | 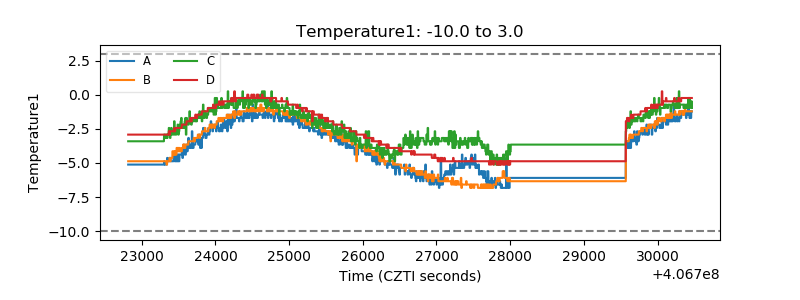 |
| Veto HV Monitor | 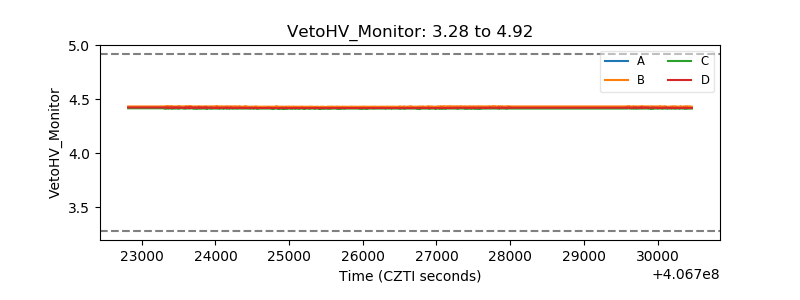 |
| Veto LLD | 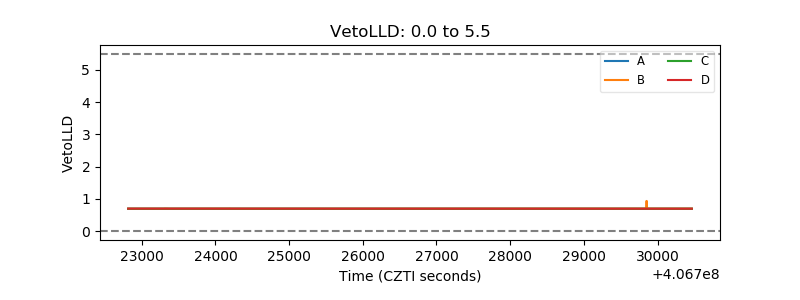 |
| Alpha Counter | 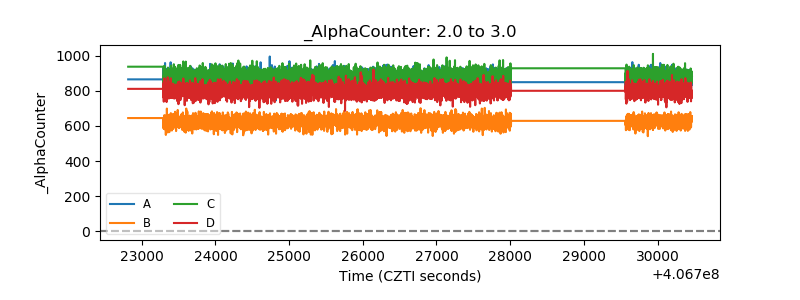 |
| _CPM_Rate | 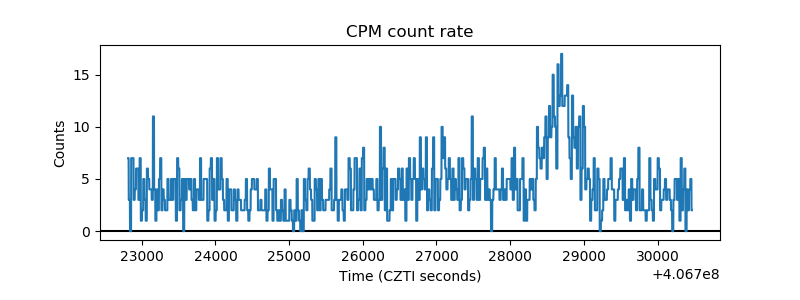 |
| CZT Counter | 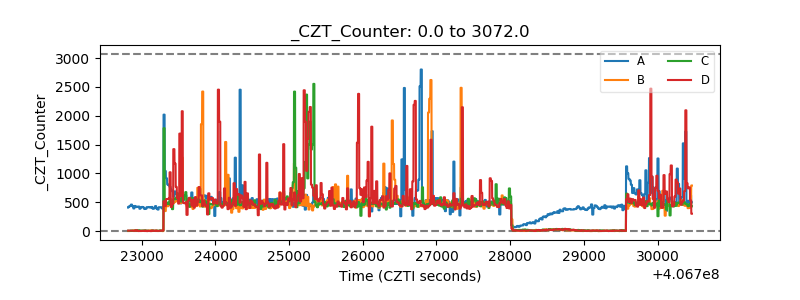 |
| +2.5 Volts monitor |  |
| +5 Volts monitor | 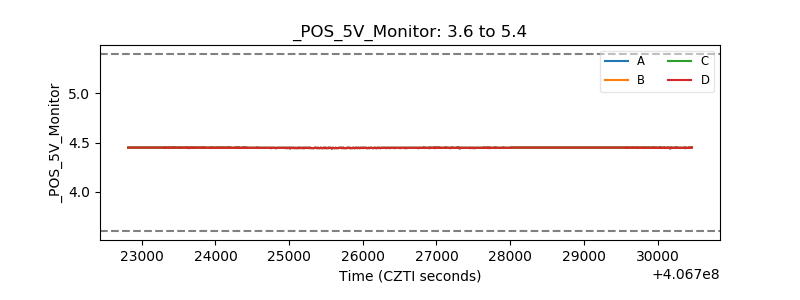 |
| _ROLL_ROT | 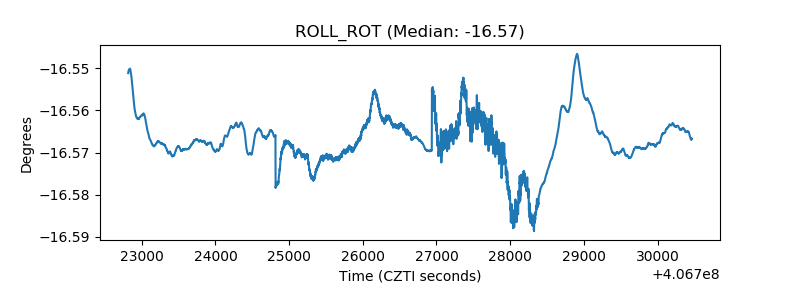 |
| _Roll_DEC | 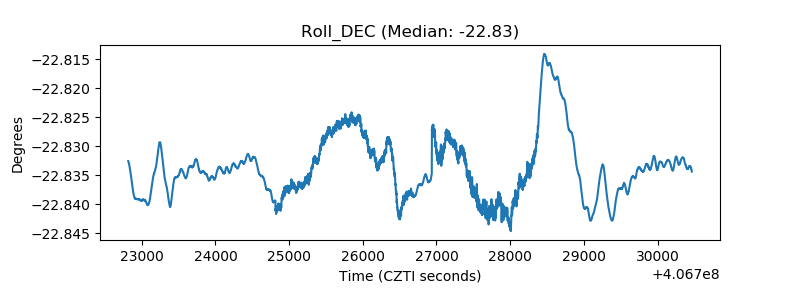 |
| _Roll_RA | 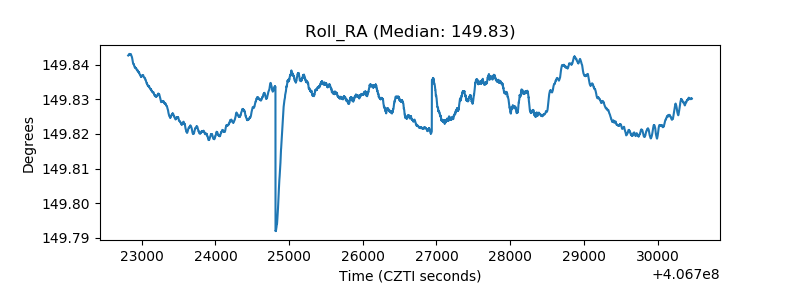 |
| Veto Counter | 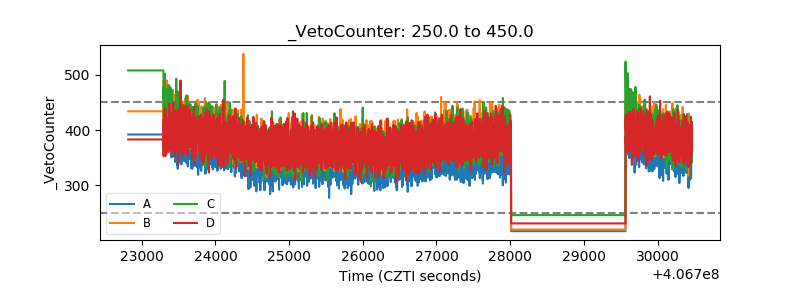 |