| Param | Original file | Final file |
|---|---|---|
| Filename | modeM0/AS1A12_061T03_9000005390_38655cztM0_level2.fits | modeM0/AS1A12_061T03_9000005390_38655cztM0_level2_quad_clean.evt |
| Size (bytes) | 371,177,280 | 99,250,560 |
| Size | 354.0 MB | 94.7 MB |
| Events in quadrant A | 3,556,235 | 657,765 |
| Events in quadrant B | 2,879,651 | 674,893 |
| Events in quadrant C | 3,082,030 | 657,193 |
| Events in quadrant D | 3,755,998 | 597,593 |
| Mode SS | |||
|---|---|---|---|
| Quadrant | BADHDUFLAG | Total packets | Discarded packets |
| A | 0 | 120 | 0 |
| B | 0 | 120 | 0 |
| C | 0 | 120 | 0 |
| D | 0 | 120 | 0 |
| Mode M9 | |||
|---|---|---|---|
| Quadrant | BADHDUFLAG | Total packets | Discarded packets |
| A | 0 | 21 | 0 |
| B | 0 | 21 | 0 |
| C | 0 | 21 | 0 |
| D | 0 | 22 | 0 |
| Mode M0 | |||
|---|---|---|---|
| Quadrant | BADHDUFLAG | Total packets | Discarded packets |
| A | 0 | 14146 | 3 |
| B | 0 | 12516 | 2 |
| C | 0 | 12747 | 2 |
| D | 0 | 15050 | 2 |
| Quadrant | Total seconds | Saturated seconds | Saturation percentage |
|---|---|---|---|
| A | 5987 | 59 | 0.985469% |
| B | 5987 | 35 | 0.584600% |
| C | 5987 | 39 | 0.651411% |
| D | 5987 | 161 | 2.689160% |
Noise dominated data is calculated using 1-second bins in cleaned event files. If a bin has >2000 counts, and if more than 50% of those come from <1% of pixels, then it is considered to be noise-dominated and hence unusable.
| Quadrant | # 1 sec bins | Bins with >0 counts | Bins with >2000 counts | High rate bins dominated by noise | Noise dominated (total time) | Noise dominated (detector-on time) | Marked lightcurve |
|---|---|---|---|---|---|---|---|
| A | 7330 | 5988 | 36 | 36 | 0.49% | 0.60% | 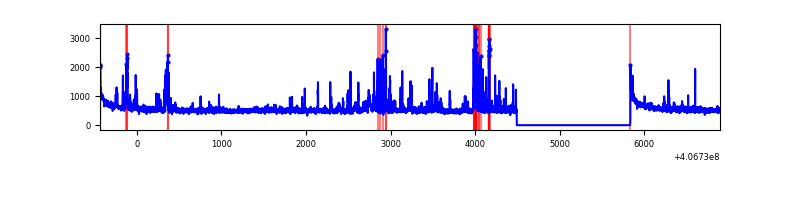 |
| B | 7330 | 5988 | 26 | 26 | 0.35% | 0.43% | 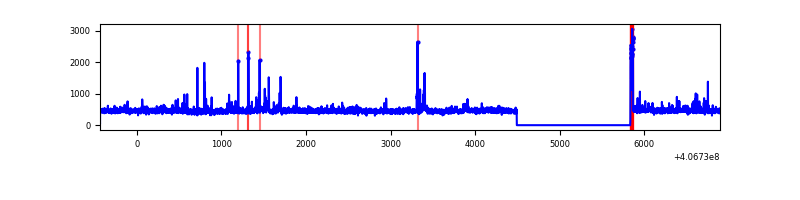 |
| C | 7330 | 5988 | 21 | 21 | 0.29% | 0.35% | 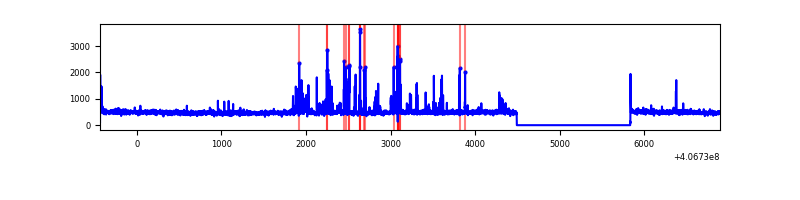 |
| D | 7330 | 5988 | 145 | 145 | 1.98% | 2.42% | 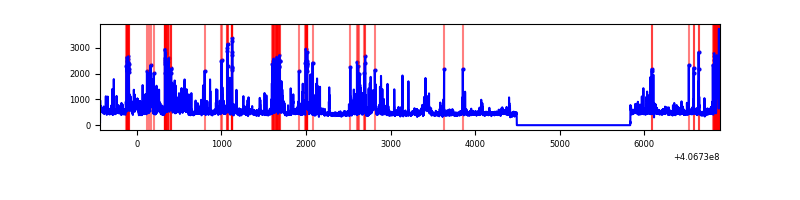 |
Top three noisy pixels from each quadrant. If the there are fewer than three noisy pixels in the level2.evt file, extra rows are filled as -1
| Pixel properties | Quadrant properties | ||||||
|---|---|---|---|---|---|---|---|
| Quadrant | DetID | PixID | Counts | Sigma | Mean | Median | Sigma |
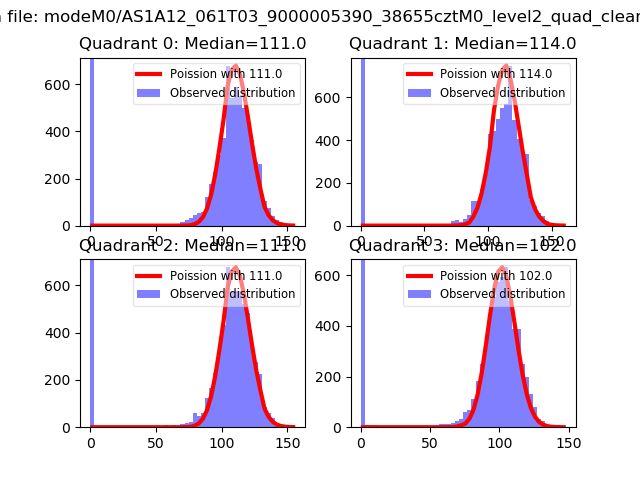
| A | 10 | 83 | 469787 | 3422.91 | 670 | 655 | 137.1 |
| A | 9 | 143 | 262264 | 1908.77 | 670 | 655 | 137.1 |
| A | 13 | 248 | 163850 | 1190.71 | 670 | 655 | 137.1 |
| B | 5 | 184 | 130708 | 1003.88 | 671 | 653 | 129.6 |
| B | 0 | 221 | 22731 | 170.42 | 671 | 653 | 129.6 |
| B | 5 | 172 | 21088 | 157.73 | 671 | 653 | 129.6 |
| C | 15 | 214 | 240862 | 1549.79 | 661 | 665 | 155.0 |
| C | 14 | 254 | 227691 | 1464.81 | 661 | 665 | 155.0 |
| C | 0 | 10 | 11264 | 68.39 | 661 | 665 | 155.0 |
| D | 13 | 249 | 451321 | 2793.61 | 658 | 639 | 161.3 |
| D | 5 | 222 | 325600 | 2014.31 | 658 | 639 | 161.3 |
| D | 12 | 233 | 120476 | 742.83 | 658 | 639 | 161.3 |
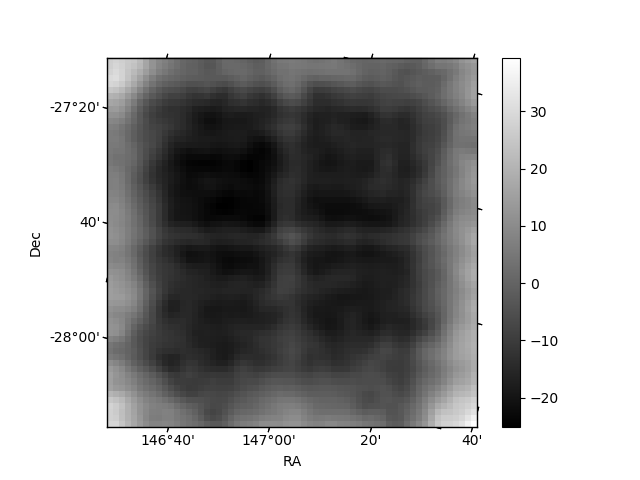
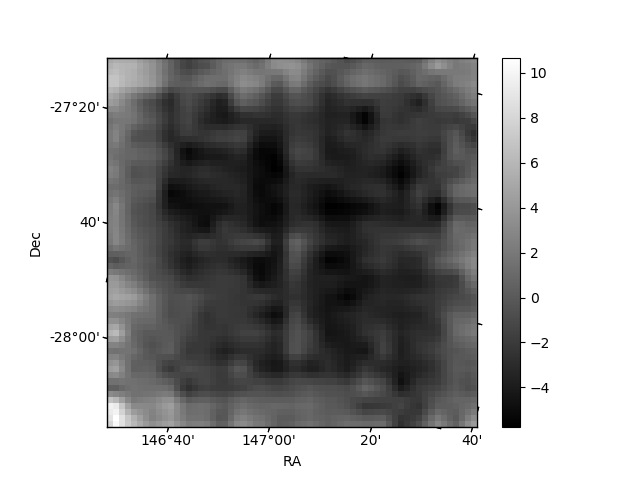
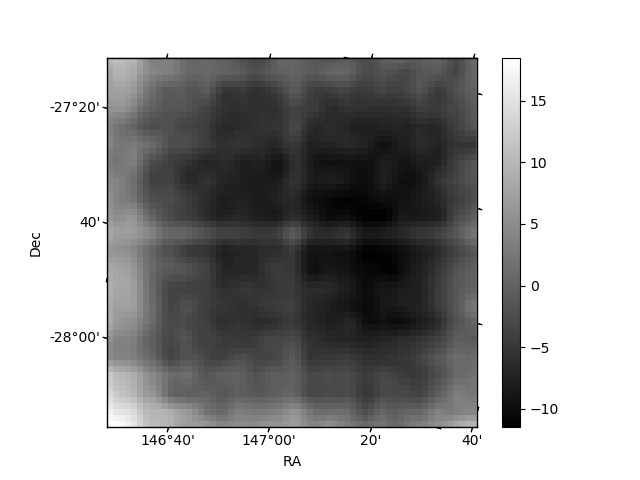
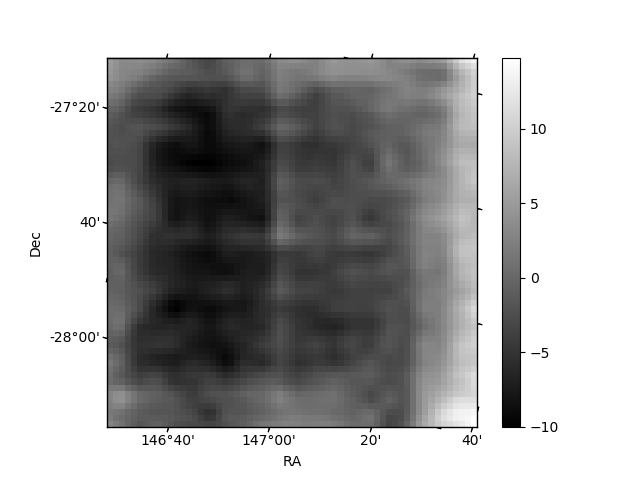
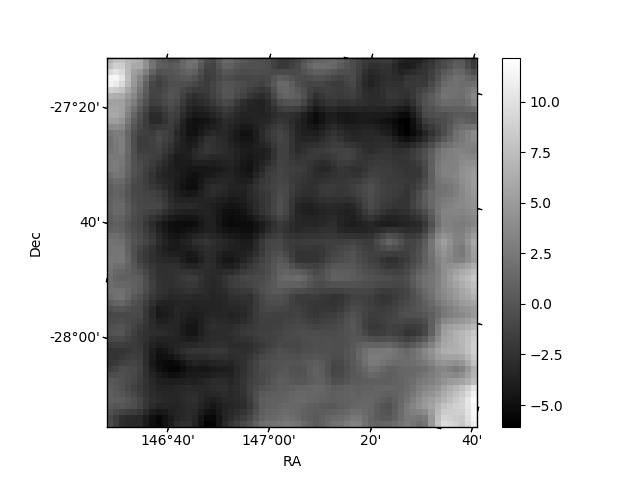
Histogram calculated using DETX and DETY for each event in the final _common_clean file
| Quadrant A | 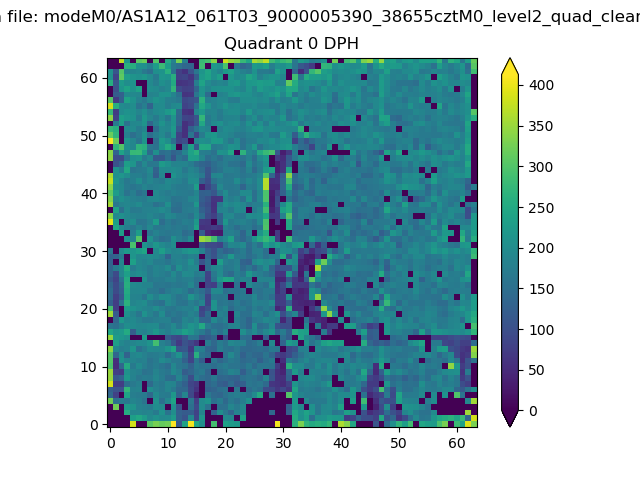 |
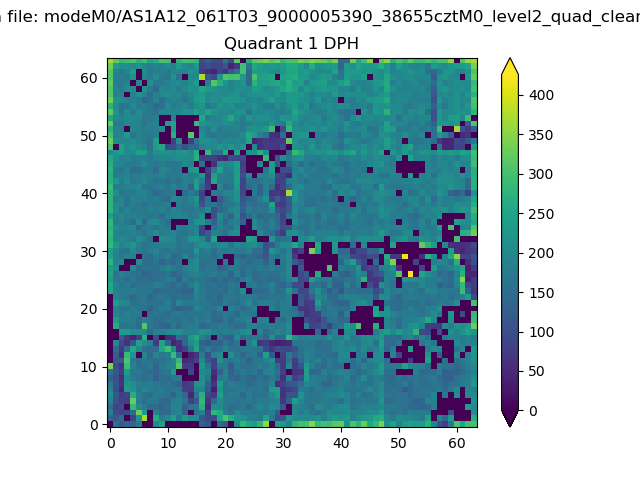 |
Quadrant B |
|---|---|---|---|
| Quadrant D | 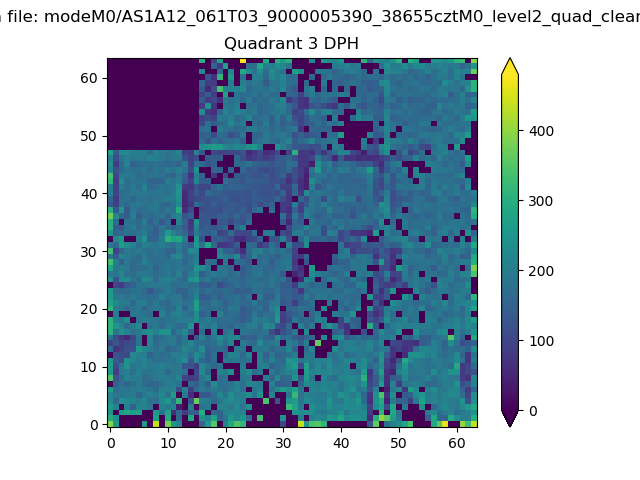 |
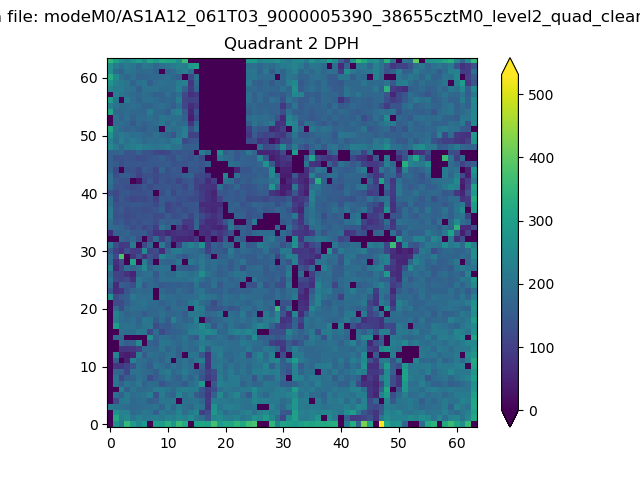 |
Quadrant C |
| Plot type | Count rate plots | Images |
|---|---|---|
| Comparison with Poisson distribution Blue bars denote a histogram of data divided into 1 sec bins. Red curve is a Poisson curve with rate = median count rate of data. |
 |
 |
| Quadrant-wise count rates Data is divided into 100 sec bins |
 |
|
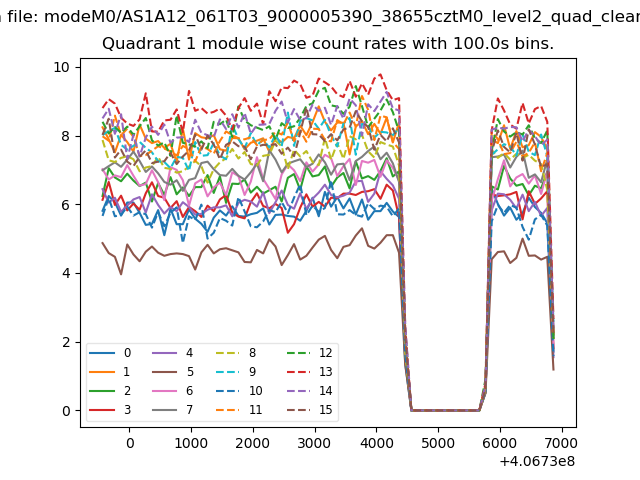
| Module-wise count rates for Quadrant A Data is divided into 100 sec bins |
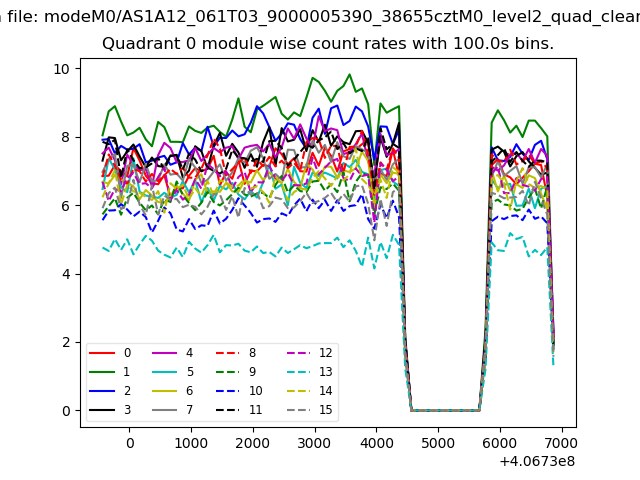 |
 |
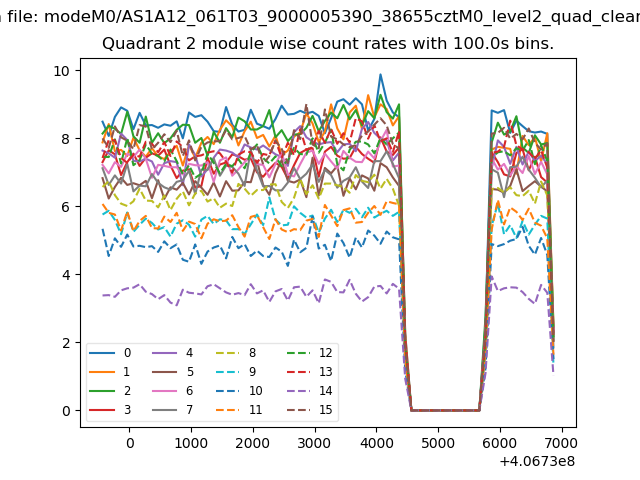
| Module-wise count rates for Quadrant B Data is divided into 100 sec bins |
 |
 |
| Module-wise count rates for Quadrant C Data is divided into 100 sec bins |
 |
 |
| Module-wise count rates for Quadrant D Data is divided into 100 sec bins |
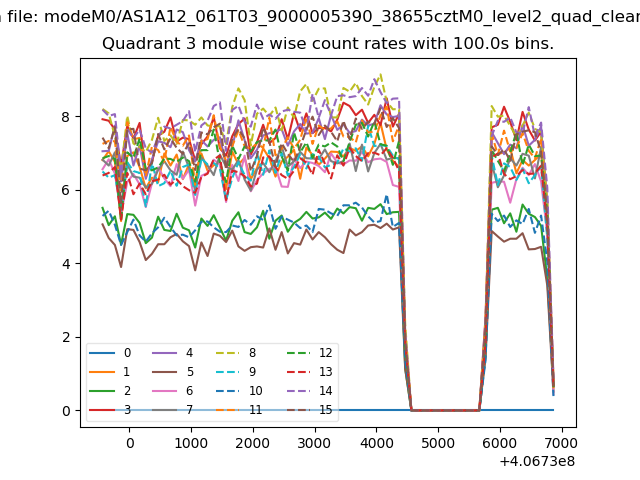 |
 |
| Parameter | Plot |
|---|---|
| CZT HV Monitor | 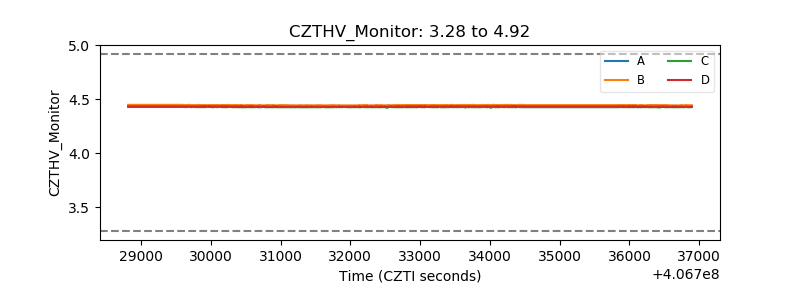 |
| D_VDD | 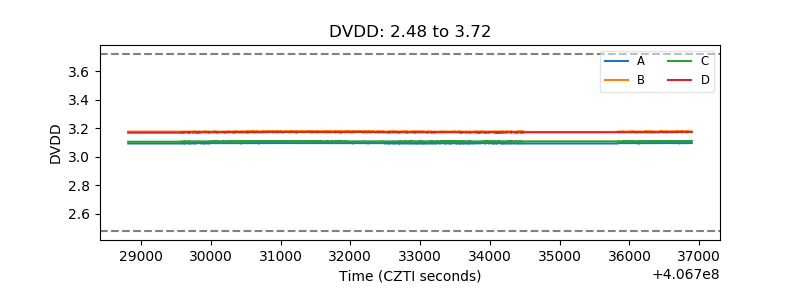 |
| Temperature 1 | 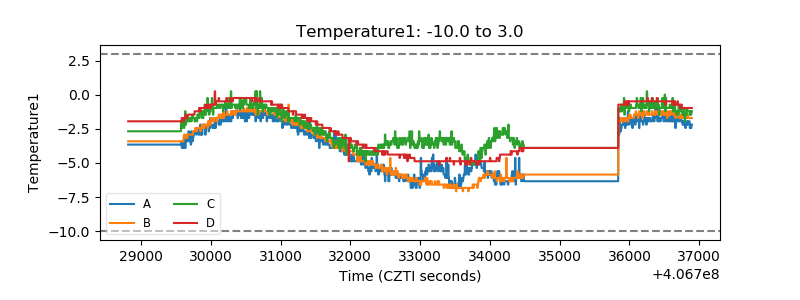 |
| Veto HV Monitor | 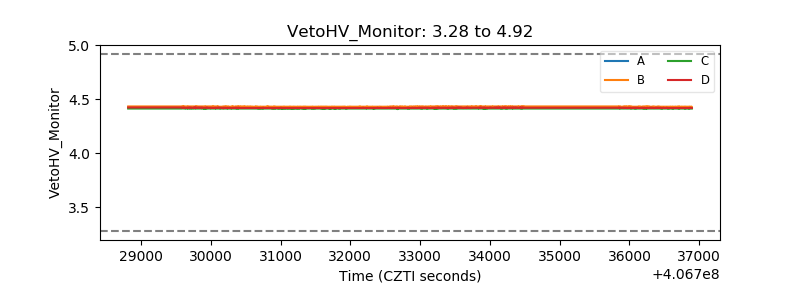 |
| Veto LLD | 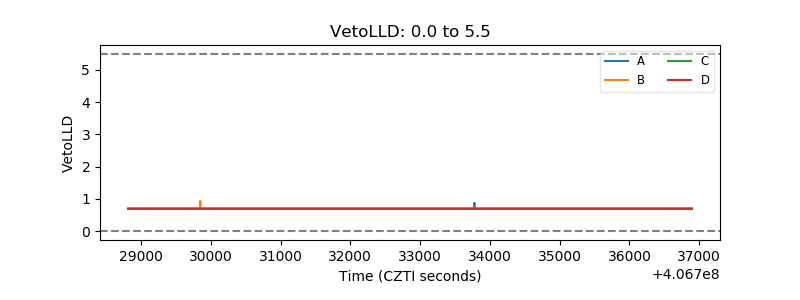 |
| Alpha Counter | 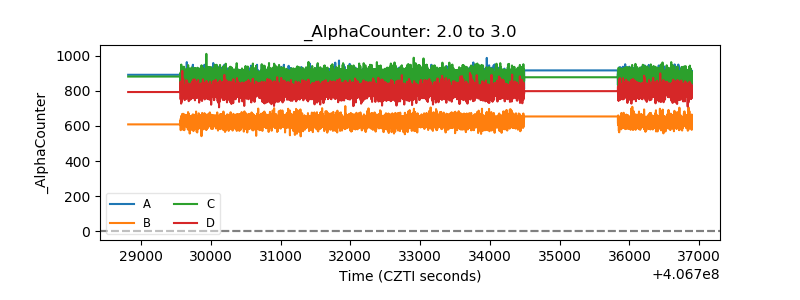 |
| _CPM_Rate | 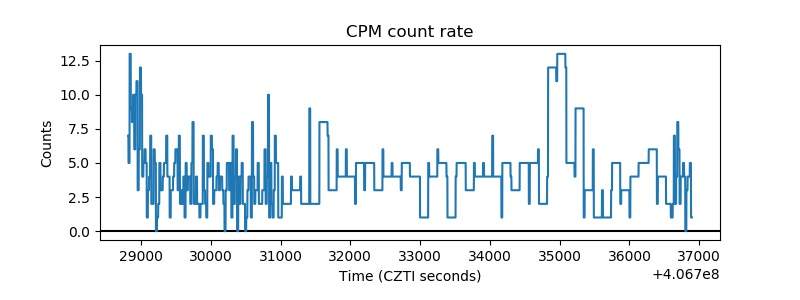 |
| CZT Counter | 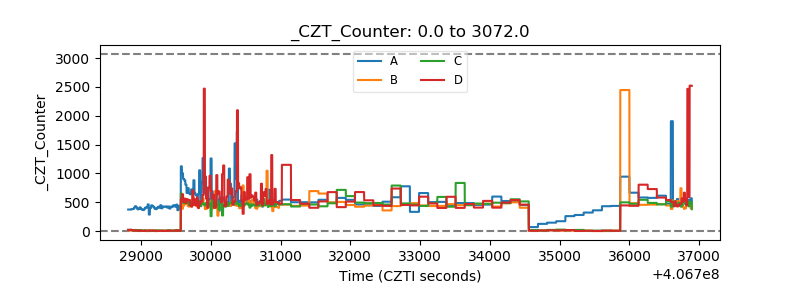 |
| +2.5 Volts monitor | 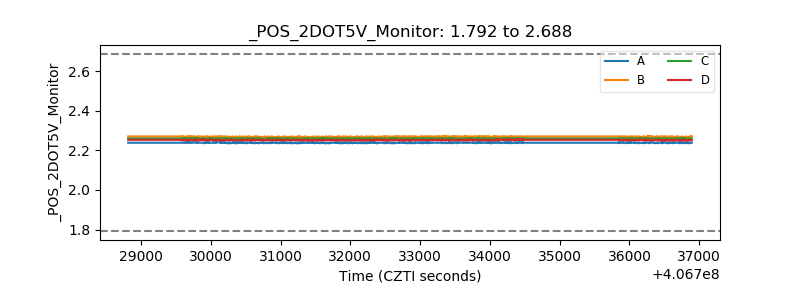 |
| +5 Volts monitor | 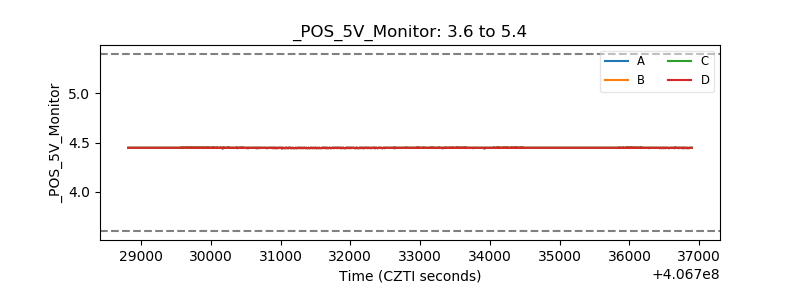 |
| _ROLL_ROT |  |
| _Roll_DEC | 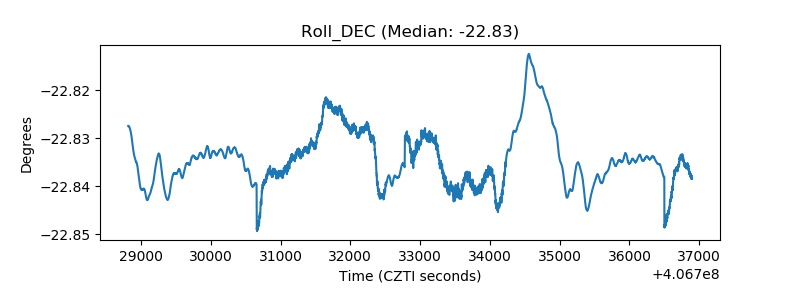 |
| _Roll_RA | 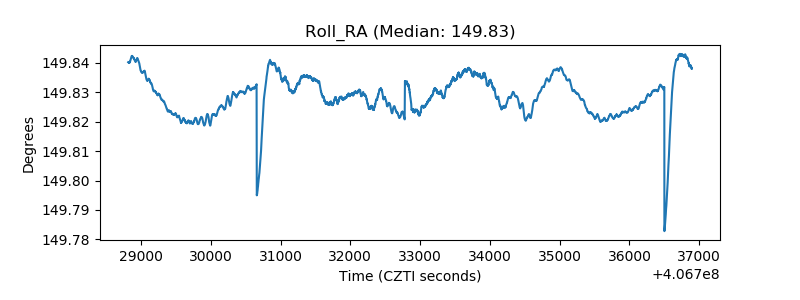 |
| Veto Counter | 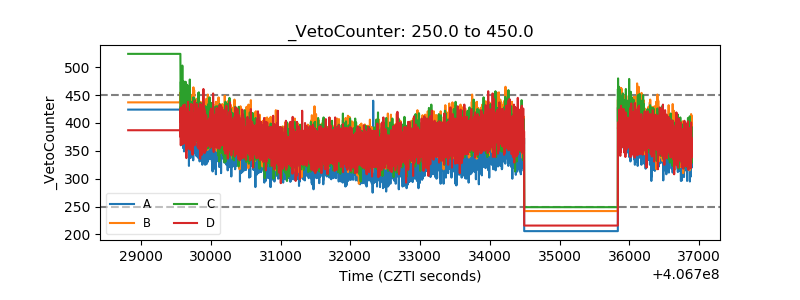 |