| Param | Original file | Final file |
|---|---|---|
| Filename | modeM0/AS1A12_061T03_9000005390_38656cztM0_level2.fits | modeM0/AS1A12_061T03_9000005390_38656cztM0_level2_quad_clean.evt |
| Size (bytes) | 178,004,160 | 36,420,480 |
| Size | 169.8 MB | 34.7 MB |
| Events in quadrant A | 1,272,220 | 253,189 |
| Events in quadrant B | 1,192,406 | 255,154 |
| Events in quadrant C | 1,100,127 | 252,111 |
| Events in quadrant D | 2,840,681 | 174,655 |
| Mode SS | |||
|---|---|---|---|
| Quadrant | BADHDUFLAG | Total packets | Discarded packets |
| A | 0 | 46 | 0 |
| B | 0 | 46 | 0 |
| C | 0 | 46 | 0 |
| D | 0 | 46 | 0 |
| Mode M9 | |||
|---|---|---|---|
| Quadrant | BADHDUFLAG | Total packets | Discarded packets |
| A | 0 | 11 | 0 |
| B | 0 | 11 | 0 |
| C | 0 | 11 | 0 |
| D | 0 | 12 | 0 |
| Mode M0 | |||
|---|---|---|---|
| Quadrant | BADHDUFLAG | Total packets | Discarded packets |
| A | 0 | 5158 | 1 |
| B | 0 | 5092 | 1 |
| C | 0 | 4707 | 1 |
| D | 0 | 9955 | 1 |
| Quadrant | Total seconds | Saturated seconds | Saturation percentage |
|---|---|---|---|
| A | 2329 | 8 | 0.343495% |
| B | 2329 | 33 | 1.416917% |
| C | 2329 | 1 | 0.042937% |
| D | 2329 | 677 | 29.068270% |
Noise dominated data is calculated using 1-second bins in cleaned event files. If a bin has >2000 counts, and if more than 50% of those come from <1% of pixels, then it is considered to be noise-dominated and hence unusable.
| Quadrant | # 1 sec bins | Bins with >0 counts | Bins with >2000 counts | High rate bins dominated by noise | Noise dominated (total time) | Noise dominated (detector-on time) | Marked lightcurve |
|---|---|---|---|---|---|---|---|
| A | 2329 | 2329 | 1 | 1 | 0.04% | 0.04% | 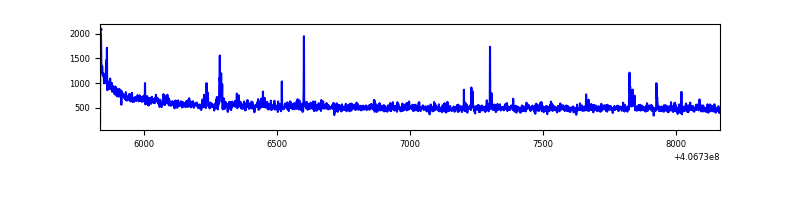 |
| B | 2329 | 2329 | 23 | 23 | 0.99% | 0.99% | 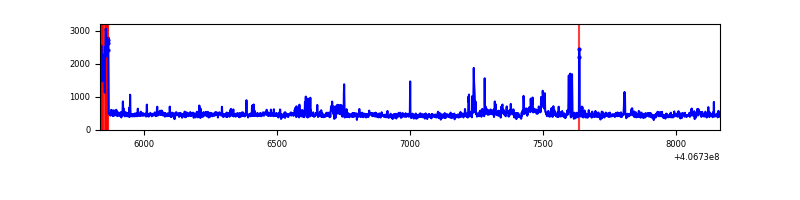 |
| C | 2329 | 2329 | 0 | 0 | 0.00% | 0.00% | 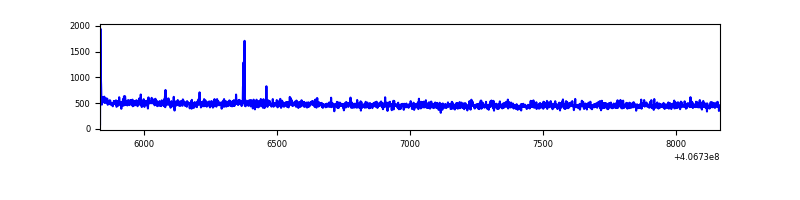 |
| D | 2329 | 2329 | 603 | 603 | 25.89% | 25.89% | 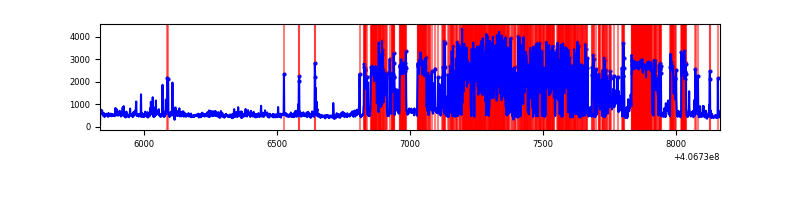 |
Top three noisy pixels from each quadrant. If the there are fewer than three noisy pixels in the level2.evt file, extra rows are filled as -1
| Pixel properties | Quadrant properties | ||||||
|---|---|---|---|---|---|---|---|
| Quadrant | DetID | PixID | Counts | Sigma | Mean | Median | Sigma |
| A | 10 | 83 | 212828 | 3812.77 | 261 | 255 | 55.8 |
| A | 13 | 248 | 20426 | 361.79 | 261 | 255 | 55.8 |
| A | 9 | 143 | 10437 | 182.63 | 261 | 255 | 55.8 |
| B | 5 | 184 | 117755 | 2272.08 | 257 | 251 | 51.7 |
| B | 0 | 213 | 18639 | 355.55 | 257 | 251 | 51.7 |
| B | 5 | 172 | 14815 | 281.61 | 257 | 251 | 51.7 |
| C | 15 | 214 | 96124 | 1578.3 | 253 | 255 | 60.7 |
| C | 14 | 254 | 6792 | 107.62 | 253 | 255 | 60.7 |
| C | 0 | 10 | 4691 | 73.03 | 253 | 255 | 60.7 |
| D | 13 | 249 | 1699555 | 31129.38 | 214 | 208 | 54.6 |
| D | 12 | 233 | 126109 | 2306.31 | 214 | 208 | 54.6 |
| D | 5 | 222 | 61304 | 1119.18 | 214 | 208 | 54.6 |
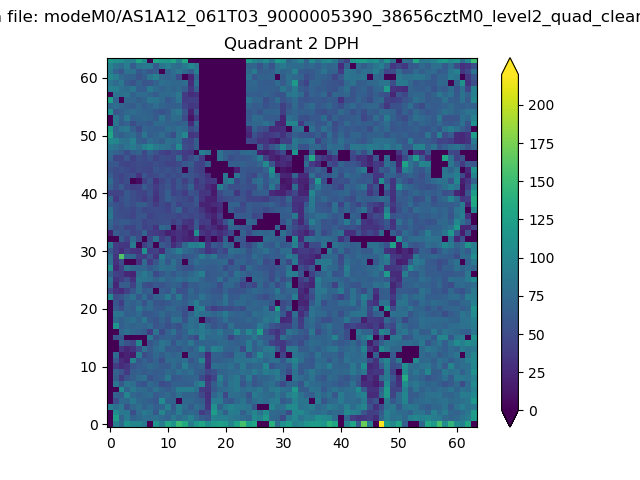
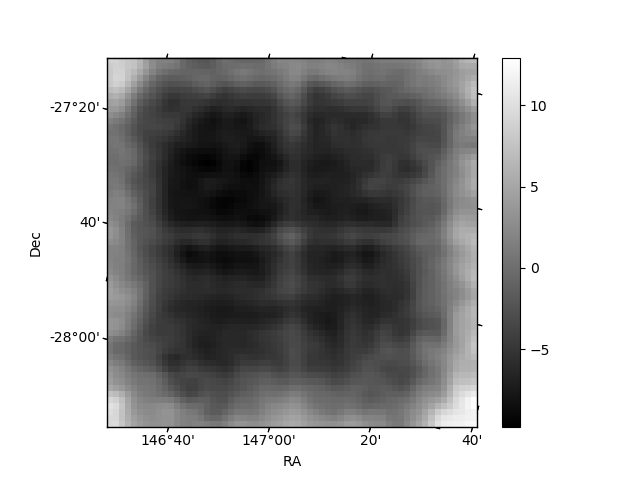
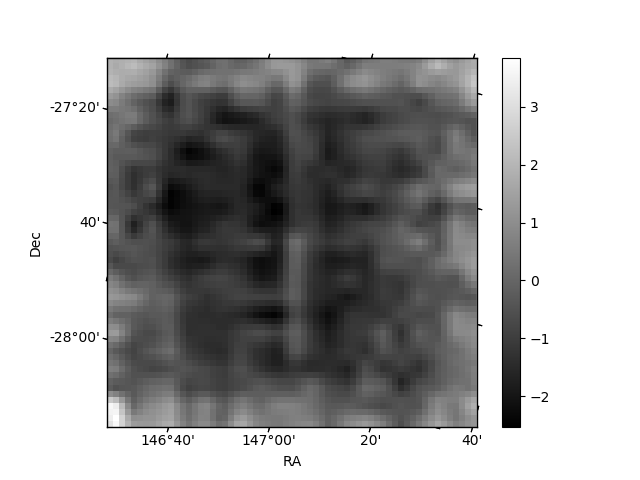
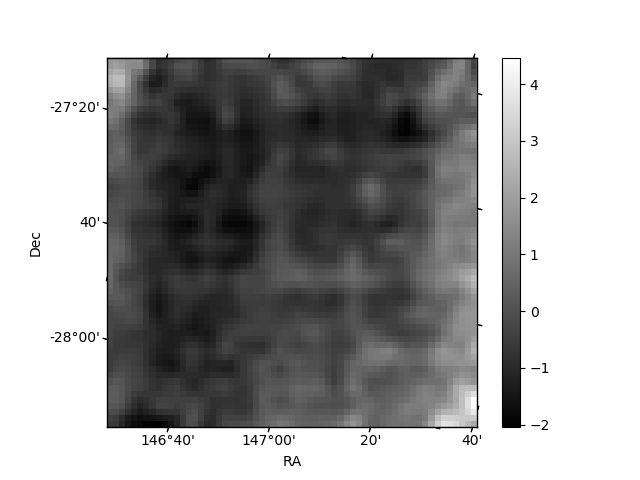
Histogram calculated using DETX and DETY for each event in the final _common_clean file
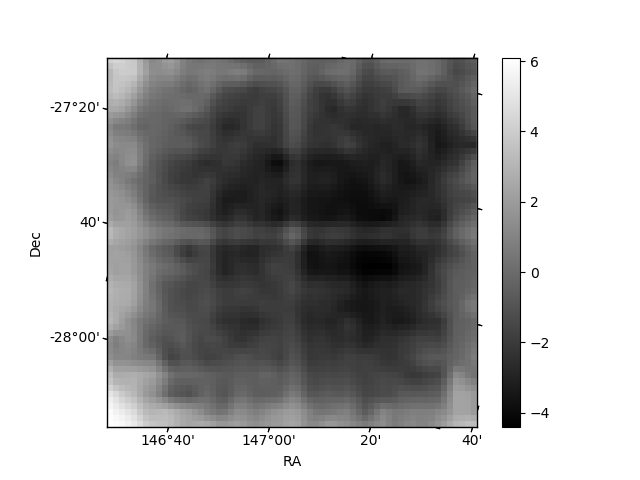
| Quadrant A | 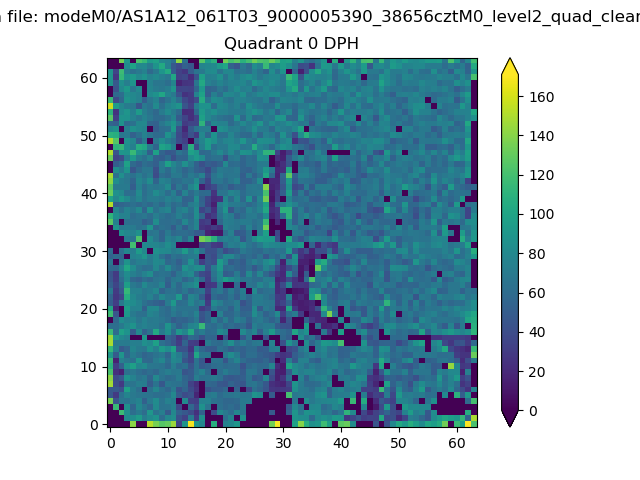 |
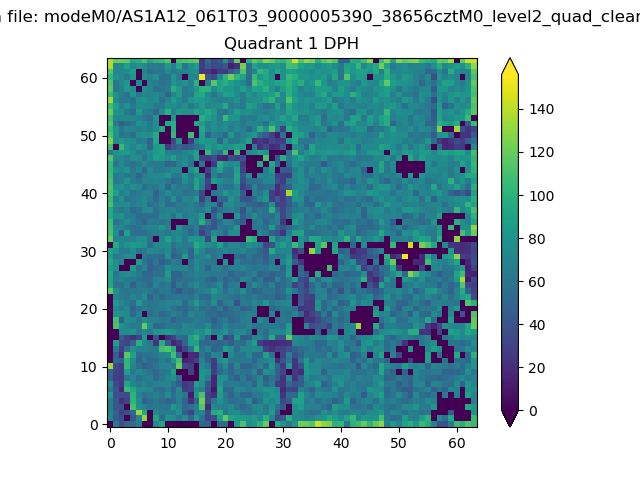 |
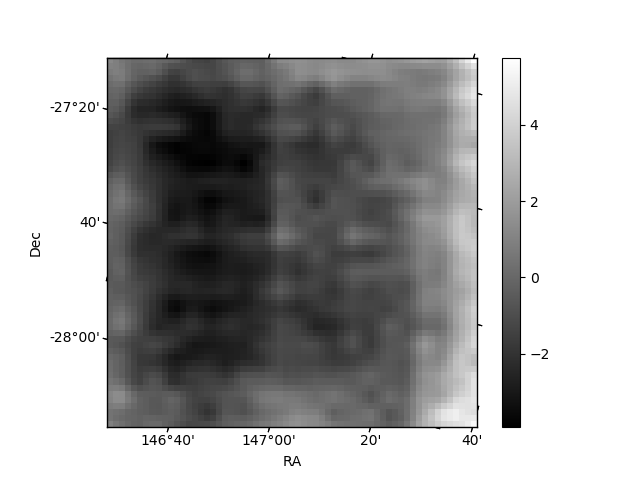
Quadrant B |
|---|---|---|---|
| Quadrant D | 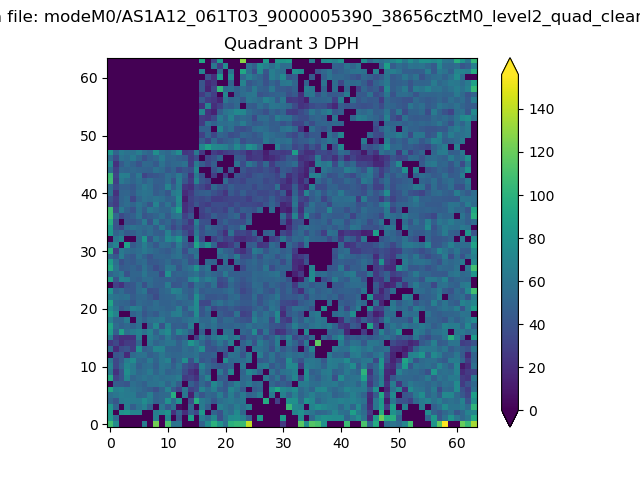 |
 |
Quadrant C |
| Plot type | Count rate plots | Images |
|---|---|---|
| Comparison with Poisson distribution Blue bars denote a histogram of data divided into 1 sec bins. Red curve is a Poisson curve with rate = median count rate of data. |
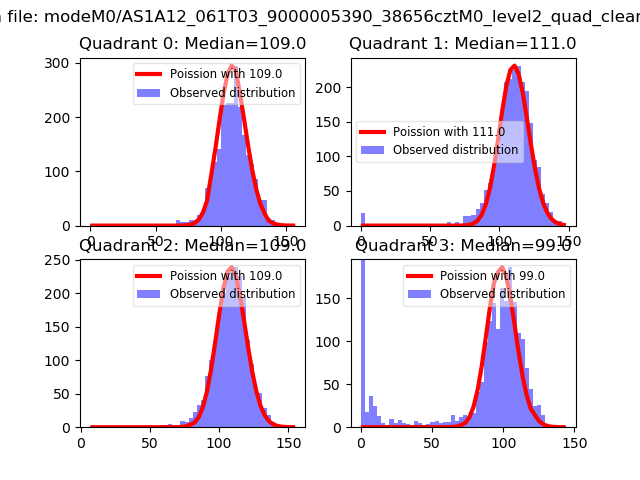 |
 |
| Quadrant-wise count rates Data is divided into 100 sec bins |
 |
|
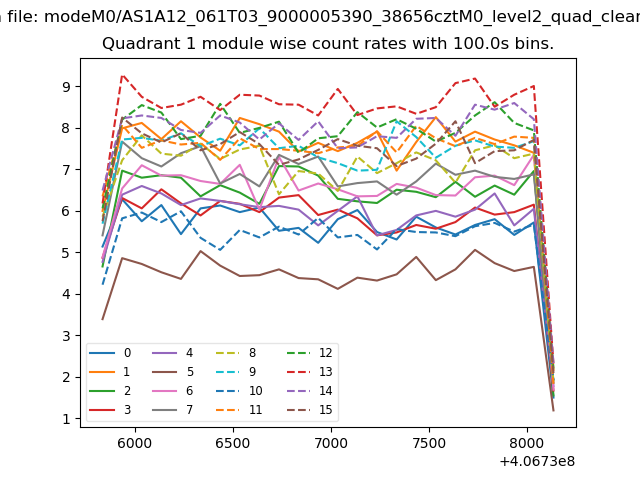
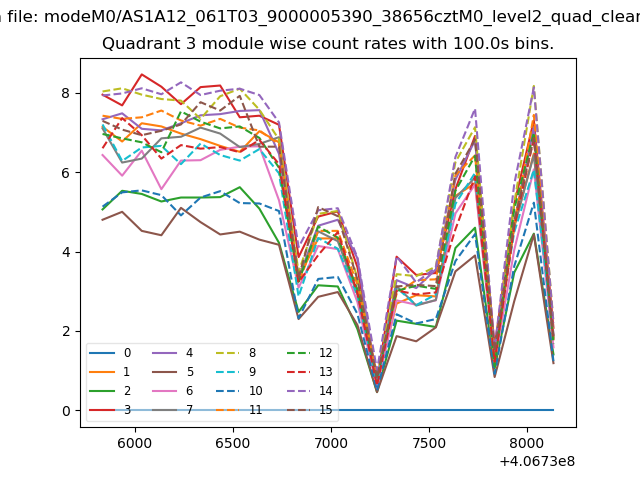
| Module-wise count rates for Quadrant A Data is divided into 100 sec bins |
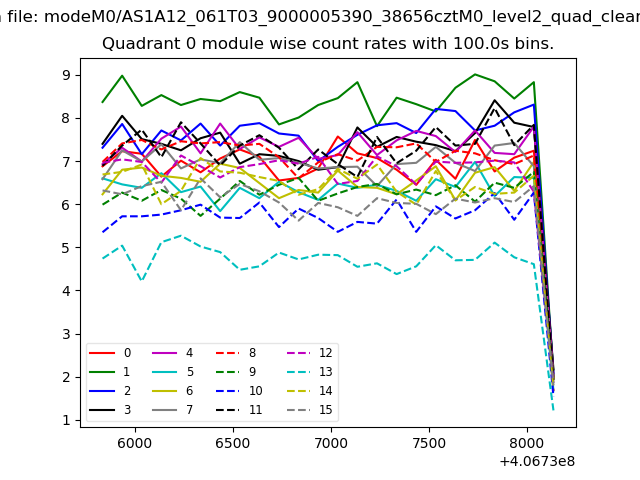 |
 |
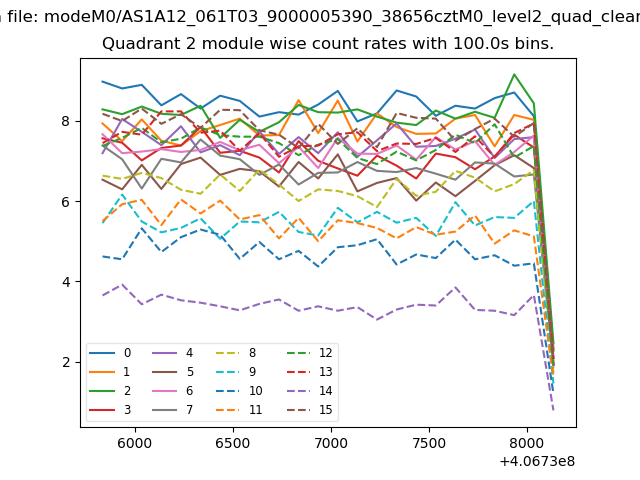
| Module-wise count rates for Quadrant B Data is divided into 100 sec bins |
 |
 |
| Module-wise count rates for Quadrant C Data is divided into 100 sec bins |
 |
 |
| Module-wise count rates for Quadrant D Data is divided into 100 sec bins |
 |
 |
| Parameter | Plot |
|---|---|
| CZT HV Monitor | 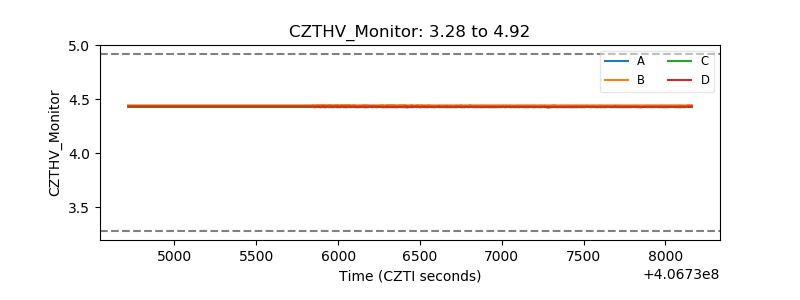 |
| D_VDD | 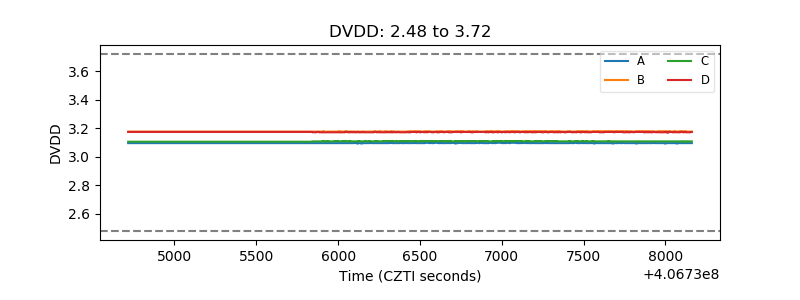 |
| Temperature 1 | 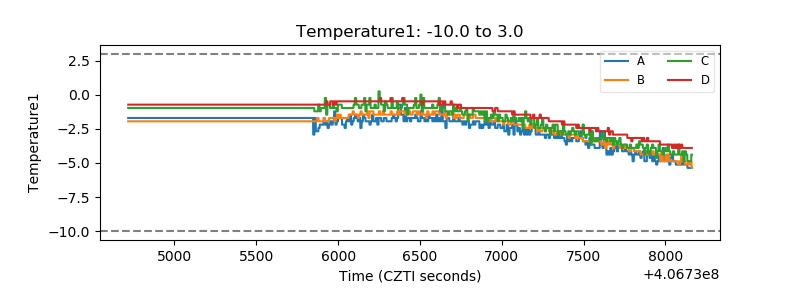 |
| Veto HV Monitor | 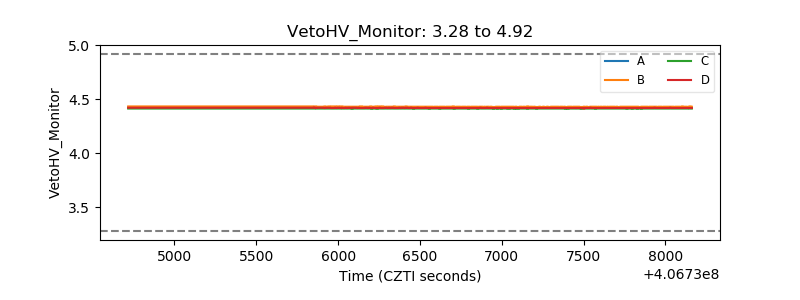 |
| Veto LLD | 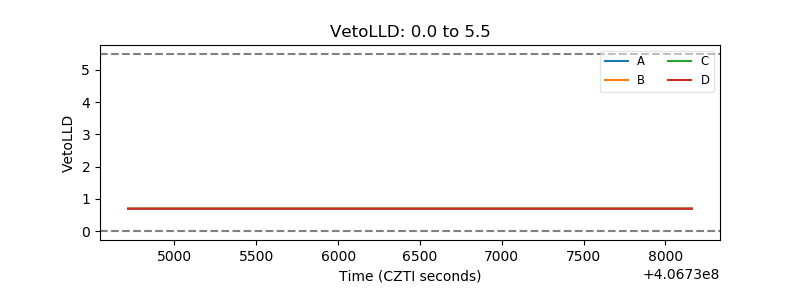 |
| Alpha Counter | 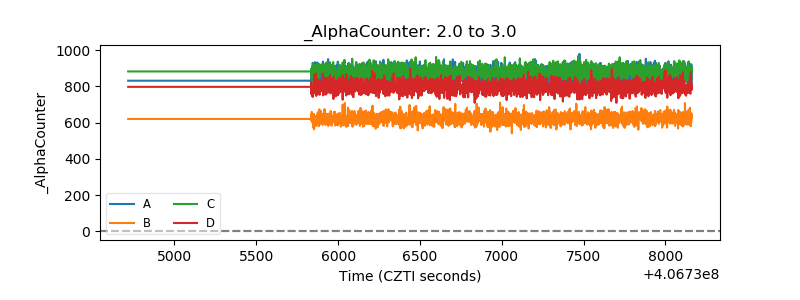 |
| _CPM_Rate |  |
| CZT Counter | 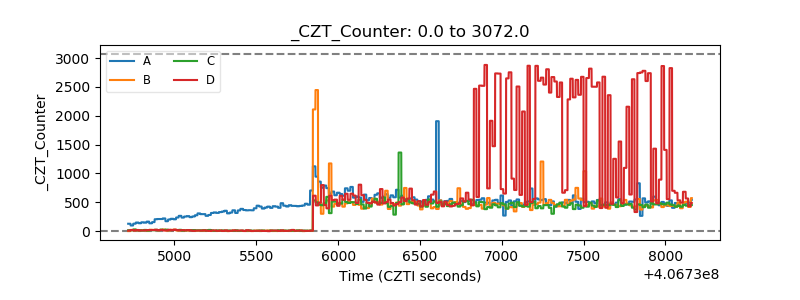 |
| +2.5 Volts monitor | 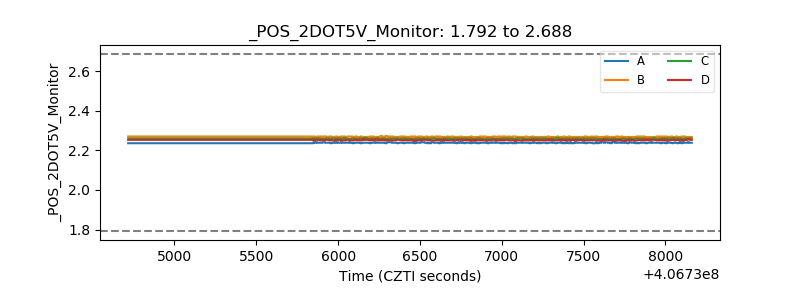 |
| +5 Volts monitor | 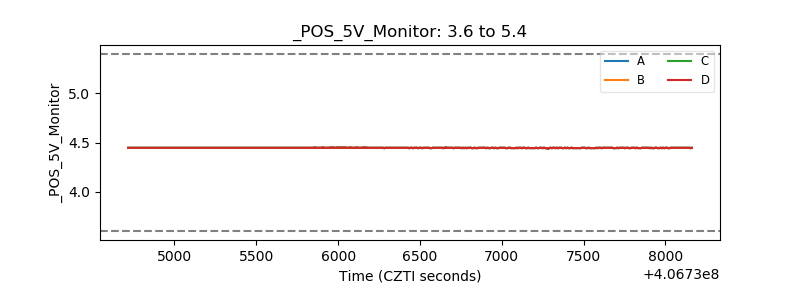 |
| _ROLL_ROT | 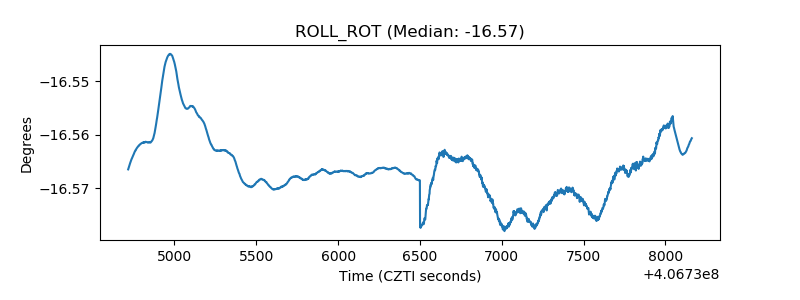 |
| _Roll_DEC | 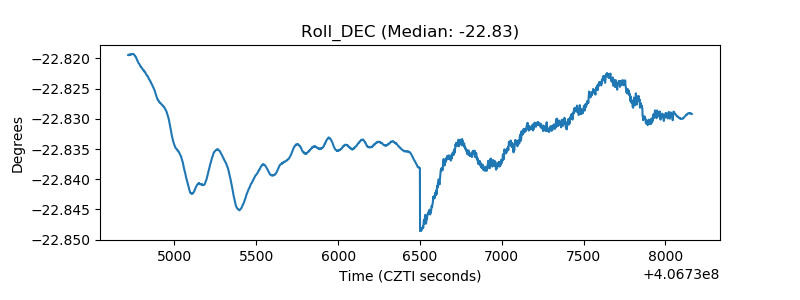 |
| _Roll_RA | 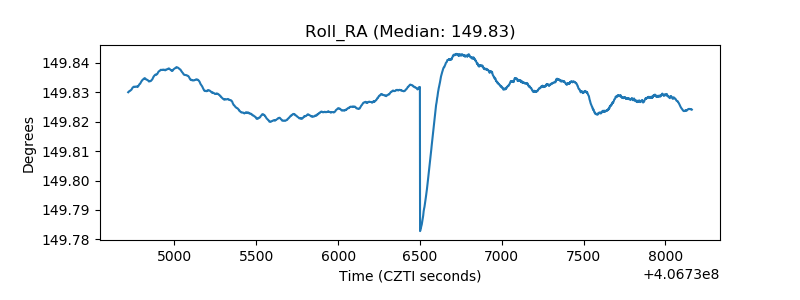 |
| Veto Counter | 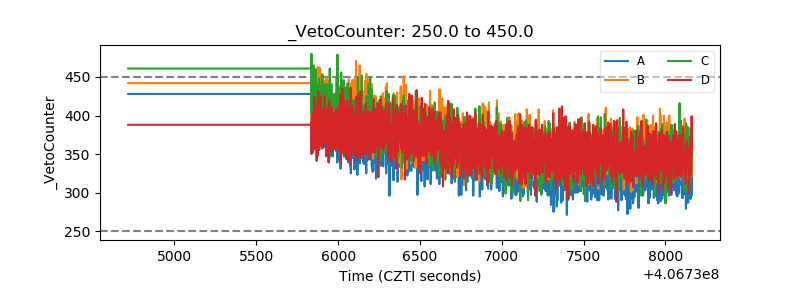 |